

Abstract
Distal arthrogryposis is the most common known heritable cause of congenital contractures (e.g. clubfoot) and results from mutations in genes that encode proteins of the contractile complex of skeletal muscle cells. Mutations are most frequently found in MYH3 and are predicted to impair the function of embryonic myosin. We measured the contractile properties of individual skeletal muscle cells and the activation and relaxation kinetics of isolated myofibrils from two adult individuals with an R672C substitution in embryonic myosin and distal arthrogryposis syndrome 2A (DA2A) or Freeman-Sheldon syndrome. In R672C-containing muscle cells, we observed reduced specific force, a prolonged time to relaxation and incomplete relaxation (elevated residual force). In R672C-containing muscle myofibrils, the initial, slower phase of relaxation had a longer duration and slower rate, and time to complete relaxation was greatly prolonged. These observations can be collectively explained by a small subpopulation of myosin cross-bridges with greatly reduced detachment kinetics, resulting in a slower and less complete deactivation of thin filaments at the end of contractions. These findings have important implications for selecting and testing directed therapeutic options for persons with DA2A and perhaps congenital contractures in general.
Introduction
Congenital contractures (i.e. restricted movement around a joint(s)) such as clubfoot affect ∼1 of every 200–500 live births in the United States, and are caused by a combination of genetic and environmental risk factors (1–10). The distal arthrogryposis syndromes are a group of 10 autosomal dominant disorders characterized by congenital contractures, most notably clubfoot and camptodactyly (i.e. flexion contractures of the fingers or toes) (11). To date, we and others have discovered that distal arthrogryposis syndromes can be caused by mutations in each of at least six genes that encode proteins of the skeletal muscle contractile complex including: troponin I, troponin T, β-tropomyosin, embryonic myosin, perinatal myosin and myosin-binding protein C (12–22).
Despite the identification of genes underlying distal arthrogryposis syndromes, the mechanism(s) by which perturbation of the contractile complex results in contractures has remained unclear. Several studies have examined the functional consequences of either troponin or tropomyosin mutants (23,24), which together account for <20% of cases (12,13,16–18,20,25,26). The outcomes of these studies have been mixed and difficult to reconcile, much less generalize across these disorders. Further inferences about possible mechanisms have been made from studies of homologous proteins found in individuals with conventional myopathies (e.g. nemaline myopathy) (27). However, unlike conventional myopathies, weakness is not a prominent feature of distal arthrogryposis syndromes. This suggests that mutations that cause distal arthrogryposis syndromes have distinct and novel effects on the contractile apparatus.
Both the most common [i.e. DA2B or Sheldon-Hall syndrome (SHS; OMIM#601680)] and the most severe [i.e. DA2A or Freeman-Sheldon syndrome (FSS; OMIM#193700)] DA syndromes are associated with mutations in MYH3, which encodes embryonic myosin. Utilizing a variety of complementary techniques to measure parameters of muscle contractility, we evaluated skeletal muscle from two unrelated persons with DA2A (i.e. DA2A-1 and DA2A-2; see Materials and Methods for a detailed description of the clinical characteristics of both individuals) caused by an R672C substitution in embryonic myosin. We report that in DA2A muscle cells specific force is reduced and the time to full relaxation is significantly increased compared with controls. Additionally, in DA2A muscle myofibrils, we demonstrate alterations in the early, slow phase of relaxation and the relaxed muscle cell state. Moreover, while the expression of MYH3 has been considered to be limited to fetal development and shortly thereafter, we found that MYH3 mRNA and embryonic myosin protein are present in both normal adult and fetal skeletal muscle. This finding suggests that mutations in MYH3 could affect contractility and relaxation in both prenatal and adult human skeletal muscles.
Results
MYH3 and embryonic myosin protein are expressed in adult skeletal muscle
The expression of myosin isoforms is developmentally regulated, and MYH3 expression is downregulated in skeletal muscle toward the end of gestation in rat, mouse and human (28–30). Additionally, contractures in persons with distal arthrogryposis are, in general, not progressive after birth, suggesting that any perturbation of contractility is mitigated postnatally. Consistent with these observations, we and others have hypothesized that MYH3 transcript and the resulting embryonic myosin protein are not expressed in adults and that the major effects of defects of embryonic myosin on muscle cell contractility occur prenatally. To test this hypothesis, we examined the expression of MYH3 RNA and embryonic myosin protein in normal adult muscle cells, and found that both MYH3 RNA and embryonic myosin were expressed (Fig. 1A and B). While embryonic myosin heavy chain is a substantially slower myosin than adult isoforms (31,32), quantitative assessments of the control and DA2A samples showed DA2A does not express more embryonic myosin than controls (Fig. 1C and D). These results suggested that mutant embryonic myosin could continue to influence contractile function postnatally and set the stage for functional testing of muscle cells and myofibrils sampled postnatally.
Figure 1.

MYH3 mRNA and embryonic myosin protein are expressed in both fetal and adult human skeletal muscle. (A) Ethidium bromide stained agarose gel: 100 bp ladder (Lane 1); amplicons of MYH3 (Lane 2) and MYH2 (Lane 3) from genomic DNA; amplicons of MYH3 (Lane 4) and MYH2 (Lane 5) from human fetal skeletal muscle (19–22 weeks estimated gestational age) cDNA; amplicons of MYH3 (Lane 6) and MYH2 (Lane 7) from human adult skeletal muscle cDNA. Genomic amplicons included an intron so as to distinguish amplification of cDNA from genomic DNA. Expected product sizes were as follows: MYH3 genomic (313 bp), MYH3 mRNA/cDNA (206 bp), MYH2 genomic (264 bp) and MYH2 mRNA/cDNA (142 bp). (B) Western blot of proteins separated by SDS–PAGE hybridized with an anti-embryonic myosin antibody, showing the presence of embryonic myosin in adult control skeletal muscle cells. Control skeletal muscle from the gastrocnemius of a 163-day fetus, mixed muscle cells (Lane 1); single control adult muscle cells (Lanes 2–8). (C) Western blot of proteins separated by SDS–PAGE hybridized with an anti-embryonic myosin antibody, showing expression differences of embryonic myosin in adult DA2A (two individuals) and control (two individuals) skeletal muscle extracts, with anti-α-actin as a loading control. (D) Densitometry analysis of embryonic myosin expression between samples.
Force production is lower in demembranated DA2A muscle cells
To test the effect of the presence of the mutant embryonic myosin on force production and passive stiffness in the DA2A muscle cells, we performed in vitro force measurements on demembranated single muscle cell segments. The initial, pre-activated passive force (in the absence of Ca2+) was not different between DA2A-1 muscle cells [5.7 ± 1.1 mN/mm2 (n = 16)] and control muscle cells from two individuals [6.8 ± 1.1 mN/mm2 (n = 23), P = 0.22]. Active absolute force was obtained by subtracting this passive force (pCa 9.0) from the total steady-state force. For measures of active contraction, maximal Ca2+ activated force (Fmax; pCa 4.0) was typically determined first, cells were relaxed (pCa 9.0), then cells were placed in activation solutions containing progressively higher Ca2+ concentrations (decreasing pCa) for determination of the Ca2+ sensitivity of force. Muscle cells were then relaxed again, followed by a final measurement of Fmax (in pCa 4.0). The initial and final Fmax were compared, and loss of maximal force was <10% during the experimental protocol for all muscle fibers except one.
The maximum absolute force per muscle cell was greater for DA2A-1 [0.29 ± 0.04 mN (n = 17)] than for the two controls [0.19 ± 0.02 mN (n = 22), P = 0.019; Fig. 2A]. The average diameter of the DA2A-1 muscle cells (159 ± 8 µm) was significantly larger than that of control muscle cells (104 ± 7 µm, P = 0.0000010; Fig. 2B). Since all solutions contained 4% weight-by-volume Dextran (see Materials and Methods), which maintains the lattice spacing between thick and thin filaments of myofibrils at approximately the same spacing as intact muscle cells (33,34), the much larger diameter of DA2A-1 muscle cells suggests that they were hypertrophied compared with control muscle cells. Because of the much larger diameters, the maximum specific force (i.e. force per cross-sectional area) of DA2A-1 muscle cells [13.8 ± 1.6 mN/mm2 (n = 17)] was significantly less than that of control muscle cells [29.0 ± 5.5 mN/mm2 (n = 22), P = 0.0067; Figure 2C]. In muscle cells from DA2A-2, we observed a depression in specific active force [8.7 ± 0.9 mN/mm2 (n = 9), P = 0.0007] compared with control cells, but this depression was not linked to a larger fiber diameter [86 ± 4 µm (n = 22), P = 0.024].
Figure 2.

DA2A-1 muscle cells (black) hypertrophy and produce less specific force and relax more slowly than controls (white/gray), while cooperativity and calcium sensitivity remain unchanged. t-tests were used to compare DA2A-1 and control groups: double stars indicate P < 0.01, single stars indicate P < 0.05. (A) Maximum absolute force (per muscle cell) is significantly higher in DA2A-1 cells. (B) However, cell diameters are significantly wider in DA2A-1 muscle cells. (C) Therefore, maximum specific force (force per cross-sectional area) is drastically lower in DA2A-1 cells. (D) Force –pCa curves for all DA2A-1 cells versus (E) control cells, demonstrating increased variability in DA2A-affected cells. (F) Averaged cooperativity (nH) in DA2A-1 curves = 3.07 ± 0.8 (n = 11) versus control curves = 2.31 ± 0.20 (n = 11). Student's t-test showed that these differences were not significant for the P < 0.05 level. (G) Average pCa50 DA2A-1 curves = 5.53 ± 0.07 (n = 11) versus control curves = 5.58 ± 0.03 (n = 11). Student's t-test showed that these differences were not significant for the P < 0.05 level. (H) Relaxation of muscle cells is much slower in DA2A-1. Recordings of force generation of a control (top) and a DA2A-1 (bottom) muscle cell at maximal Ca2+ activation (pCa 4.0) followed by immersion in relaxing solution (pCa 9.0) with start of contraction (vertical line 1), start of relaxation (line 2), 50% relaxed (tREL,50) (line 3) and 90% relaxed (tREL,90) (line 4) indicated. (I) Average time (± S.E.M.) required to achieve 50% relaxation and 90% relaxation for control muscle cells (white bars, n = 9; gray bars, n = 2) and DA2A-1 muscle cells (black bars, n = 8). Student's t -test between individual groups are indicated: both controls required significantly less time to fully relax (P < 0.01).
The Ca2+ sensitivity of active contractile force was also determined for muscle cells from DA2A-1 and one control. The force–pCa relationship for individual cells is shown in Figure 2D (DA2A-1) and E (control), respectively. Ca2+ sensitivity of force was determined as the [Ca2+] at which half-maximal force was produced (pCa50) for each muscle cell, determined from Hill equation fits of the data (Materials and Methods). When the pCa50 values for individual muscle cells were averaged they did not differ significantly between DA2A-1 [pCa50 5.53 ± 0.07 (n = 11)] and control [pCa50 5.58 ± 0.03 (n = 11)] muscle cells. There was also no difference in the average slope (cooperativity; nH) of the force versus pCa curves. However, there was far greater variation in both of these parameters in DA2A-1 cells compared with control cells. This was not likely due to differences in muscle fiber types per se, as both DA2A-1 and the control samples contained a similar mix of fast and slow twitch muscle cells.
DA2A-1 muscle cells had a profoundly slower relaxation when moved from the well containing maximal Ca2+ activation solution (pCa 4.0) to one containing relaxation solution (pCa 9.0) compared with control cells (Fig. 2H). DA2A-1 muscle cells required 4-fold longer to reach 50% relaxation (P = 0.000049) and 10-fold longer to reach 90% relaxation (P = 0.00019; Fig. 2I), compared with control muscle cells. However, as relaxation kinetics are not accurately determined via exchange baths because the length of time required for Ca2+ to leave the cell is limited by diffusion, we next studied relaxation in more detail with isolated myofibrils.
DA2A myofibril contraction and relaxation kinetics are slower than control
Relaxation kinetics of DA2A and control muscle were then more accurately measured with myofibril preparations and rapid solution switching technology, where diffusion rates do not limit the assessment of the millisecond timescale of force generation and relaxation kinetics (Fig 3A–H). DA2A myofibrils produced a similar level of maximum specific force [DA2A-1: 14.8 ± 4.6 mN/mm2 (n = 13), P = 0.70; DA2A-2: 8.5 ± 1.6 mN/mm2 (n = 12), P = 0.19] as control myofibrils [12.7 ± 2.7 mN/mm2 (n = 30); Fig. 3C]. However, the force generation and relaxation kinetics differed for DA2A versus control muscle myofibrils (Fig. 3A). The rate of force generation following a step change in Ca2+ (kACT) from pCa 9.0 to 4.0 was significantly slower for myofibrils from DA2A-1 [0.21 ± 0.02 s−1 (n = 12)] compared with control myofibrils [0.41 ± 0.07 s−1 (n = 29), P = 0.0088; Fig. 3F]. Additionally, the rate of force generation was more consistent among DA2A myofibrils with a narrow unimodal distribution ranging from 0.08 to 0.43 s−1 than among myofibrils from control muscle with a bimodal distribution ranging from 0.03 to 0.90 s−1 (Fig. 3A and B). The bimodal distribution of force generation rate measurements for control myofibrils is consistent with myofibrils sampled from both fast and slow twitch muscle cells (32,35,36), whereas the tight clustering of force generation rate measurements from DA2A suggest that the embryonic myosin R672C mutation could be limiting the rate of contractile activation in fast-twitch muscle fibers (i.e. making fast-twitch muscle cells behave more like slow twitch muscle cells).
Figure 3.
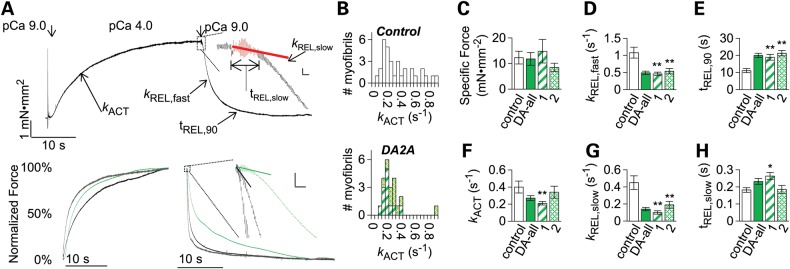
DA2A myofibrils exhibit significantly slowed kinetics. (A, top) Diagram of activation and relaxation kinetics on human adult traces. (A, top insert) First second of relaxation, with red data indicating the data which was analyzed for slow phase kinetics. The vertical bar indicates 0.1 mN mm−2 force; the horizontal bar indicates 100 ms. (A, bottom) Example normalized force traces of human adult control fast (gray), adult normal slow (black) and human adult DA2A (green) myofibrils. (A, bottom insert) DA2A slow phase of relaxation is significantly slower than heterogeneous control myofibrils. The vertical bar indicates 5% of force, and the horizontal bar indicates 100 ms. (B) Histograms of myofibril activation times. Shown are kACT (in s−1) rates for control (top, white) versus DA2A-1 (bottom, striped green) and DA2A-2 (bottom, hatched green) myofibrils. Bin size was chosen to be roughly the S.E.M. of both groups = 0.05 s−1 (C–H) Pronounced effect on DA2A myofibril kinetics and force generation. Shown are control (white), both DA2A patients together (solid green), DA2A-1 (striped green) and DA2A-2 (hatched green). (C) Maximum specific force produced was not significantly different between control and DA2A myofibrils. (D) The rate of total relaxation (kREL,fast) was significantly slower in both DA2A-1 and DA2A-2 myofibrils. (E) The time to 90% relaxation (tREL, 90) was drastically longer in both DA2A myofibril populations. (F) The rate of force production (kACT) was significantly slower in DA2A-1 myofibrils. (G) The rate of the slow phase of relaxation (kREL,slow) was significantly slower in both DA2A populations. (H) The duration of the slow phase of relaxation (tREL,slow)was significantly slower in DA2A-1.
Isolated myofibril preparations also allowed us to observe the biphasic nature of relaxation. Myofibril relaxation was characterized by an initial ‘slow’ phase (kREL,slow and tREL,slow; Fig. 3A, top inset), which constitutes <10% of the force loss in relaxation, and a secondary ‘fast’ phase (kREL,fast, tREL,90; Fig. 3A), which constitutes the majority of the force loss in relaxation. While a single exponential decay model described the fast phase of relaxation for control myofibrils, the fast phase of relaxation in DA2A myofibrils did not fit this model. To compare the fast phase of relaxation between control and DA2A myofibrils, we estimated the rate of the fast phase relaxation (kREL,fast) from the time to 50% relaxation (see Materials and Methods) and also measured the time to 90% relaxation. The fast phase relaxation rate was twice as slow for DA2A myofibrils [kREL,fast: 0.49 ± 0.05 s−1 (n = 26)] compared with control myofibrils [kREL,fast: 1.08 ± 0.18 s−1 (n = 29), P = 0.0028; Fig. 3D]. The time to 90% relaxation was also about twice as long for DA2A myofibrils compared with control myofibrils [tREL,90: DA2A 20.0 ± 1.2 s (n = 26) versus control myofibrils 11.4 ± 1.2 s (n = 27), P < 0.00001; Fig. 3E].
While the force loss during the initial, ‘slow’ phase of relaxation is small in comparison with the magnitude of force loss in the fast phase of relaxation, it provides information about the deactivation of myofibrils. The slope of this initial slow relaxation phase (kREL,slow) is thought to reflect the rate of cross-bridge detachment during relaxation (37–39), which is required for thin filament deactivation. The slow phase relaxation rate was >3-fold smaller in DA2A myofibrils [kREL,slow: 0.14 ± 0.02 s−1 (n = 24)] compared with controls [kREL,slow: control 0.47 ± 0.09 s−1 (n = 28), P = 0.0011; Fig. 3G]. The duration of the slow phase relaxation (tREL,slow) was also ∼50% longer for DA2A-1 [264 ± 20 ms (n = 14) versus control [181 ± 15 ms (n = 27), P = 0.0023; Fig. 3H]. Even so, the slow phase constituted significantly less of the total amplitude of relaxation in DA2A compared with control myofibrils [slow phase amplitude over total amplitude of relaxation: control 5.4 ± 0.7% (n = 26) versus DA2A-2 3.1 ± 0.7% (n = 10) (P = 0.028) and versus DA2A-1 2.4 ± 0.5% (n = 14) (P = 0.0018)]. Collectively, these results support the idea that a subpopulation of cross-bridges in DA2A myofibrils have a slower detachment rate that retards the slow phase specifically and relaxation overall.
R672C-containing muscle may have abnormally long-lasting cross-bridges
To study relaxation in more detail, we next subjected both muscle cells and myofibrils to a series of experiments to determine the effects of slower cross-bridge detachment by a subpopulation of long-lasting cross-bridges (presumably those with the R672C mutation). Following Ca2+ activation, relaxation in a pCa 9.0 solution appeared incomplete for individual DA2A muscle cells but not control muscle cells. Passive force for DA2A-1 muscle cells increased nearly 2-fold [3.8 ± 1.3 mN/mm2 versus 7.1 ± 2.6 mN/mm2 (n = 9), P = 0.011] after the first activation, a gain not seen in control muscle cells. We relaxed the DA2A-1 muscle cells in BDM to inhibit strong cross-bridge binding (Materials and Methods). Following the initial pCa 4.0 activation and pCa 9.0 relaxation, cells were activated a second time in pCa 4.0 and then relaxed in pCa 9.0 solution containing 30 mm BDM. Relaxation in the presence of BDM was more complete, with 32 ± 17% (n = 4) greater reduction in passive force compared with relaxation in pCa 9.0 without BDM, indicating cross-bridge inhibition could modulate the increase in passive force. As a further demonstration, for a subset of isolated myofibril preparations (DA2A-2, n = 12), after the initial activation (pCa 4.0) and relaxation (pCa 9.0), myofibrils were exposed to a second relaxation solution that contained 30 mm BDM, which further reduced force compared with the first relaxation solution without BDM (Fig. 4). Force rebounded when myofibrils were switched back to original relaxation solution without BDM, indicating the presence of long-lived cross-bridges that did not detach in the presence of BDM. There was no further reduction in force, indicating that these long-lived cross-bridges did not detach, when myofibrils were switched from pCa 9.0 to a second pCa 9.0 solution without BDM (Fig. 4, inset). These results support the hypothesis that after periods of muscle activity, a small set of ‘long-lived’ attached cross-bridges continue to exist at rest.
Figure 4.
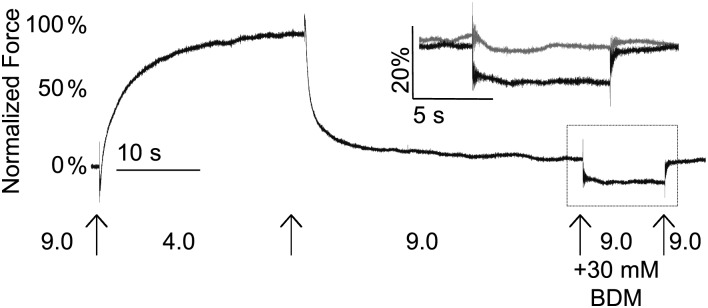
DA2A muscle shows prolonged cross-bridge attachment. Following a full relaxation, the amount of passive force in myofibrils was further reduced in BDM solution (black) compared with pCa 9.0 solution (gray, inset) in DA2A-2 myofibrils.
Histological analysis of muscle from persons with DA2A
It is plausible that the muscle cell structure is abnormal in DA2A, which could affect the contraction. However, H&E, NADH and modified Gomori trichrome staining showed relatively normal muscle architecture (data not shown). While rare small muscle cells with a slight increase in central nuclei suggested a trace amount of necrosis and regeneration, there was no other overt evidence of necrosis or inflammation.
An ATPase assay of histological sections, verified using an antibody specific for adult fast-twitch myosin heavy chains, showed a similar proportion of fiber types in DA2A muscles, (DA2A-1: type I 40% by ATPase, Type II 60% by ATPase or 61% by immunohistochemistry; DA2A-2: type I 56% by ATPase, Type II 44% by ATPase or 45% by immunohistochemistry; controls: 22, 57 and 83% fast/Type II by ATPase or immunohistochemistry) and a similar non-grouped mosaic arrangement pattern to that found in control muscle samples.
Discussion
We have demonstrated that skeletal muscles of individuals with DA2A caused by an R672C substitution in embryonic myosin show a markedly increased time to relaxation. This increased relaxation time and the elevation of passive tension following Ca2+ activation of contraction are novel observations among individuals with distal arthrogryposis, and congenital contractures in general, and suggest that the rate of turnover of cross-bridges can be slowed by a small population of mutant myosins. The exact mechanism underlying diminished cross-bridge turnover remains to be determined.
The R672 residue is located near the groove between the two 50 kDa domains in the embryonic myosin head that forms the ATP-binding site. Accordingly, the arginine to cysteine substitution could perturb nucleotide transition in and out of the binding pocket (14). The difference in magnitude and distribution of activation rates between DA2A myofibrils and control myofibrils highlight a role mutant embryonic myosin may play in the activation of the muscle. The mutant myosin, with a drastically slower cross-bridge release rate, could add a drag to sarcomere shortening by remaining attached to actin and preventing filament sliding (40,41). The changes in slow phase relaxation kinetics in DA2A myofibrils provide evidence for a significantly slower cross-bridge release rate (kREL,slow) (36) and a potential secondary affect. The slow phase relaxation duration (tREL,slow), which is related to the time that thin filaments remain ‘on’ allowing cross-bridge cycling to continue (36), was also significantly longer in DA2A-1 myofibrils. The longer duration and diminished slope of the slow phase of relaxation in DA2A myofibrils could be explained by the mutant myosin remaining bound to actin and preventing tropomyosin from moving back to an inhibitory position on F-actin following the release of Ca2+ from troponin. Taken together, these results suggest that there may be substantial differences in kinetics of myosin cross-bridge chemo-mechanical cycling that affect thin filament state transitions (42) of DA2A myofibrils. Alternatively, a higher percentage of embryonic myosin present in skeletal muscle of DA2A myofibrils could also explain slower cross-bridge turnover, as embryonic myosin is slower (31,32) and the presence of a small amount of slow myosin can substantially change the kinetics of the muscle as a whole (40,41). However, our results suggest that there are at most minor differences in the amount of embryonic myosin present between the DA2A and control samples, with the DA2A samples potentially carrying less embryonic myosin than controls.
Whether delayed and incomplete relaxation is a general mechanism underlying the development of congenital contractures in individuals with this and other mutations in MYH3 is unclear. To date, no other studies of muscle cell contractility in individuals with defects of embryonic myosin have been reported. The effects on muscle cell contractility of mutations in several other genes that underlie distal arthrogryposis disorders, including troponin T (TNNT3) (23), troponin I (TNNI2) (23), tropomyosin (TPM2) (23,24,43) and myosin-binding protein C (MYBPC1) (25), have been investigated. These studies suggest a common feature of congenital contractures may be dysregulation of thin filament regulation, either through direct changes in regulatory protein function or indirect effects on the ability to regulate through dysfunction of myosin or myosin-binding protein C. In some cases, such as herein, this may also result in elevated resting tension, especially following periods of muscle activity.
The presence of an abnormal contractile protein during fetal development can leave a long-lasting change in adult muscle cells (44), either through structural changes in the sarcomere or abnormal stoichiometry in the remaining thick or thin filament proteins. However, the physical presence of the embryonic myosin in the muscle cells studied leads us to hypothesize that the presence of mutant embryonic myosin, even at much lower quantitative levels than other myosins, can create a dominant negative effect on the contractile properties of the adult muscle cells.
Whether our findings can be generalized to other DA2A mutations in MYH3, or to DA-causing mutations in other genes that encode contractile components of skeletal muscle, is unclear. Indeed, there is some evidence that such mutations can cause congenital contractures by several different mechanisms. An in vitro study of demembranated rabbit muscle cells containing recombinant mutant troponin and tropomyosin molecules showed increased Ca2+ sensitivity and force generation (23). This increase in force and Ca2+ sensitivity suggests that DA syndromes are, in some cases, caused by increased muscle cell contractility (23). On the other hand, ex vivo contractility studies using demembranated human muscle cells with mutant tropomyosin showed diminished maximal force production with no change in Ca2+ sensitivity of force (24,43). Whether these dissimilar results are the result of differences in experimental approach, the particular protein containing the mutation and/or real differences in the mechanisms that cause contractures remains unknown.
Interventions based on specific muscle contractile deficits can show improved outcomes in muscle abnormalities that arise from both genetic mutations and muscle damage (45,46). To date, we have studied genetic therapies that alter Ca2+ sensitivity and cross-bridge cycling (47–49). While others have observed increases in contractility and changes to Ca2+ sensitivity in DA (23,24), in this study we have demonstrated a deficit of the contractile apparatus, in the cross-bridge cycle and detachment, which highlights a potential targeted therapeutic strategy moving forward. 2-Deoxy-ATP has been shown to improve cross-bridge detachment and increase the rate of cross-bridge cycling in muscle (50–52) and would be an excellent candidate in future studies to develop a therapeutic for patients who show this specific contractile deficit.
Studies of contractile function in human tissues sampled from persons with rare conditions are frequently constrained by the availability of samples. Samples acquired in this study were also stored at −80°C prior to beginning experiments, which may affect the sample quality. The small sample number and cold storage was a limitation of our studies. Yet, samples from the two unrelated individuals with DA2A studied herein demonstrated similar departures from the contractility parameters of control muscle.
This is the first study to compare the contraction and relaxation properties of muscle cells and myofibrils from individuals with an MYH3 mutation that causes congenital contractures. The combination of single cell and myofibril preparations has allowed us to examine muscular dysfunction ex vivo at cellular and subcellular levels. In muscle from two individuals with DA2A, we demonstrated abnormal contractile kinetics including remarkably prolonged relaxation. Such drastic changes in relaxation kinetics have not been observed previously (23,24,43). Furthermore, we find that cross-bridge detachment rate is reduced and could explain both the observed elevation in passive force and the prolonged relaxation. Our experiments highlight the importance of studying not only the force production, but the kinetics of force production and relaxation to fully ascertain the cause(s) of mechanical dysfunction and to distinguish with greater precision potential therapeutic options.
Materials and Methods
Clinical features of participants and controls
We obtained skeletal muscle cells from the gastrocnemius muscle of four unrelated control persons without congenital contractures and two unrelated persons who met the diagnostic criteria for DA, specifically DA2A (11,53,54). Blood was also obtained from the individuals with DA2A and their family members for DNA sequencing. Two unrelated individuals with DA2A, who carried the same mutation (R672C in embryonic myosin), were studied here. These studies were approved by the Institutional Review Boards of the University of Washington and of the Seattle Children's Research Institute.
DA2A-1 is a 16-year-old male whose clinical characteristics included flexion contractures of the fingers (camptodactyly), ulnar deviation of the wrists, limited supination of both forearms, contractures of the ankles, ptosis and a small mouth with pursed lips, and characteristic H-shaped dimpling of the chin. His mother was similarly affected with DA2A except that she lacked lower limb contractures and had scoliosis.
DA2A-2 is a 28-year-old female with camptodactyly, ulnar deviation of the fingers, hypoplastic flexion creases of her fingers and palms, and adducted thumbs. Her face showed a small mouth with the characteristic central lower lip depression, deep nasolabial folds and an H-shaped dimple of the chin. She did not have lower limb contractures, but other affected persons in her family had bilateral clubfeet.
The healthy control individuals included a 20-year-old female, a 39-year-old female and a 42-year-old female. An additional control sample was from an anonymous individual who was determined to have normal muscle histology.
MYH3 sequencing
Peripheral blood was collected from persons with DA2A and their family members after informed consent was obtained. DNA was extracted from the whole blood using the Gentra PureGene kit (Qiagen Inc., Valencia, CA, USA). Primers for MYH3 have been described previously (14,21). Each coding exon and exon–intron boundary was amplified with Taq polymerase (Life Technologies Corp., Carlsbad, CA, USA) and standard protocols. Amplicons were cleaned using exonuclease I (New England Biolabs, Ipswich, MA, USA) and shrimp alkaline phosphatase (USB Corp., Cleveland, OH, USA). Cleaned amplicons were Sanger sequenced using BigDye Terminator v3.1 (Applied Biosystems, Inc.). Sequencing fragments were purified on a Sephadex G-50 (Sigma-Aldrich, St. Louis, MO, USA) column in a 96-well format using dye terminator removal plates (EMD Millipore, Billerica, MA, USA). Purified fragments were run on an automated sequencer (ABI 3130xl, Life Technologies Corp.). Electropherograms of both forward and reverse strands were manually reviewed with CodonCode Aligner version 3.5.6 (CodonCode Corp., Dedham, MA, USA).
Muscle biopsies
Fresh human skeletal muscle biopsies were obtained from two individuals diagnosed with DA2A and with confirmed R672C MYH3 mutations and three individuals without congenital contractures after informed consent was obtained. An additional normal control flash-frozen biopsy was obtained through the University of Washington Department of Pathology. Two approaches were used to obtain skeletal muscle. The gastrocnemius muscle from DA2A-1 was sampled while he was under general anesthesia via an open biopsy. For DA2A-2 and controls, the gastrocnemius muscle was sampled via percutaneous needle biopsy using a 5-mm Bergstrom biopsy needle under suction. For both, muscle tissue was immediately snap-frozen in liquid nitrogen, moved on dry ice and stored at −80°C. DA2A and control muscle samples were obtained between 2008 and 2009. Muscle cell studies were performed between 2008 and 2009; myofibril studies were performed between 2013 and 2014.
Embryonic myosin expression and incorporation
To determine whether MYH3 mRNA was expressed in control adult human skeletal muscle, total RNA from control fetal and adult human skeletal muscle (Stratagene, La Jolla, CA, USA) was reverse transcribed to cDNA using an oligo(dT)20 primer (Invitrogen Superscript III First-strand Synthesis Supermix kit, Carlsbad, CA, USA), and MYH3 and MYH2 (as a control) were amplified using intron-spanning human primers that were designed to generate unique amplicons that were size-specific for either cDNA or genomic DNA. The sequences of these primers were:
MYH3_RT_exon 38_F (5′-GATTGCAGGATCTGGTGGAT-3′),
MYH3_RT_exon 39_R (5′-CCTGCTGGAGGTGAAGTCTC-3′),
MYH2_RT_exon 36_F (5′-GAGCTGGAAGGAGAGGTTGA-3′) and
MYH2_RT_exon 37_R (5′-CCAAATCTTGAAGCCTGAGAA-3′).
Sequences from all bands of the expected sizes were used to confirm the specificity of the primers.
To determine whether embryonic myosin is expressed in control adult human skeletal muscle, individual control muscle cells were boiled in standard 1× SDS–PAGE sample buffer and ¼ of the sample was loaded per lane on a 12.5% SDS–PAGE gel. After running the gel for ∼2 h, protein extracts were transferred to a nitrocellulose membrane for immunoblotting using a mouse anti-embryonic myosin heavy chain antibody. Bands were visualized using the Amersham Hybond ECL kit (GE Healthcare Lifesciences, Little Chalfont, UK). Mixed human fetal skeletal muscle cells were prepared from a 163-day of gestation fetal gastrocnemius muscle snap-frozen in liquid nitrogen immediately after dissection, and stored at −80°C. Then, this muscle was digested in 1 mg/5 µl lysis buffer (25 mm Tris–HCl, pH 7.5, 150 mm NaCl, 5 mm EDTA, 1% Triton, 5 mm benzamidine, 1 mm PMSF, 1% β-mercaptoethanol) plus a 1 : 200 dilution of ‘Protease Inhibitor Cocktail’ (Sigma-Aldrich). Following homogenization for ∼15 s with a TissueRuptor homogenizer, the sample was sonicated for 10 min. An equal volume of 2× standard SDS–PAGE sample buffer was added, and the sample was again sonicated for 2 min prior to being boiled for 2 min.
A second quantitative assessment was performed on small bundles of the remaining samples. Approximately 1 mg pieces of tissue were placed in ∼4× volume (20 µl) extraction buffer (in molar: 0.3 NaCl, 0.1 NaH2PO4, 0.05 Na2HPO4, 0.01 sodium pyrophosphate, 0.001 MgCl2 and 0.002 DTT, adjusted to pH 6.5) on ice, then diluted in 9× volume (180 µl) of a 50% glycerol solution containing 40 mm sodium pyrophosphate (adjusted to pH 8.5) (55). A Bradford assay was used to determine protein concentration. A 12.5% SDS–PAGE gel was run with equal amounts of protein from the five samples. After running the gel for ∼2 h, protein extracts were transferred to a polyvinylidene difluoride membrane for immunoblotting. Bands were visualized using the SuperSignal West Dura kit (Thermo Fisher Scientific, Waltham, MS, USA). This was initially probed for embryonic myosin heavy chain, then stripped (Restore Western blot stripping buffer, Thermo Scientific) and probed for anti-α-actin (A2103, Sigma-Aldrich). Densities of bands were analyzed using ImageJ (National Institutes of Health).
The hybridoma used to generate the embryonic myosin heavy chain antibody used in the Western experiments (F1.652) was obtained from the Developmental Studies Hybridoma Bank at the University of Iowa (http://dshb.biology.uiowa.edu/). The hybridoma line was cultured in Iscove's modified Dulbecco's medium (IDEM) with 10% fetal calf serum and gentamicin. Purified myosin from a 15-week human fetus was previously used as the antigen to generate this antibody (28).
Muscle cell contractility studies
For each experiment, a small piece of the frozen tissue was thawed in a demembranating (skinning) solution consisting of a 50% glycerol–relaxing (v/v) solution with 1% Triton detergent and 1 : 200 (v/v) ‘Protease Inhibitor Cocktail’ (Sigma-Aldrich, P8340) and incubated at 4°C for 2–4 h. The solution was then changed to a 50% glycerol–relaxing solution (without detergent) and ‘Protease Inhibitor Cocktail,’ the sample was stored at 4°C overnight and transferred to −20°C storage for the duration of the experiments.
Individual skinned muscle cell segments were dissected from thawed muscle bundles and ends were wrapped in aluminum foil T-clips. Preparations were mounted on a Nikon (Japan) inverted microscope with Minutien pin hooks attached to an Aurora Scientific force transducer (model 400A, ON, Canada) and a General Scanning servo-motor (model G120DT, Watertown, MA, USA) in a temperature-controlled solution well, as described previously (56). Muscle cell segment length was set to just-above-slack plus 10% and monitored during activation and relaxation. Sarcomere length at just-above-slack plus 10% was measured in a subset of DA muscle cells using video microscopy (IonOptix), which confirmed that this stretch created an average sarcomere length of 2.4 µm per sarcomere in the muscle segments, which is within the plateau range (∼2.3–2.8 µm) for maximal force reported for the human sarcomere length–force relationship (57). Muscle cell preparations were moved between different calcium-containing solutions held in individual troughs for mechanical measurements. At 5 s intervals, muscle cell segments were shortened by 15%, then rapidly restretched to the initial muscle cell segment length to maintain fiber integrity (58).
Experimental relaxing and activating solutions contained a final concentration of (in mm) 1 EGTA, 1 MOPS, 1 free Mg2+, 135 (Na+ + K+), 5 ATP and 1 DTT and 4% (w/v) Dextran T-500 (Pharmacia). The pH was adjusted to 7.0 at 15°C; the ionic strength was 0.17 m. The concentrations of free calcium were 10−9 m (relaxing solution) and 10−6.4, 10−6.2, 10−6.1, 10−6.0, 10−5.9, 10−5.8, 10−5.7, 10−5.6, 10−5.4, 10−5.2, 10−5.0 and 10−4.0 m (activating solutions), expressed as pCa values (i.e. −log [Ca2+]). For some experiments, 30 mm 2,3-butanedione monoxime (BDM, Sigma-Aldrich) was added to pCa 9.0 solutions to inhibit strong cross-bridge binding (59).
Force and shortening measurements for individual demembranated muscle cells were collected and analyzed as previously described using custom software (51) and on a Gould 2400 chart recorder for long-timescale measures of relaxation. Ca2+ concentrations were varied to determine the maximal absolute force per muscle cell, the Ca2+ sensitivity of force and the degree of cooperativity in Ca2+ activation of force. Maximum absolute force per muscle cell was determined by subtracting the initial passive force (at pCa 9.0) to activation from total force measured during the activation. Maximum specific force was determined by normalization of the maximum absolute force per muscle cell to muscle cell cross-sectional area, calculated from measures of cell diameter. Cross-sectional area was determined by averaging three diameter measurements across each muscle cell length set at ‘just-above-slack’ plus 10% (at ∼25, 50 and 75% of the muscle cell length) and using πr2, assuming circular cross-sectional area. Dextran T-500 was included in all solutions to maintain myofilament lattice spacing (and fiber diameter) at values close to intact muscle cells (60,61).
Force measurements were plotted using Sigma Plot, and steady-state force –pCa relationships were fitted with the Hill equation, , to obtain pCa at half-maximal force (pCa50, defined as calcium sensitivity) and the slope of the linear portion of the curve (the Hill coefficient nH) which represents the apparent cooperativity of contractile activation).
Myofibril contractility studies
Small pieces of flash-frozen muscle from both individuals with DA2A and three controls were thawed and demembranated for 12 h at 4°C in a solution containing 50% glycerol (by volume), 1% Triton detergent, 1 : 200 volume dilution ‘Protease Inhibitor Cocktail’ (Sigma-Aldrich, P8340), and a muscle relaxing solution, as previously described (52,62). Muscle bundles were manually dissected into pieces <500 µm long and wide at ×10 magnification, placed into rigor solution and shredded with a high-speed homogenizer for 1 or 2 bursts of 15 s. Myofibrils were stored at 4°C and used within 3 days.
Myofibril experiments were performed as previously described (63,64). Briefly, single or small bundles of myofibrils were mounted between two needles micro-forged from borosilicate glass capillary tubes (OD 1.0 mm, ID 0.5 mm, Sutter Instruments, Novato, CA, USA). One of these needles acted as a force transducer which deflected in a predictable manner upon application of force (63). Needle stiffness was determined by first deflecting the needle with a known amount of force using a galvanometer and measuring its deflection under a ×40 lens. This yielded stiffness in nN µm−1, and needles used for these experiments ranged between 6 and 25 nN µm−1. This needle was positioned over a dual diode system, which records needle displacement and correlates displacement to force development. A calibration curve was performed at the end of each experiment in which this needle was moved over the range of the diodes using micromanipulators (MP-285, Sutter Instruments). A second, straight needle was attached to the other end of the myofibril.
A double-barreled borosilicate theta glass pipette (capillary glass tubing OD 2.0 mm, ID 1.4 mm, SEP 0.2 mm, modified in house to outer diameter of 0.55 mm, Warner Instruments Corporation, Hamden, CT, USA) was used to stream low (10−9 m, pCa 9.0) and high (10−4 m, pCa 4.0) Ca2+ containing solutions over the mounted preparation, and the solution switch was controlled by a computerized motor (SF-77B Perfusion Fast step, Warner Instruments Corporation). The solution change was complete in ∼10 ms (65,66).
Experimental solutions for myofibril mechanics were calculated as previously described (67) and contained (mm): 10 phosphocreatine, 10 EGTA (ratio of CaEGTA/EGTA set to obtain Ca2+ values of 10−9 and 10−4 m), 10 MOPS, 1 free Mg2+, 155 (Na++K+), 5 MgATP, and propionate and sulfate to adjust the final solution ionic strength to 0.2 m.
Sarcomere length at just-above-slack plus 15% was measured in a subset of myofibrils, which confirmed that this stretch created an average sarcomere length of 2.4 µm per sarcomere in the myofibrils. Activation and relaxation data were collected at 15°C and fit as previously described (64). Maximum specific force in myofibrils was determined by the magnitude in force gained upon switching from the relaxing to activating solution. Briefly, the activation rate (with rapid increase in Ca2+) was estimated from the time to 50% full activation, tACT,50, as fibril activation rates were not well described by a single exponential. Similarly, the total relaxation rate was measured with two values, tREL,50 at 50% full relaxation and tREL,90 at 90% full relaxation, as fibril relaxation rates were not well described by a single exponential. Initial analysis result times (t50) were converted to rates (k) by (ln(2)/t50 = k) (31). Relaxation rate for the early, slow phase (kREL,slow) was taken as the slope of a regression line fit to the tension trace and normalized to the tension amplitude. The duration of slow phase was measured from the onset of solution change at the myofibril to the shoulder marking the beginning of fast phase. Transition from slow to rapid phase was determined through multiple factors. An apparent change in the slope of the data or a change in the signal-to-noise ratio was often apparent at the transition (Fig. 3A, inset). Myofibrils which contracted >10.5% of their optimal length were excluded from the analysis as non-isometric.
Muscle biopsy histology and immunohistochemistry
The adult skeletal muscle samples were frozen directly in liquid nitrogen, and stored at −80°C until use. The anonymous biopsy sample was first frozen to a base of −80°C mounting medium [optimal cutting temperature compound (OCT), Sakura Finetek, Torrance, CA, USA] with a rapidly freezing aerosol (Cytocool II, Richard-Allan Scientific, Kalamazoo, MI, USA). This tissue block on OCT was then frozen in liquid isopentane (Sigma-Aldrich) cooled to −80°C in liquid nitrogen and stored at −80°C until use. All frozen samples were cut in cross-section (across muscle cells) into 5 μm sections. Histological analysis was performed using H&E, NADH and modified Gomori trichrome stains using standard techniques. To perform an ATPase assay, adjacent slices of the cross-section cut sample were incubated in either low pH (acidic, 4.3) or high pH (alkaline, 10.3), due to the pH-dependence of the ATPase in different fiber types (Type I—acid ATPase; Type II—alkaline ATPase), to darken Type I or Type II predominant cells, as previously described (68). Immunohistochemistry using a monoclonal anti-fast skeletal myosin antibody (M4276, Sigma-Aldrich) confirmed the ATPase results. Photos were taken with an Olympus BX41 microscope (Olympus, Center Valley, PA, USA) ×40 objective and a Leica DFC290 digital camera (Leica, Allendale, NJ, USA).
Statistical analysis
A Student's two-tailed unpaired t-test was used to determine if differences between control and mutant measurements were significant with statistical significance set at P < 0.05 (95% confidence). Plots show averages of each point ± standard errors of the mean (S.E.M.). Values reported in the text are listed as mean ± S.E.M. (n = number of myofibrils or muscle cells). All values are reported as unweighted means ± S.E.M.
Authors’ Contributions
A.W.R. designed and performed experiments, analyzed data and wrote the text of this paper. A.E.B. recruited participants, designed and performed experiments and contributed to the text of this paper. M.J.M. recruited participants. F.S.K. performed experiments. M.R. designed the experiments and contributed to the text of this paper. M.J.B. designed the experiments, recruited participants and contributed to the text of this paper.
Funding
This work was supported by the following National Institutes of Health: Arthritis and Musculoskeletal and Skin Diseases (F31AR063000 to A.W.R.), Child Health and Human Development (HD057331 to A.E.B.; HD048895 to M.J.B. and M.R.) and the National Heart Lung and Blood Institute (HL111197 to M.R.). The content is solely the responsibility of the authors and does not necessarily represent the official views of the National Institutes of Health.
Acknowledgements
We thank the study subjects for their participation. The embryonic myosin antibody developed by Blau, H.M. was obtained from the Developmental Studies Hybridoma Bank developed under the auspices of the NICHD and maintained by The University of Iowa, Department of Biology. Fetal muscle samples for this project were provided by the project entitled ‘Laboratory of Developmental Biology’; The project entitled ‘Laboratory of Developmental Biology’ was supported by NIH Award Number 5R24HD0008836 from the Eunice Kennedy Shriver National Institute of Child Health & Human Development. We thank D. Born, J. Dai, G. Flint and Z. Luo for providing reagents; M. McMillin, D. Shaw, B. Tanner and Z. Luo for technical assistance; and M. Razumova and K. Kreutziger for valuable discussion.
Conflict of Interest statement. None declared.
References
- 1.Yang H.Y., Chung C.S., Nemechek R.W. (1987) A genetic analysis of clubfoot in Hawaii. Genet. Epidemiol., 4, 299–306. [DOI] [PubMed] [Google Scholar]
- 2.Wang J.H., Palmer R.M., Chung C.S. (1988) The role of major gene in clubfoot. Am. J. Hum. Genet., 42, 772–776. [PMC free article] [PubMed] [Google Scholar]
- 3.Hall J. (1992) Arthrogryposis. In Principles and Practice of Medical Genetics. Churchill Livingstone, Edinburgh, pp. 989–1035. [Google Scholar]
- 4.Rebbeck T.R., Dietz F.R., Murray J.C., Buetow K.H. (1993) A single-gene explanation for the probability of having idiopathic talipes equinovarus. Am. J. Hum. Genet., 53, 1051–1063. [PMC free article] [PubMed] [Google Scholar]
- 5.De Andrade M., Barnholtz J.S., Amos C.I., Lochmiller C., Scott A., Risman M., Hecht J.T. (1998) Segregation analysis of idiopathic talipes equinovarus in a Texan population. Am. J. Med. Genet., 79, 97–102. [DOI] [PubMed] [Google Scholar]
- 6.Lochmiller C., Johnston D., Scott A., Risman M., Hecht J.T. (1998) Genetic epidemiology study of idiopathic talipes equinovarus. Am. J. Med. Genet., 79, 90–96. [PubMed] [Google Scholar]
- 7.Chapman C., Stott N.S., Port R.V., Nicol R.O. (2000) Genetics of club foot in Maori and Pacific people. J. Med. Genet., 37, 680–683. [DOI] [PMC free article] [PubMed] [Google Scholar]
- 8.Honein M.A., Paulozzi L.J., Moore C.A. (2000) Family history, maternal smoking, and clubfoot: an indication of a gene-environment interaction. Am. J. Epidemiol., 152, 658–665. [DOI] [PubMed] [Google Scholar]
- 9.Dietz F. (2002) The genetics of idiopathic clubfoot. Clin. Orthop. Relat. Res., 39–48. [DOI] [PubMed] [Google Scholar]
- 10.Bale J.R., Stoll B.J., Lucas A.O., Committee on Improving Birth Outcomes (eds) (2003) Reducing Birth Defects: Meeting the Challenge in the Developing World. The National Academies Press, Washington, DC. [PubMed] [Google Scholar]
- 11.Bamshad M., Jorde L.B., Carey J.C. (1996) A revised and extended classification of the distal arthrogryposes. Am. J. Med. Genet., 65, 277–281. [DOI] [PubMed] [Google Scholar]
- 12.Sung S.S., Brassington A.-M.E., Grannatt K., Rutherford A., Whitby F.G., Krakowiak P.A., Jorde L.B., Carey J.C., Bamshad M. (2003) Mutations in genes encoding fast-twitch contractile proteins cause distal arthrogryposis syndromes. Am. J. Hum. Genet., 72, 681–690. [DOI] [PMC free article] [PubMed] [Google Scholar]
- 13.Sung S.S., Brassington A.-M.E., Krakowiak P.A., Carey J.C., Jorde L.B., Bamshad M. (2003) Mutations in TNNT3 cause multiple congenital contractures: a second locus for distal arthrogryposis type 2B. Am. J. Hum. Genet., 73, 212–214. [DOI] [PMC free article] [PubMed] [Google Scholar]
- 14.Toydemir R.M., Rutherford A., Whitby F.G., Jorde L.B., Carey J.C., Bamshad M.J. (2006) Mutations in embryonic myosin heavy chain (MYH3) cause Freeman-Sheldon syndrome and Sheldon-Hall syndrome. Nat. Genet., 38, 561–565. [DOI] [PubMed] [Google Scholar]
- 15.Toydemir R.M., Chen H., Proud V.K., Martin R., van Bokhoven H., Hamel B.C.J., Tuerlings J.H., Stratakis C.A., Jorde L.B., Bamshad M.J. (2006) Trismus-pseudocamptodactyly syndrome is caused by recurrent mutation of MYH8. Am. J. Med. Genet., 140, 2387–2393. [DOI] [PubMed] [Google Scholar]
- 16.Shrimpton A.E., Hoo J.J. (2006) A TNNI2 mutation in a family with distal arthrogryposis type 2B. Eur. J. Med. Genet., 49, 201–206. [DOI] [PubMed] [Google Scholar]
- 17.Jiang M., Zhao X., Han W., Bian C., Li X., Wang G., Ao Y., Li Y., Yi D., Zhe Y., et al. (2006) A novel deletion in TNNI2 causes distal arthrogryposis in a large Chinese family with marked variability of expression. Hum. Genet., 120, 238–242. [DOI] [PubMed] [Google Scholar]
- 18.Kimber E., Tajsharghi H., Kroksmark A.-K., Oldfors A., Tulinius M. (2006) A mutation in the fast skeletal muscle troponin I gene causes myopathy and distal arthrogryposis. Neurology, 67, 597–601. [DOI] [PubMed] [Google Scholar]
- 19.Tajsharghi H., Kimber E., Kroksmark A.-K., Jerre R., Tulinius M., Oldfors A. (2008) Embryonic myosin heavy-chain mutations cause distal arthrogryposis and developmental myosin myopathy that persists postnatally. Arch. Neurol., 65, 1083–1090. [DOI] [PubMed] [Google Scholar]
- 20.Tajsharghi H., Kimber E., Holmgren D., Tulinius M., Oldfors A. (2007) Distal arthrogryposis and muscle weakness associated with a beta-tropomyosin mutation. Neurology, 68, 772–775. [DOI] [PubMed] [Google Scholar]
- 21.Veugelers M., Bressan M., McDermott D.A., Weremowicz S., Morton C.C., Mabry C.C., Lefaivre J.-F., Zunamon A., Destree A., Chaudron J.-M., et al. (2004) Mutation of perinatal myosin heavy chain associated with a Carney complex variant. N. Engl. J. Med., 351, 460–469. [DOI] [PubMed] [Google Scholar]
- 22.Gurnett C.A., Desruisseau D.M., McCall K., Choi R., Meyer Z.I., Talerico M., Miller S.E., Ju J.-S., Pestronk A., Connolly A.M., et al. (2010) Myosin binding protein C1: a novel gene for autosomal dominant distal arthrogryposis type 1. Hum. Mol. Genet., 19, 1165–1173. [DOI] [PMC free article] [PubMed] [Google Scholar]
- 23.Robinson P., Lipscomb S., Preston L.C., Altin E., Watkins H., Ashley C.C., Redwood C.S. (2007) Mutations in fast skeletal troponin I, troponin T, and beta-tropomyosin that cause distal arthrogryposis all increase contractile function. FASEB J. Off. Publ. Fed. Am. Soc. Exp. Biol., 21, 896–905. [DOI] [PubMed] [Google Scholar]
- 24.Ochala J., Li M., Tajsharghi H., Kimber E., Tulinius M., Oldfors A., Larsson L. (2007) Effects of a R133W beta-tropomyosin mutation on regulation of muscle contraction in single human muscle fibres. J. Physiol., 581, 1283–1292. [DOI] [PMC free article] [PubMed] [Google Scholar]
- 25.Ackermann M.A., Patel P.D., Valenti J., Takagi Y., Homsher E., Sellers J.R., Kontrogianni-Konstantopoulos A. (2013) Loss of actomyosin regulation in distal arthrogryposis myopathy due to mutant myosin binding protein-C slow. FASEB J., 27, 3217–3228. [DOI] [PMC free article] [PubMed] [Google Scholar]
- 26.Beck A.E., McMillin M.J., Gildersleeve H., Kezele P., Shively J., Carey J.C., Regnier M., Bamshad M.J. (2013) Spectrum of mutations that cause distal arthrogryposis types 1 and 2B. Am. J. Med. Genet., 161A, 550–555. [DOI] [PMC free article] [PubMed] [Google Scholar]
- 27.Ochala J. (2008) Thin filament proteins mutations associated with skeletal myopathies: defective regulation of muscle contraction. J. Mol. Med., 86, 1197–1204. [DOI] [PubMed] [Google Scholar]
- 28.Silberstein L., Webster S.G., Travis M., Blau H.M. (1986) Developmental progression of myosin gene expression in cultured muscle cells. Cell, 46, 1075–1081. [DOI] [PubMed] [Google Scholar]
- 29.Webster C., Silberstein L., Hays A.P., Blau H.M. (1988) Fast muscle fibers are preferentially affected in Duchenne muscular dystrophy. Cell, 52, 503–513. [DOI] [PubMed] [Google Scholar]
- 30.Gambke B., Rubinstein N.A. (1984) A monoclonal antibody to the embryonic myosin heavy chain of rat skeletal muscle. J. Biol. Chem., 259, 12092–12100. [PubMed] [Google Scholar]
- 31.Racca A.W., Beck A.E., Rao V.S., Flint G.V., Lundy S.D., Born D.E., Bamshad M.J., Regnier M. (2013) Contractility and kinetics of human fetal and human adult skeletal muscle. J. Physiol., 591, 3049–3061. [DOI] [PMC free article] [PubMed] [Google Scholar]
- 32.Resnicow D.I., Deacon J.C., Warrick H.M., Spudich J.A., Leinwand L.A. (2010) Functional diversity among a family of human skeletal muscle myosin motors. Proc. Natl. Acad. Sci. USA, 107, 1053–1058. [DOI] [PMC free article] [PubMed] [Google Scholar]
- 33.Brenner B., Yu L.C. (1991) Characterization of radial force and radial stiffness in Ca(2+)-activated skinned fibres of the rabbit psoas muscle. J. Physiol., 441, 703–718. [DOI] [PMC free article] [PubMed] [Google Scholar]
- 34.Williams C.D., Regnier M., Daniel T.L. (2010) Axial and radial forces of cross-bridges depend on lattice spacing. PLoS Comput. Biol., 6, e1001018. [DOI] [PMC free article] [PubMed] [Google Scholar]
- 35.West J.M., Barclay C.J., Luff A.R., Walker D.W. (1999) Developmental changes in the activation properties and ultrastructure of fast- and slow-twitch muscles from fetal sheep. J. Muscle Res. Cell Motil., 20, 249–264. [DOI] [PubMed] [Google Scholar]
- 36.Tesi C., Piroddi N., Colomo F., Poggesi C. (2002) Relaxation kinetics following sudden Ca(2+) reduction in single myofibrils from skeletal muscle. Biophys. J., 83, 2142–2151. [DOI] [PMC free article] [PubMed] [Google Scholar]
- 37.Stehle R., Krüger M., Pfitzer G. (2002) Force kinetics and individual sarcomere dynamics in cardiac myofibrils after rapid ca(2+) changes. Biophys. J., 83, 2152–2161. [DOI] [PMC free article] [PubMed] [Google Scholar]
- 38.Poggesi C., Tesi C., Stehle R. (2005) Sarcomeric determinants of striated muscle relaxation kinetics. Pflüg. Arch. Eur. J. Physiol., 449, 505–517. [DOI] [PubMed] [Google Scholar]
- 39.Morgan D.L., Proske U. (2006) Sarcomere popping requires stretch over a range where total tension decreases with length. J. Physiol., 574, 627–628. [DOI] [PMC free article] [PubMed] [Google Scholar]
- 40.Cuda G., Pate E., Cooke R., Sellers J.R. (1997) In vitro actin filament sliding velocities produced by mixtures of different types of myosin. Biophys. J., 72, 1767–1779. [DOI] [PMC free article] [PubMed] [Google Scholar]
- 41.Herron T.J., Korte F.S., McDonald K.S. (2001) Loaded shortening and power output in cardiac myocytes are dependent on myosin heavy chain isoform expression. Am. J. Physiol. Heart Circ. Physiol., 281, H1217–H1222. [DOI] [PubMed] [Google Scholar]
- 42.Kreutziger K.L., Piroddi N., McMichael J.T., Tesi C., Poggesi C., Regnier M. (2011) Calcium binding kinetics of troponin C strongly modulate cooperative activation and tension kinetics in cardiac muscle. J. Mol. Cell. Cardiol., 50, 165–174. [DOI] [PMC free article] [PubMed] [Google Scholar]
- 43.Ochala J., Li M., Ohlsson M., Oldfors A., Larsson L. (2008) Defective regulation of contractile function in muscle fibres carrying an E41K beta-tropomyosin mutation. J. Physiol., 586, 2993–3004. [DOI] [PMC free article] [PubMed] [Google Scholar]
- 44.Fyrberg E., Fyrberg C.C., Beall C., Saville D.L. (1990) Drosophila melanogaster troponin-T mutations engender three distinct syndromes of myofibrillar abnormalities. J. Mol. Biol., 216, 657–675. [DOI] [PubMed] [Google Scholar]
- 45.Moreno-Gonzalez A., Korte F.S., Dai J., Chen K., Ho B., Reinecke H., Murry C.E., Regnier M. (2009) Cell therapy enhances function of remote non-infarcted myocardium. J. Mol. Cell. Cardiol., 47, 603–613. [DOI] [PMC free article] [PubMed] [Google Scholar]
- 46.Regnier M., Rivera A.J., Chase P.B., Smillie L.B., Sorenson M.M. (1999) Regulation of skeletal muscle tension redevelopment by troponin C constructs with different Ca2+ affinities. Biophys. J., 76, 2664–2672. [DOI] [PMC free article] [PubMed] [Google Scholar]
- 47.Feest E.R., Steven Korte F., Tu A.-Y., Dai J., Razumova M.V., Murry C.E., Regnier M. (2014) Thin filament incorporation of an engineered cardiac troponin C variant (L48Q) enhances contractility in intact cardiomyocytes from healthy and infarcted hearts. J. Mol. Cell. Cardiol., 72, 219–227. [DOI] [PMC free article] [PubMed] [Google Scholar]
- 48.Korte F.S., Dai J., Buckley K., Feest E.R., Adamek N., Geeves M.A., Murry C.E., Regnier M. (2011) Upregulation of cardiomyocyte ribonucleotide reductase increases intracellular 2 deoxy-ATP, contractility, and relaxation. J. Mol. Cell. Cardiol., 51, 894–901. [DOI] [PMC free article] [PubMed] [Google Scholar]
- 49.Nowakowski S.G., Kolwicz S.C., Korte F.S., Luo Z., Robinson-Hamm J.N., Page J.L., Brozovich F., Weiss R.S., Tian R., Murry C.E., et al. (2013) Transgenic overexpression of ribonucleotide reductase improves cardiac performance. Proc. Natl. Acad. Sci. USA, 110, 6187–6192. [DOI] [PMC free article] [PubMed] [Google Scholar]
- 50.Regnier M., Homsher E. (1998) The effect of ATP analogs on posthydrolytic and force development steps in skinned skeletal muscle fibers. Biophys. J., 74, 3059–3071. [DOI] [PMC free article] [PubMed] [Google Scholar]
- 51.Regnier M., Martyn D.A., Chase P.B. (1998) Calcium regulation of tension redevelopment kinetics with 2-deoxy-ATP or low [ATP] in rabbit skeletal muscle. Biophys. J., 74, 2005–2015. [DOI] [PMC free article] [PubMed] [Google Scholar]
- 52.Regnier M., Rivera A.J., Chen Y., Chase P.B. (2000) 2-Deoxy-ATP enhances contractility of rat cardiac muscle. Circ. Res., 86, 1211–1217. [DOI] [PubMed] [Google Scholar]
- 53.Stevenson D.A., Carey J.C., Palumbos J., Rutherford A., Dolcourt J., Bamshad M.J. (2006) Clinical characteristics and natural history of Freeman-Sheldon syndrome. Pediatrics, 117, 754–762. [DOI] [PubMed] [Google Scholar]
- 54.Beck A.E., McMillin M.J., Gildersleeve H.I.S., Shively K.M.B., Tang A., Bamshad M.J. (2014) Genotype-phenotype relationships in Freeman-Sheldon syndrome. Am. J. Med. Genet., 164, 2808–2813. [DOI] [PubMed] [Google Scholar]
- 55.Butler-Browne G.S., Whalen R.G. (1984) Myosin isozyme transitions occurring during the postnatal development of the rat soleus muscle. Dev. Biol., 102, 324–334. [DOI] [PubMed] [Google Scholar]
- 56.Regnier M., Martyn D.A., Chase P.B. (1996) Calmidazolium alters Ca2+ regulation of tension redevelopment rate in skinned skeletal muscle. Biophys. J., 71, 2786–2794. [DOI] [PMC free article] [PubMed] [Google Scholar]
- 57.Ottenheijm C.A.C., Witt C.C., Stienen G.J., Labeit S., Beggs A.H., Granzier H. (2009) Thin filament length dysregulation contributes to muscle weakness in nemaline myopathy patients with nebulin deficiency. Hum. Mol. Genet., 18, 2359–2369. [DOI] [PMC free article] [PubMed] [Google Scholar]
- 58.Brenner B. (1983) Technique for stabilizing the striation pattern in maximally calcium-activated skinned rabbit psoas fibers. Biophys. J., 41, 99–102. [DOI] [PMC free article] [PubMed] [Google Scholar]
- 59.Regnier M., Morris C., Homsher E. (1995) Regulation of the cross-bridge transition from a weakly to strongly bound state in skinned rabbit muscle fibers. Am. J. Physiol., 269, C1532–C1539. [DOI] [PubMed] [Google Scholar]
- 60.Matsubara I., Umazume Y., Yagi N. (1985) Lateral filamentary spacing in chemically skinned murine muscles during contraction. J. Physiol., 360, 135–148. [DOI] [PMC free article] [PubMed] [Google Scholar]
- 61.Martyn D.A., Gordon A.M. (1988) Length and myofilament spacing-dependent changes in calcium sensitivity of skeletal fibres: effects of pH and ionic strength. J. Muscle Res. Cell Motil., 9, 428–445. [DOI] [PubMed] [Google Scholar]
- 62.Brenner B., Eisenberg E. (1986) Rate of force generation in muscle: correlation with actomyosin ATPase activity in solution. Proc. Natl. Acad. Sci. USA, 83, 3542–3546. [DOI] [PMC free article] [PubMed] [Google Scholar]
- 63.Colomo F., Piroddi N., Poggesi C., te Kronnie G., Tesi C. (1997) Active and passive forces of isolated myofibrils from cardiac and fast skeletal muscle of the frog. J. Physiol., 500, 535–548. [DOI] [PMC free article] [PubMed] [Google Scholar]
- 64.Kreutziger K.L., Piroddi N., Scellini B., Tesi C., Poggesi C., Regnier M. (2008) Thin filament Ca2+ binding properties and regulatory unit interactions alter kinetics of tension development and relaxation in rabbit skeletal muscle. J. Physiol., 586, 3683–3700. [DOI] [PMC free article] [PubMed] [Google Scholar]
- 65.Colomo F., Nencini S., Piroddi N., Poggesi C., Tesi C. (1998) Calcium dependence of the apparent rate of force generation in single striated muscle myofibrils activated by rapid solution changes. Adv. Exp. Med. Biol., 453, 373–382. [DOI] [PubMed] [Google Scholar]
- 66.Tesi C., Colomo F., Nencini S., Piroddi N., Poggesi C. (2000) The effect of inorganic phosphate on force generation in single myofibrils from rabbit skeletal muscle. Biophys. J., 78, 3081–3092. [DOI] [PMC free article] [PubMed] [Google Scholar]
- 67.Brandt P.W., Colomo F., Piroddi N., Poggesi C., Tesi C. (1998) Force regulation by Ca2+ in skinned single cardiac myocytes of frog. Biophys. J., 74, 1994–2004. [DOI] [PMC free article] [PubMed] [Google Scholar]
- 68.Dubowitz V., Sewry C.A. (2007) Muscle Biopsy: A Practical Approach, 3rd ed Elsevier Health Sciences, Philadelphia, PA. [Google Scholar]