

Abstract
DNA methylation is known to be associated with cell differentiation, aging, disease and cancer. There exists an expanding base of knowledge regarding tissue-specific DNA methylation, but we have little information about person-specific DNA methylation. Here, we analyze the DNA methylation patterns of multiple tissues from multiple individuals using a high-throughput quantitative assay of genome-wide DNA methylation, namely the Illumina GoldenGate BeadArray. DNA methylation patterns were largely conserved across 11 different tissues (r = 0.852) and across six individuals (r = 0.829), and we found that DNA was highly methylated in non-CpG islands and/or CpG sites that are not occupied by either H3K4me3 or H3K27me3 (P < 0.05). Finally, we found that the Illumina GoldenGate assay features a large number of probes (265/1505 probes, 17.6%) that contain single-nucleotide polymorphisms, which may interfere with DNA methylation analyses in genome-wide studies.
INTRODUCTION
Epigenetic marks are essential for embryonic stem cell differentiation (1), X-chromosome inactivation (2) and parental-dependent allelic imprinting (3). They are also involved in cancer and autoimmune disease (4). Abnormal epigenetic changes are influenced by aging (5), viruses (6), dietary folate (7), environmental factors (8) and cancer (9). Therefore, knowledge of inter-individual variation in terms of DNA methylation (I-DMRs) or tissue-specific differentially methylated regions (T-DMRs) in non-cancerous tissues within a single individual may be useful to help us understand aberrant DNA methylation in disease scenarios.
Previous studies have reported tissue-specific gene DNA methylation with a limited number of tissues from different individuals, using a variety of DNA methylation assay techniques (10–12). The tissues in these studies were usually obtained from multiple individuals; therefore, it was often impossible to determine intra-individual DNA methylation variation from these studies. Although inter-individual variation in DNA methylation has been reported at specific genomic regions, including transposable elements, imprinted genes and the ‘inactive’ female X-chromosomes, to our knowledge DNA methylation analysis to identify intra-individual and inter-individual variations has not been performed to date.
In this study, we analyzed the DNA methylation of 1505 CpG dinucleotides in 11 organs from six autopsy subjects using the high-throughput Illumina BeadArray methylation assay. Unlike in previous studies, we were able to analyze differential DNA methylation between tissues (T-DMRs) as well as between individuals (I-DMRs) because multiple tissues were collected from each subject. We found that DNA methylation patterns are largely conserved between organs and individuals. However, we also identified a number of tissue-specific and person-specific differentially methylated genes. We observed that intra-individual DNA methylation patterns exhibit greater variation than inter-individual DNA methylation patterns, consistent with tissue-specific DNA methylation patterns. In addition, comparison of our data with studies examining histone H3 methylation status suggests that DNA methylation may be associated with specific ‘histone codes’. Unexpectedly, we identified a large number of either single-nucleotide polymorphisms (SNPs) or DNA repetitive elements that may interfere with accurate DNA methylation measurements.
RESULTS
DNA methylation profiling of 11 tissues from six autopsy cases and the effects of SNPs on DNA methylation analysis
We were interested in studying tissue-specific and individual-specific DNA methylation patterns. We collected 11 tissue types (bladder, colon, esophagus, liver, lung, pancreas, stomach, brain, heart, kidney and spleen) from six individuals at the time of post-mortem examination. These six individuals had various medical diagnoses at the time of death (breast cancer, lung cancer, AIDS, diabetes, cirrhosis); however, we only collected tissues from anatomically normal areas. Table 1 lists gender, age, ethnicity, post-mortem interval (PMI) and basic clinical information of the subjects. DNA was isolated from each tissue, treated with bisulfite and analyzed using Illumina GoldenGate BeadArray technology, which focuses on promoter DNA methylation of 1505 CpG sites in 807 genes. The DNA Methylation Cancer Panel I probe set covers various gene classes, including tumor suppressor genes, oncogenes, genes involved in DNA repair, cell cycle control, differentiation, apoptosis, X-linked and imprinted genes.
Table 1.
Clinical information of autopsy cases studied. PMI- Post-mortem interval
| Autopsy | Age | Gender | Race | Diagnosis of autopsy | PMI (h) |
|---|---|---|---|---|---|
| Case 1 | 58 | Female | African American | Metastatic breast cancer | 71 |
| Case 2 | 52 | Male | African American | Gastrointestinal bleeding, cirrhosis | 1623 |
| Case 3 | 35 | Male | Hispanic | Cirrhosis, peritonitis | 98 |
| Case 4 | 60 | Female | Caucasian | Diabetes | 83 |
| Case 5 | 48 | Male | African American | AIDS | 46 |
| Case 6 | 53 | Male | Hispanic | Lung cancer | 44 |
During the course of our study, we discovered that SNPs might affect DNA methylation analysis when the Illumina BeadArray assay is used. We found that Illumina reactions at some probes would report high or low beta values, consistent with high or low levels of DNA methylation for all tissues studied within a single individual. Subsequent direct bisulfite-PCR Pyrosequencing confirmation of these sites revealed the presence of an SNP either at the site of methylation or within the assay probe (Supplementary Material, 1–4). Using the UCSC human genome build 18 (NCBI build 36), we found that there are 411 Illumina probe sets that contain SNPs and/or DNA repetitive elements that may potentially affect DNA methylation analyses. These probes are listed in Supplementary Material, 5. The incidence of most of these SNPs is rare; however, we excluded all of these probes in our subsequent analyses. Raw Illumina BeadArray data are presented in Supplementary Material, 6.
In our analyses, we omitted DNA methylation probe sites with potential SNPs or repetitive elements, X-chromosome genes that are hypermethylated in females and probes with detection P-values >0.05. In addition, we excluded samples for which failed Illumina reactions accounted for >5% of all loci. These included four pancreatic samples, and the outcome was likely attributable to poor DNA quality due to autophagy of the pancreas after death. We used a hierarchical cluster analysis of 905 autosomal DNA methylation probes to detect subsets of genes that exhibited concordant DNA methylation profiles (Fig. 1). X-chromosome genes that exhibit gender-specific methylation were processed separately from autosomal loci and are shown at the bottom of Figure 1. The majority of all CpG sites showed similar DNA methylation levels in all organs and individuals; however, we identified a group of CpG sites that was uniquely methylated in certain organs.
Figure 1.
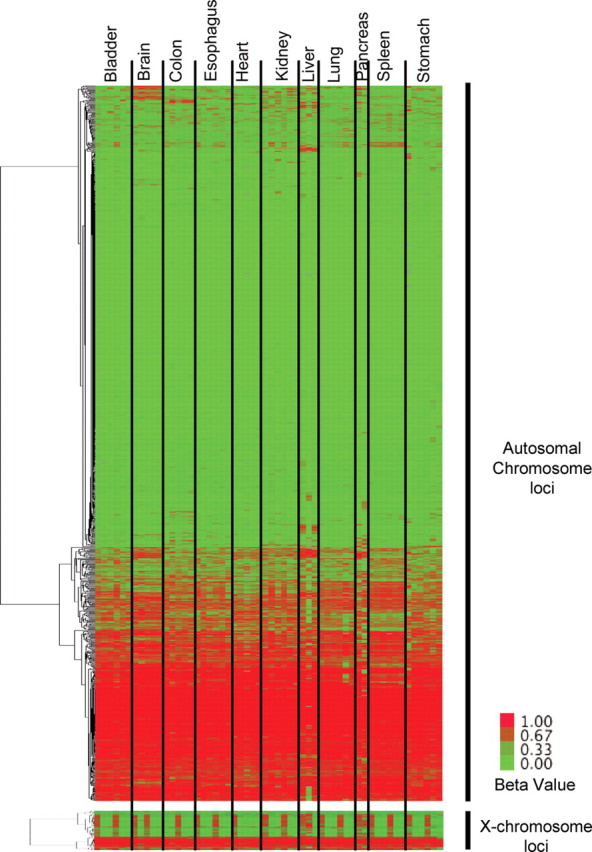
High-throughput DNA methylation analysis of 11 different tissues from each of the six individuals. The Illumina GoldenGate BeadArray DNA methylation was used to analyze the DNA methylation of 1505 CpG sites (807 genes) for 11 different tissues from each of the six individuals who had undergone autopsy. DNA methylation data for 905 autosomal CpG sites were analyzed by one-dimensional hierarchical cluster (CpG sites: rows; tissue DNA samples: columns, organized by tissue). X-chromosome genes (n = 84) are analyzed separately and shown at the bottom. Green indicates low beta values, representing low DNA methylation levels, and red indicates high beta values, representing higher DNA methylation levels. Note that the data for only three liver and two pancreas sample tissues are shown since certain samples failed quality controls (see Materials and Methods).
Tissue- and person-specific DNA methylation
For most genes, we failed to find many DNA methylation loci that demonstrated major differences across the 11 organs (Fig. 1); however, a two-factor analysis of variance (ANOVA) identified sites of varying DNA methylation across tissue type and/or individual (see Materials and Methods). Using this analysis, we identified 431 loci that exhibited tissue-specific differential DNA methylation (T-DMR), 25 loci that evidenced individual-specific differential DNA methylation (I-DMR) and 20 loci that varied across both tissue and individual (all FDR adjusted P-values < 0.05) (Supplementary Material, 7 and 8). DNA methylation data for the remaining 429 loci were not related to either specific tissues or individuals (Fig. 2).
Figure 2.

Venn diagram showing the number of T-DMR and/or I-DMR loci. DNA methylation varies across tissues for 431 of the 905 CpG loci studied, and varies across individuals for 25 loci. Twenty targets vary across both tissue and person, and 429 CpG loci are randomly methylated across tissue and/or person (both BH corrected P > 0.05).
An example of a T-DMR gene is MST1R (macrophage stimulating 1 receptor), which was heavily methylated (minimum beta value 0.71 and maximum beta value 0.93) only in brain tissue from all of the individuals studied (Fig. 3A and Supplementary Material, 9). The mean beta value of MST1R DNA methylation in the brain was 0.82 (SEM = 0.013); in all other organs, the MST1R DNA methylation beta value was 0.11 (SEM = 0.018, P < 1 × 10⁻⁸). The TUBB3 (tubulin, beta 3) gene is an example of an I-DMR locus and was differentially methylated between individuals (Supplementary Material, 9). Cases 1, 2, 3 and 5 exhibited higher DNA methylation (beta values of 0.35, 0.36, 0.33 and 0.33, respectively) than cases 4 and 6 (DNA methylation beta values of 0.04 and 0.06, respectively) (P < 1 × 10⁻¹⁷). Interestingly, we observed highly consistent DNA methylation levels within all the 11 tissues from individuals for the TUBB3 locus (P < 1 × 10⁻¹⁵, mean VAR = 0.06). DNA methylation results for representative T-DMR genes and I-DMR genes are shown in Supplementary Material, 9. We confirmed the DNA methylation status of loci that were identified as either T-DMR or I-DMR genes by Illumina BeadArray using quantitative bisulfite-PCR Pyrosequencing technology (Fig. 3). We found that Illumina and Pyrosequencing data were strongly correlated (mean r = 0.82, P < 0.01).
Figure 3.
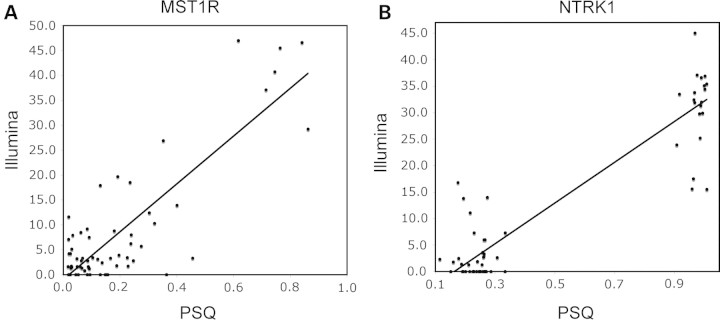
Validation of Illumina data using bisulfite-PCR Pyrosequencing. Illumina BeadArray DNA methylation analyses of macrophage stimulating 1 receptor (MST1R_p392_F) (A), a tissue-specific gene, and neurotrophic tyrosine kinase receptor type 1 (NTRK1_E74_F) (B), an individual-specific gene, were validated using a more quantitative DNA methylation analysis method, namely bisulfite-PCR Pyrosequencing. The y-axis represents either the beta value from Illumina analysis or the percentage of DNA methylation as evidenced by Pyrosequencing. The x-axis represents either tissue or autopsy case IDs. Data are represented as mean ± SEM.
Intra-individual and inter-individual variations in DNA methylation
We next investigated whether DNA methylation patterns exhibited greater similarity between the same tissues from different individuals or between different tissues from the same individual. Unsupervised two-dimensional cluster analysis for our selected 905 autosomal gene loci using data from 66 samples revealed that the similarity of DNA methylation between tissues was greater than between individuals (Fig. 4), as tissues mostly clustered together. Tissue from different individuals showed the highest concordance of DNA methylation patterns compared with other factors, such as person, diagnosis, gender, age and race. Brain or spleen tissues from all the six autopsy cases clustered together, whereas heart, kidney or lung tissues from four or five autopsy cases clustered similarly together. Factors including person, diagnosis or age were stochastically distributed and exhibited no clustering. Our analysis of all possible pairs of samples of the same tissue type, measured from different subjects, consistently yielded, on average, a higher average correlation than the average correlation taken from an analysis of all the possible pairs of discordant tissues, measured from the same subject (difference in observed correlations = 0.0237, bootstrap CI = 0.0197–0.0278) (Table 2). On the basis of these analyses, we conclude that DNA methylation patterns were more consistent between the same tissues from different people than between different tissues from the same individual, but the difference was subtle.
Figure 4.

Intra-tissue and intra-individual variability of DNA methylation. Two-way hierarchical cluster analysis consistent with DNA methylation profiles of 11 organs from six individuals. The color codes for tissue, person, diagnosis, gender, age, race and PMI are based on data in Table 1.
Table 2.
Mean correlation of DNA methylation between tissues for all cases and individuals for all tissues
| Mean correlation | |
|---|---|
| Tissue | |
| Bladder | 0.8892630 |
| Brain | 0.8988964 |
| Colon | 0.8165192 |
| Esophagus | 0.8919248 |
| Heart | 0.8094744 |
| Kidney | 0.8750465 |
| Liver | 0.7385619 |
| Lung | 0.9210093 |
| Pancreas | 0.7696141 |
| Spleen | 0.9414381 |
| Stomach | 0.8295292 |
| Average | 0.8528434 |
| Person | |
| Case 1 | 0.8257106 |
| Case 2 | 0.8560995 |
| Case 3 | 0.8441969 |
| Case 4 | 0.7878873 |
| Case 5 | 0.8626062 |
| Case 6 | 0.7986565 |
| Average | 0.8291928 |
Characteristics of T-DMR and I-DMR loci
To examine the features that determine differential DNA methylation of T-DMR or I-DMR genes, we analyzed the mean beta values of all individuals. The assayed CpG loci were placed −1499 to 497 bp from the transcription start site (TSS). The comparison of distance to TSS and DNA methylation data led us to conclude that the distance of CpG sites to TSS is not related to the level of DNA methylation (r = −0.035, P = 0.29). The percentage of G and C nucleotides in a 500 bp range around the assayed locus also failed to show a strong correlation with DNA methylation level (r = −0.380, P < 0.05). However, the density of CpGs near the assayed locus was strongly correlated with DNA methylation level (r = −0.6112, P < 1 × 10⁻¹⁶) (Fig. 5A). The assayed loci in the CpG islands (CGIs) were not methylated (median beta value = 0.071), and the loci in non-CpG islands (NCGIs) were heavily methylated (median beta value = 0.797) (r = 0.6408, P < 1 × 10⁻¹⁶) (Fig. 5B). Interestingly, the history of histone marks in ES cells (13,14) is strongly correlated with the DNA methylation level in adult tissues. We compared our DNA methylation data with previously published studies of H3K4me3 and H3K27me3 status in ES cells (13,14). The CpG sites that are occupied by both histone H3K4me3 and H3K27me3 (‘Bivalent’) in ES cells exhibited low DNA methylation levels in adult tissues (beta value = 0.088, n = 36). The status with the H3K4me3 mark alone (‘H3K4me3’) also suggested low DNA methylation levels (beta value = 0.078, n = 224); however, the CpG sites with neither H3K4me3 nor H3K27me3 (‘None’) exhibited high DNA methylation levels (beta value = 0.856, n = 127) (Fig. 6). Interestingly, all bivalent loci in this study were in CGI, and 88% of the loci labeled ‘None’ were in NCGI regions. These data are consistent with our previous result that the density of CGI was inversely correlated with DNA methylation.
Figure 5.
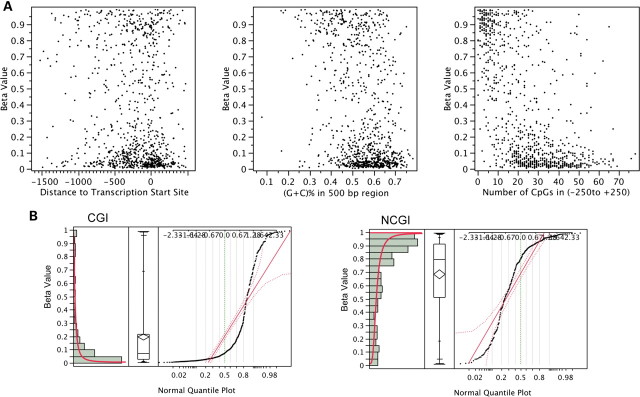
Distribution of mean CpG methylation. (A) The comparison of mean CpG methylation with distance to TSS (left), (G+C)% in 500 bp region (middle) and number of CpGs (right). DNA methylation levels are not correlated with distance to TSS (r = −0.035, P = 0.29) or GC% (r = −0.380, P < 0.05), but are correlated with number of CpGs (r = −0.6112, P < 1 × 10⁻¹⁶). (B) The DNA methylation level is highly correlated with NCGI (r = 0.6408, P < 1 × 10⁻¹⁶). The median methylation level in the CGI loci exhibits a beta value of 0.071, and the same value measures 0.797 in the case of NCGI. Also shown are histogram (left), quantile box plot (middle) and normal quantile plot with continuous fit, beta (right).
Figure 6.

Correlation of CpG methylation with histone status. Median CpG methylation in an area with H3K4me3 and H3K27me3 histone markers (‘Bivalent’, n = 36) exhibits a beta value of 0.088; for ‘H3K4me3’, the value is 0.078 (n = 224). Equivalent metrics are 0.4 for ‘H3K27me3’ (n = 11) and 0.856 for areas that exhibit neither H3K4me3 nor H3K27me3 histone markers (‘None,’ n = 127). ‘Bivalent’ and ‘H3K4me3’ loci are unmethylated, and ‘None’ are highly methylated (P < 0.05). Also shown are the histogram (left), quantile box plot (middle) and normal quantile plot with continuous fit, beta (right).
We next observed the characteristics of T-DMRs and I-DMRs. T-DMRs are preferentially found in NCGI regions than in CGIs (frequency increased from 32 to 43% in T-DMR, P < 0.05); however, we found no significant I-DMR preference between CGI and NCGI (Fig. 7). T-DMRs were less prevalent in H3K4me3 histone-marked regions compared with all other genes studied (decreased from 63 to 49%, P = 0.0037). However, T-DMR and I-DMR genes were more likely to be found in the loci that contained neither H3K4me3 nor H3K27me3 (P = 0.0016 and 0.0034, respectively) when compared with all genes studied (Fig. 7). The Polycomb group (PcG) complex-binding region, which is known to be a preferential target of aberrant DNA methylation in cancer, did not exhibit any significant difference in either tissue- or individual-specific methylated loci (Fig. 7).
Figure 7.

Characteristics of tissue-specific genes (T-DMR) and individual-specific genes (I-DMR). The ‘Total’ column of the pie charts represents the subset of 905 loci that were analyzed by the Illumina platform and used in our analysis. The ‘T-DMR’ column of the charts includes the 521 tissue-specific genes, and the ‘I-DMR’ includes the 30 individual specific genes. The ‘CGI’ top row reflects the ratio of CGIs versus NCGIs. The ‘Histone’ middle row lists the distribution of H3K4 and H3K27 trimethylation histone marks on the basis of previous reports that focus on ES cells. Finally, the bottom row examines the association with the PcG complex (SUZ12, EED, H3K27me3). We note a trend whereby genes that show ‘T-DMR’-specific DNA methylation tend to be associated with NCGI promoters and are not associated with H3K4me3 or H3K27me3.
DISCUSSION
In this study, we determined the inter- and intra-individual variations in terms of DNA methylation of 1505 CpG loci in multiple tissues from individuals who have undergone post-mortem examination. Our results suggest that tissues and individuals exhibit unique DNA methylation patterns; however, we conclude in general that DNA methylation patterns throughout tissues and individuals are very homogenous.
Previous studies have examined DNA methylation patterns in different tissues using a variety of methods, including restriction landmark genome scanning (15), reduced representation bisulfite sequencing (16) and a novel technique for the purification of CGIs (11). Investigators consistently report that CGI regions with a low frequency of CpGs are generally associated with tissue-specific genes (16,17). We find that T-DMRs are preferentially located in non-CGIs, although there was still a large portion of CGIs that showed T-DMR variation. Song et al. (15) have reported that tissue-specific DNA methylation in CGI promoter regions is associated with tissue-specific gene repression . In our study, we identified a weak correlation between DNA methylation and previously published gene expression data (18) (data not shown). However, our analysis of correlations between DNA methylation and histone methylation of T-DMRs shows that they are preferentially located in genomic regions lacking H3K4me3 and H3K27me3. Our work, along with previous studies, demonstrates that non-CGIs are associated with the absence of both H3K4me3 and H3K27me3 (16). We find that T-DMRs are more likely to be located in non-CGIs that are not associated with H3K4me3 or H3K27me3. Therefore, T-DMRs are likely to be the regions that are not associated with Polycomb, H3K4me3 or H3K27me3 in stem cells and that must therefore be identified by some other epigenetic mark. I-DMR genes, unlike T-DMRs, do not express any preference for CpG density or Polycomb occupancy. These findings are in disagreement with a recent report, which studied the DNA methylation profiles of CD4+ T lymphocytes from multiple individuals (19). This bioinformatic analysis showed that CpG-rich regions exhibited low and somewhat similar levels of DNA methylation in all individuals. In contrast, NCGI regions exhibited substantially elevated levels of inter-individual variation. We believe that this discrepancy might be attributable to the different tissue types used in our study. We would have ideally liked to obtain histone status and expression data from our autopsy tissue; however, we were unable to obtain high-quality protein or mRNA evaluations from our samples (data not shown). A recent report states that the tissues have epigenetic differences by aging (20). Unfortunately, we do not see any major DNA methylation pattern changes with age in this study. A possible reason of this discrepancy may come from the different sensitivities of the DNA methylation detection techniques and tissue types tested.
As noted earlier, we analyzed DNA methylation from human autopsy specimens, which is important because it allows for the investigation of intra- and inter-individual variations in DNA methylation. Previous landmark studies of tissue-specific methylation have used either pooled tissues from individuals (16) or somatic cells from multiple individuals (21). Unfortunately, this does not allow for the study of intra-individual variation. Healthy individuals who died of some traumatic event would have been better sources for the tissues analyzed in our study, but these types of samples were not available. Thus, one limitation of this study is that the time periods between death and tissue collection were variable (PMI: 44–1623 h), and two of the patients did have cancer. However, we do observe clustering of tissue-specific DNA methylation patterns, independent of PMI or the presence of cancer. These data are consistent with previous reports that brain DNA methylation patterns have a stronger correlation with the region of the brain studied than with PMI (10). In addition, histologically normal tissues from cancer patients were found to cluster with normal cancer-free tissues, independent of cancer status. An analysis of matched sets of lung cancers and adjacent normal lung tissue taken at the time of resection demonstrates that our normal cadaveric lung samples cluster with the normal ‘live’ lung tissue data from patients with lung cancer (data not shown).
By processing our data to identify I-DMR loci, we discovered a technical pitfall associated with DNA methylation sites. Previous studies have shown that CpG sites have a 42-fold higher frequency of mutations compared with non-CpG sites (22). It is known that deamination of methylated cytosine generates thymine, whereas deamination of unmethylated cytosine creates uracil, which is recognized as an unnatural DNA base and is more readily repaired (23,24). Deaminated 5-methylcytosine creates thymine and is indistinguishable from the thymine/uracil created by bisulfite conversion of cytosine. This technical artifact is reported for our Illumina system, but is a problem that will be shared by all bisulfite-based techniques. This issue may occur in several techniques that are currently used to study DNA methylation, including those that are based on restriction enzymes, probes specifically designed to map onto the target sequence, and others. Therefore, it is necessary to apply stringent filtering criteria to the DNA methylation loci studied to avoid problematic polymorphisms in certain target regions. It is equally important to validate certain DNA methylation loci of interest with DNA sequencing-based techniques, such as direct bisulfite sequencing or Pyrosequencing. Another possible solution to address the polymorphisms problem may be to design assays that simultaneously interrogate both strands of bisulfite-treated DNA, in order to distinguish between an SNP and a methylation difference as described previously (25).
MATERIALS AND METHODS
Ethics statement
All human tissue was collected with the approval of the University of Southern California Institutional Review Board and was conducted in accordance with institutional guidelines.
Tissue collection and DNA preparation
Eleven somatic tissues, namely brain (cerebral cortex), spleen, heart, kidney, esophagus (mucosa), stomach (mucosa), bladder (mucosa), lung, colon (mucosa), pancreas and liver, were collected from six individuals who have undergone post-mortem examination. All individuals of this study were refrigerated shortly after death. Autopsy case information is listed in Table 1. Only histologically normal tissue was collected; however, we note that tissues collected from each organ may represent a mixture of the cell types that are normally found in that organ. Collected tissue was dissected at the time of autopsy and frozen at −70°C.
DNA was extracted using standard phenol/chloroform methods and stored at −20°C until needed. Bisulfite modification of genomic DNA was performed using the EZ-96 DNA Methylation-Gold Kit™ (Zymo Research, Orange, CA, USA), according to the manufacturer's recommended protocol. Amounts of bisulfite-converted DNA were assessed prior to the use of the GoldenGate assay using the ALU-based MethyLight control reaction, as described elsewhere (25).
We used whole-genome amplification (WGA) DNA as an ‘unmethylated’ control, and M.SssI-treated DNA as a fully ‘methylated’ control. WGA kits (REPLI-g, Qiagen, Doncaster, Australia) were used as recommended to amplify DNA from normal blood and were bisulfite sequence-treated, as described earlier. The methylation reactions were carried out in 1× M.SssI buffer with 160 µm SAM (supplied with M.SssI by New England Biolabs, MA, USA), and prior to bisulfite treatment, DNA was treated on three sequential occasions with M.SssI to guarantee complete DNA methylation.
Illumina GoldenGate BeadArray DNA methylation
DNA methylation status was assessed using the GoldenGate assay for Methylation Cancer Panel I from Illumina (La Jolla, CA, USA) and performed at the USC Epigenome Center, as described elsewhere (26) (the commercially available DNA Methylation Cancer Panel I interrogates 1505 independent CpG sites selected from 807 genes; 231 genes contain one CpG site per gene, 463 genes contain two CpG sites and 114 genes have three or more CpG sites). Data were reported as beta values, which are ratios of competitive primers for the unmethylated and methylated bisulfite sequences. The USC Epigenome Center assessed Illumina GoldenGate DNA methylation data by comparison with a series of negative controls embedded in the assay (Detection P).
Pyrosequencing
Illumina methylation data were confirmed using bisulfite-PCR Pyrosequencing. We used the PyroGold Reagent Kit (Biotage, Uppsala, Sweden) on a Pyrosequencing 96HS per the manufacturer's protocol. In brief, 10 µl PCR products for each sequencing reaction were immobilized onto streptavidin-coated beads (Streptavidin Sepharose HP, Amersham Biosciences Ltd) in binding buffer (10 mm Tris–HCl, pH 7.6, 2 m NaCl, 1 mm EDTA, 0.1% Tween 20) for 10 min. The biotinylated template was purified with the Pyrosequencing vacuum prep tool (Biotage) and incubated with 10 pmol per reaction individually with each sequencing primer in an annealing buffer (20 mm Tris–acetate, pH 7.6, and 2 mm MgAc2). The DNA strands were denatured at 80°C for 2 min and re-annealed at room temperature for 10 min. Sequencing was performed according to the manufacturer's instructions. The allele frequency (percent cytosine or percent thymidine) was calculated from the peak height analyzed with the allele quantification module in the PSQ 96 HS software (Biotage). Methylation percentage was determined from the cytosine-to-thymidine conversion ratio [methylation = %cytosine/(%cytosine + %thymidine)]. PCR primers and Pyrosequencing primers are listed in Supplementary Material, 10.
Data analysis
The Illumina data were analyzed using the open-source programs Cluster 3.0 and Java Treeview, and the Bioconductor package in the R software (27). Cluster 3.0 was used to perform an unsupervised hierarchical cluster analysis by applying complete linkage clustering with a Euclidean distance metric. Bioconductor was used to compute correlation coefficients and fit linear models. We eliminated the loci that have beta values <0.10 or >0.90 across all tissues and individuals. This led to the exclusion of 117 invariant sites. In addition, X-chromosome-linked loci, loci that possibly contain SNPs and/or repetitive element loci were eliminated to increase the strength our analysis. We estimated the Pearson correlation to understand the strength and direction of a postulated linear relationship between beta values measured from random pairs of tissues within a person and between random pairs of the same tissue type taken from different people. We then applied a two-factor ANOVA to identify T-DMR and I-DMR loci. The DNA methylation beta value was the outcome, with organ type (n = 11) and individual (n = 6) as predictor variables. We used a rank transformation of the beta values to remove the dependence of variance on the mean beta value. To control for testing multiple genomic regions within a single study, we maintained an overall 5% false-discovery rate using the Benjamini and Hochberg (BH) approach. T-DMR and I-DMR loci are identified as those loci having a BH adjusted P-value <0.05 in the two-factor ANOVA model.
SNPs and repeats that affect the Illumina DNA methylation were identified on the basis of the annotation references from the UCSC human genome build 18 (NCBI build 36). All of the reference SNPs that were located within DNA sequence regions with which Illumina DNA methylation probes can hybridize are reported in Supplementary Material, 5. The reference repeats that were located within or overlapping with Illumina DNA methylation targeting sequences are also included in Supplementary Material, 5.
SUPPLEMENTARY MATERIAL
AUTHOR CONTRIBUTIONS
A.S.Y. conceived and designed the experiments; H.-M.B. and D.J.W. performed the experiments; H.-M.B., K.D.S. and F.P. analyzed the data; G.K., P.W.L. and A.S.Y. contributed reagents/materials/analysis tools; H.-M.B. and A.S.Y. wrote the paper.
Supplementary Material
ACKNOWLEDGEMENTS
We thank Dr Darryl Shibata for critical comments on the manuscript. We appreciate the USC Epigenome Center for assistance with data generation and technical support. A.S.Y. is the recipient of an American Society of Clinical Oncology-Association of Subspecialty Professors Career Development Award in Geriatric Oncology which also provided funding for this project.
Conflict of Interest statement. None declared.
REFERENCES
- 1.Bibikova M., Laurent L.C., Ren B., Loring J.F., Fan J.B. Unraveling epigenetic regulation in embryonic stem cells. Cell Stem Cell. 2008;2:123–134. doi: 10.1016/j.stem.2008.01.005. [DOI] [PubMed] [Google Scholar]
- 2.Hellman A., Chess A. Gene body-specific methylation on the active X-chromosome. Science (New York, N.Y.) 2007;315:1141–1143. doi: 10.1126/science.1136352. [DOI] [PubMed] [Google Scholar]
- 3.Feinberg A.P. Phenotypic plasticity and the epigenetics of human disease. Nature. 2007;447:433–440. doi: 10.1038/nature05919. [DOI] [PubMed] [Google Scholar]
- 4.Richardson B.C. Role of DNA methylation in the regulation of cell function: autoimmunity, aging and cancer. J. Nutr. 2002;132:2401S–2405S. doi: 10.1093/jn/132.8.2401S. [DOI] [PubMed] [Google Scholar]
- 5.Ahuja N., Li Q., Mohan A.L., Baylin S.B., Issa J.P. Aging and DNA methylation in colorectal mucosa and cancer. Cancer Res. 1998;58:5489–5494. [PubMed] [Google Scholar]
- 6.Tsai C.N., Tsai C.L., Tse K.P., Chang H.Y., Chang Y.S. The Epstein–Barr virus oncogene product, latent membrane protein 1, induces the downregulation of E-cadherin gene expression via activation of DNA methyltransferases. Proc. Natl Acad. Sci. USA. 2002;99:10084–10089. doi: 10.1073/pnas.152059399. [DOI] [PMC free article] [PubMed] [Google Scholar]
- 7.Kim Y.I., Christman J.K., Fleet J.C., Cravo M.L., Salomon R.N., Smith D., Ordovas J., Selhub J., Mason J.B. Moderate folate deficiency does not cause global hypomethylation of hepatic and colonic DNA or c-myc-specific hypomethylation of colonic DNA in rats. Am. J. Clin. Nutr. 1995;61:1083–1090. doi: 10.1093/ajcn/61.4.1083. [DOI] [PubMed] [Google Scholar]
- 8.Bollati V., Baccarelli A., Hou L., Bonzini M., Fustinoni S., Cavallo D., Byun H.M., Jiang J., Marinelli B., Pesatori A.C., et al. Changes in DNA methylation patterns in subjects exposed to low-dose benzene. Cancer Res. 2007;67:876–880. doi: 10.1158/0008-5472.CAN-06-2995. [DOI] [PubMed] [Google Scholar]
- 9.Foltz G., Ryu G.Y., Yoon J.G., Nelson T., Fahey J., Frakes A., Lee H., Field L., Zander K., Sibenaller Z., et al. Genome-wide analysis of epigenetic silencing identifies BEX1 and BEX2 as candidate tumor suppressor genes in malignant glioma. Cancer Res. 2006;66:6665–6674. doi: 10.1158/0008-5472.CAN-05-4453. [DOI] [PubMed] [Google Scholar]
- 10.Ladd-Acosta C., Pevsner J., Sabunciyan S., Yolken R.H., Webster M.J., Dinkins T., Callinan P.A., Fan J.B., Potash J.B., Feinberg A.P. DNA methylation signatures within the human brain. Am. J. Hum. Genet. 2007;81:1304–1315. doi: 10.1086/524110. [DOI] [PMC free article] [PubMed] [Google Scholar]
- 11.Illingworth R., Kerr A., Desousa D., Jorgensen H., Ellis P., Stalker J., Jackson D., Clee C., Plumb R., Rogers J., et al. A novel CpG island set identifies tissue-specific methylation at developmental gene loci. PLoS Biol. 2008;6:e22. doi: 10.1371/journal.pbio.0060022. [DOI] [PMC free article] [PubMed] [Google Scholar]
- 12.Rakyan V.K., Hildmann T., Novik K.L., Lewin J., Tost J., Cox A.V., Andrews T.D., Howe K.L., Otto T., Olek A., et al. DNA methylation profiling of the human major histocompatibility complex: a pilot study for the human epigenome project. PLoS Biol. 2004;2:e405. doi: 10.1371/journal.pbio.0020405. [DOI] [PMC free article] [PubMed] [Google Scholar]
- 13.Pan G., Tian S., Nie J., Yang C., Ruotti V., Wei H., Jonsdottir G.A., Stewart R., Thomson J.A. Whole-genome analysis of histone H3 lysine 4 and lysine 27 methylation in human embryonic stem cells. Cell Stem Cell. 2007;1:299–312. doi: 10.1016/j.stem.2007.08.003. [DOI] [PubMed] [Google Scholar]
- 14.Zhao X.D., Han X., Chew J.L., Liu J., Chiu K.P., Choo A., Orlov Y.L., Sung W.K., Shahab A., Kuznetsov V.A., et al. Whole-genome mapping of histone H3 Lys4 and 27 trimethylations reveals distinct genomic compartments in human embryonic stem cells. Cell Stem Cell. 2007;1:286–298. doi: 10.1016/j.stem.2007.08.004. [DOI] [PubMed] [Google Scholar]
- 15.Song F., Smith J.F., Kimura M.T., Morrow A.D., Matsuyama T., Nagase H., Held W.A. Association of tissue-specific differentially methylated regions (TDMs) with differential gene expression. Proc. Natl Acad. Sci. USA. 2005;102:3336–3341. doi: 10.1073/pnas.0408436102. [DOI] [PMC free article] [PubMed] [Google Scholar]
- 16.Meissner A., Mikkelsen T.S., Gu H., Wernig M., Hanna J., Sivachenko A., Zhang X., Bernstein B.E., Nusbaum C., Jaffe D.B., et al. Genome-scale DNA methylation maps of pluripotent and differentiated cells. Nature. 2008;454:766–770. doi: 10.1038/nature07107. [DOI] [PMC free article] [PubMed] [Google Scholar]
- 17.Eckhardt F., Lewin J., Cortese R., Rakyan V.K., Attwood J., Burger M., Burton J., Cox T.V., Davies R., Down T.A., et al. DNA methylation profiling of human chromosomes 6, 20 and 22. Nat. Genet. 2006;38:1378–1385. doi: 10.1038/ng1909. [DOI] [PMC free article] [PubMed] [Google Scholar]
- 18.Son C.G., Bilke S., Davis S., Greer B.T., Wei J.S., Whiteford C.C., Chen Q.R., Cenacchi N., Khan J. Database of mRNA gene expression profiles of multiple human organs. Genome Res. 2005;15:443–450. doi: 10.1101/gr.3124505. [DOI] [PMC free article] [PubMed] [Google Scholar]
- 19.Bock C., Walter J., Paulsen M., Lengauer T. Inter-individual variation of DNA methylation and its implications for large-scale epigenome mapping. Nucleic Acids Res. 2008;36:e55. doi: 10.1093/nar/gkn122. [DOI] [PMC free article] [PubMed] [Google Scholar]
- 20.Fraga M.F., Ballestar E., Paz M.F., Ropero S., Setien F., Ballestar M.L., Heine-Suner D., Cigudosa J.C., Urioste M., Benitez J., et al. Epigenetic differences arise during the lifetime of monozygotic twins. Proc. Natl Acad. Sci. USA. 2005;102:10604–10609. doi: 10.1073/pnas.0500398102. [DOI] [PMC free article] [PubMed] [Google Scholar]
- 21.Shiota K., Kogo Y., Ohgane J., Imamura T., Urano A., Nishino K., Tanaka S., Hattori N. Epigenetic marks by DNA methylation specific to stem, germ and somatic cells in mice. Genes Cells. 2002;7:961–969. doi: 10.1046/j.1365-2443.2002.00574.x. [DOI] [PubMed] [Google Scholar]
- 22.Cooper D.N., Youssoufian H. The CpG dinucleotide and human genetic disease. Hum. Genet. 1988;78:151–155. doi: 10.1007/BF00278187. [DOI] [PubMed] [Google Scholar]
- 23.Brown T.C., Jiricny J. A specific mismatch repair event protects mammalian cells from loss of 5-methylcytosine. Cell. 1987;50:945–950. doi: 10.1016/0092-8674(87)90521-6. [DOI] [PubMed] [Google Scholar]
- 24.Wiebauer K., Jiricny J. In vitro correction of G.T mispairs to G.C pairs in nuclear extracts from human cells. Nature. 1989;339:234–236. doi: 10.1038/339234a0. [DOI] [PubMed] [Google Scholar]
- 25.Weisenberger D.J., Campan M., Long T.I., Kim M., Woods C., Fiala E., Ehrlich M., Laird P.W. Analysis of repetitive element DNA methylation by MethyLight. Nucleic Acids Res. 2005;33:6823–6836. doi: 10.1093/nar/gki987. [DOI] [PMC free article] [PubMed] [Google Scholar]
- 26.Bibikova M., Chudin E., Wu B., Zhou L., Garcia E.W., Liu Y., Shin S., Plaia T.W., Auerbach J.M., Arking D.E., et al. Human embryonic stem cells have a unique epigenetic signature. Genome Res. 2006;16:1075–1083. doi: 10.1101/gr.5319906. [DOI] [PMC free article] [PubMed] [Google Scholar]
- 27.Gentleman R.C., Carey V.J., Bates D.M., Bolstad B., Dettling M., Dudoit S., Ellis B., Gautier L., Ge Y., Gentry J., et al. Bioconductor: open software development for computational biology and bioinformatics. Genome Biol. 2004;5:R80. doi: 10.1186/gb-2004-5-10-r80. [DOI] [PMC free article] [PubMed] [Google Scholar]
Associated Data
This section collects any data citations, data availability statements, or supplementary materials included in this article.