

Abstract
How humans solve the cocktail party problem remains unknown. However, progress has been made recently thanks to the realization that cortical activity tracks the amplitude envelope of speech. This has led to the development of regression methods for studying the neurophysiology of continuous speech. One such method, known as stimulus-reconstruction, has been successfully utilized with cortical surface recordings and magnetoencephalography (MEG). However, the former is invasive and gives a relatively restricted view of processing along the auditory hierarchy, whereas the latter is expensive and rare. Thus it would be extremely useful for research in many populations if stimulus-reconstruction was effective using electroencephalography (EEG), a widely available and inexpensive technology. Here we show that single-trial (≈60 s) unaveraged EEG data can be decoded to determine attentional selection in a naturalistic multispeaker environment. Furthermore, we show a significant correlation between our EEG-based measure of attention and performance on a high-level attention task. In addition, by attempting to decode attention at individual latencies, we identify neural processing at ∼200 ms as being critical for solving the cocktail party problem. These findings open up new avenues for studying the ongoing dynamics of cognition using EEG and for developing effective and natural brain–computer interfaces.
Keywords: attention, BCI, cocktail party, EEG, speech, stimulus-reconstruction
Introduction
Since its first behavioral description (Cherry 1953), researchers have sought to identify the neural underpinnings of the cocktail party problem; that is, our ability to easily attend to one speaker in a multispeaker environment. Recent research in this area has focused on changes in cortical activity that track the dynamic changes in the speech stimulus (Kerlin et al. 2010; Ding and Simon 2012a; Koskinen et al. 2012; Mesgarani and Chang 2012; Power et al. 2012; Zion Golumbic et al. 2013). For example, by assuming a forward mapping from the amplitude envelope of speech to EEG, it has been shown to be possible to derive separate linear impulse response measures to each of 2 concurrent speech streams, and that directing attention to one of these streams produces modulations of these impulse responses over the left hemisphere at a latency of ∼200 ms (Power et al. 2012). While these effects suggest that selective attention operates at the level of semantic processing, they are only discernible after averaging over many trials and subjects, a lack of sensitivity that is not atypical of EEG-based cognitive neuroscience studies.
Several recent studies have used recorded cortical population data to estimate the input stimulus using a mapping approach in the reverse direction (i.e., from the neural data back to the stimulus) (Rieke et al. 1995; Stanley et al. 1999; Mesgarani et al. 2009; Pasley et al. 2012; Zion Golumbic et al. 2013). This stimulus-reconstruction approach has been shown to be exquisitely sensitive to selective attention in a multispeaker environment (Ding and Simon 2012a, 2012b; Zion Golumbic et al. 2013). For example, one such study showed that reconstructed speech spectrograms from cortical surface responses to a mixture of speakers were dominated by the salient spectral and temporal features of the attended speaker, and were only weakly correlated with the unattended speaker (Mesgarani and Chang 2012). While this is an important insight into how the cortical representation of speech gives rise to a perception relevant for the listener's intended goal, invasive recording is only possible with human listeners undergoing clinical treatments, and as such is not suitable for many populations in which we would like to study selective attention to speech. Furthermore, the relatively local nature of surface recordings may not be optimal for assessing how attentional selection to speech operates along the entire auditory processing hierarchy (Power et al. 2012).
Using magnetoencephalography (MEG), which is a more global measure of cortical activity, Ding and Simon (2012a) showed that responses to a single-trial speech mixture could be decoded to give an estimate of the envelope of the input speech stream, and that this estimate typically had a greater correlation with the attended speech than the unattended. While this is a powerful and important result, the cost, lack of portability, and relative rarity of MEG recording facilities make population-specific research somewhat difficult. Thus, it would be extremely useful if such a decoding approach could be used with EEG data. This technology is cheaper, more widely accessible, easier to use in many specific cohorts, and can be integrated into everyday devices, making it a realistic option for brain–computer interface (BCI) applications. In addition, EEG is sensitive to both tangential and radial components of cortical current sources, while MEG is sensitive only to tangential components. This suggests that EEG may be sensitive to important aspects of electromagnetic brain activity that may not be well captured by MEG. For example, EEG exhibits many attention-related components that are not clearly detected with MEG (Näätänen 1992; Kahkonen et al. 2001).
Here we show for the first time that selective attention in a multispeaker environment can be decoded using unaveraged single-trial EEG. Moreover, we show that the strength of the attended speech representation in the EEG is correlated with subjects' performance on a high-level cocktail party task.
Materials and Methods
Participants
Forty human subjects took part (mean ± standard deviation (SD) age, 27.3 ± 3.2 years; 32 male; 7 left-handed). The experiment was undertaken in accordance with the Declaration of Helsinki. The Ethics Committees of the Nathan Kline Institute and the School of Psychology at Trinity College Dublin approved the experimental procedures and each subject provided written informed consent. Subjects reported no history of hearing impairment or neurological disorder. These data have been published previously using a different analysis approach (Power et al. 2012).
Stimuli and Procedures
Subjects undertook 30 trials, each of ∼1 min in length, where they were presented with 2 classic works of fiction: one to the left ear, and the other to the right ear. Each story was read by a different male speaker. Subjects were divided into 2 groups of 20 with each group instructed to attend to the story in either the left or right ear throughout all 30 trials. After each trial, subjects were required to answer between 4 and 6 multiple-choice questions on both stories. Each question had 4 possible answers. (See Supplementary Fig. 1 for examples of the types of questions asked). We used a between-subjects design as we wanted each subject to follow just one story to make the experiment as natural as possible and because we wished to avoid any repeated presentation of stimuli. For both stories, each trial began where the story ended on the previous trial. Stimulus amplitudes in each audio stream within each trial were normalized to have the same root mean squared (RMS) intensity. In order to minimize the possibility of the unattended stream capturing the subjects' attention during silent periods in the attended stream, silent gaps exceeding 0.5 s were truncated to 0.5 s in duration. Stimuli were presented using Sennheiser HD650 headphones and Presentation software from Neurobehavioral Systems (http://www.neurobs.com). Subjects were instructed to maintain visual fixation for the duration of each trial on a crosshair centered on the screen, and to minimize eye blinking and all other motor activities.
Data Acquisition and Preprocessing
Electroencephalography data were recorded for 34 of the subjects using 128 electrode positions (17 of these subjects attended to the speech on the left and the remaining 17 to the right). Data for the remaining 6 participants were collected using 160 electrode positions (3 of these subjects attended to the left and the remaining 3 to the right). These data were then remapped to an equivalent 128 electrode positions using an interpolated spline function. The data were filtered over the range 0–134 Hz and digitized at the rate of 512 Hz using a BioSemi Active Two system. Data were referenced to the average of all scalp channels.
In order to decrease the processing time required, all EEG data were downsampled by a factor of 8 to give an equivalent sampling rate of 64 Hz, after applying a zero phase-shift antialiasing filter. The amplitude envelopes of the speech signals were obtained using a Hilbert transform, and then downsampled to the same sampling rate of 64 Hz to allow us to relate their dynamics to those of the EEG.
Because envelope frequencies between 2 and 8 Hz are linearly relatable to the EEG (Pasley et al. 2012; Zion Golumbic et al. 2013), the EEG data were digitally filtered offline with a band-pass filter between 2 and 8 Hz, and the speech envelopes were low-pass filtered below 8 Hz.
Stimulus-Reconstruction
We wished to determine how accurately we could estimate to which of the 2 speakers each subject was attending based on a single trial (∼60 s) of EEG data. Our strategy for this was centered on the approach of stimulus-reconstruction. This approach attempts to reconstruct an estimate of the input stimulus S using recorded neural data R via a linear reconstruction model g. For a set of N electrodes, we represent the response of electrode n at time t = 1 … T as R(t,n). The reconstruction model, g(τ, n), is a function that maps R(t,n) to stimulus S(t) as follows:
| (1) |
where Ŝ denotes the estimated stimulus. The function g is estimated by minimizing the mean-squared error between the actual and reconstructed stimulus
Solving this analytically results in calculation of the normalized reverse correlation (Bialek et al. 1991; Stanley et al. 1999)
| (2) |
where and are the auto-correlation of the EEG data, and the cross-correlation of the stimulus and EEG data, across all electrodes and time-lags, respectively,
and R and S are defined as
and
The matrix R is only padded with zeros on the left to ensure causality. Because of the stochastic nature of the neural responses, the autocorrelation of the neural responses is full rank and easily invertible.
In our case, we used all 128 channels of EEG data. Because previous research indicates that EEG activity reflects the dynamics of the speech envelope at latencies up to 250 ms poststimulus (Lalor and Foxe 2010), we initially attempted to maximize the accuracy of our speech reconstruction using EEG at time-lags τ from 0 to 250 ms poststimulus. As we calculated a mapping from the neural data back to the stimulus, in practice we used time-lags from −250 to 0 ms.
For illustrative purposes, if the number of electrodes N = 2, and the response of electrode 1 at time t = 1 … T is defined as r1(t), and the range of time-lags τ spans from −2 to 0, then
Each decoder g is essentially a multivariate impulse response function calculated from all 128 electrodes and all time-lags simultaneously. Stimulus-reconstruction is therefore performed by convolving this impulse response with the EEG data.
As there were 2 simultaneous input speech streams (attended and unattended), we trained 2 decoders for each trial: one where linear-regression was performed between the EEG data and the attended stream alone, and another where linear-regression was performed between the EEG data and the unattended stream alone. We refer to these as Attended and Unattended decoders, respectively. As each subject undertook 30 trials, this resulted in 60 decoders for each subject (30 Attended and 30 Unattended).
For each reconstruction, we evaluated the reconstruction-accuracy by determining a correlation coefficient (Pearson's r) between the reconstructed speech envelope and the actual attended and unattended speech envelope, which we will refer to as rattended and runattended, respectively (Fig. 1).
Figure 1.

Illustration of the decoding strategy. Data from all electrode channels are decoded simultaneously to give an estimate of the amplitude envelope of the input speech stream. The correlation between this reconstruction and both the attended and unattended speech streams is then calculated for each trial.
Previous research (Ding and Simon 2012a) has shown that attended and unattended speech can be extracted separately from neural data, implying that it is not just the case that attended speech is more strongly represented by the same neural generators. Therefore, in order to ascertain the direction of attention for each subject, we had 2 choices:
We could use the Attended decoders in order to estimate which story the subject was attending to.
We could use the Unattended decoders in order to estimate which story the subject was not attending to.
When using the Attended decoders to reconstruct an estimate of the input stimulus, we would consider a trial to be correctly decoded if the reconstruction had a greater correlation with the attended stream (i.e., if rattended > runattended). Similarly, when using the Unattended decoders, we would consider a trial to be correctly decoded if the reconstruction had a greater correlation with the unattended stream (i.e., if runattended > rattended). The percentage of trials where we correctly decoded attentional-selection will hereafter be referred to as decoding-accuracy. We then employed these decoders in 2 different ways to reconstruct the input speech stream for each trial. We discuss these 2 approaches in turn.
Decoding Attention
First, we decoded the attention of each subject using the decoders that were trained on their own data. We refer to this as the Subject-Specific decoding method. As each decoder g is a 2-dimensional matrix (electrode channels × time-lags) representing a multivariate impulse resonse function, we can combine decoders from multiple trials by simply averaging these matrices together. We will refer to the numerical values of these matrices as the parameters of the decoders. For training and validation, a leave-one-out cross-validation approach was used, whereby each trial was decoded using the averaged parameters of the decoders trained on every other trial (i.e., 29 min of training data, and 1 min of test data).
Secondly, we were concerned that our Subject-Specific decoding approach may have been biased as the decoders were trained on data where subjects were always attending to the same ear, and to the same speaker. Therefore, for our second approach, we sought to avoid any such potential bias by adopting a Grand-Average decoding method. That is, for each subject, we decoded each trial using the averaged parameters of the decoders trained on every other subject and every other trial (leave-one-out cross-validation). Importantly, as there were 40 subjects in total, this method utilized 20 decoders that were trained on the opposite ear as the subject being decoded, and only 19 decoders that were trained on the same ear, thus limiting any potential direction-of-attention bias.
For both the Subject-Specific and Grand-Average decoding methods, it is important to clarify that we used the Attended decoders in order to estimate which story the subject was attending to, and the Unattended decoders in order to estimate which story the subject was not attending to.
Reconstruction-Accuracy and Decoding-Accuracy at Individual Time-Lags
As mentioned above, we trained the decoders on EEG data across a broad interval of time-lags from 0 to 250 ms simultaneously in an attempt to optimally reconstruct the input speech envelopes. However, our previously published analysis of the same data has indicated that attentional effects on a dichotic cocktail party experiment are most prominent specifically from ∼170 to 250 ms poststimulus (Power et al. 2012). This suggested that we might improve decoding accuracy by focusing on a more specific interval of time-lags. To investigate this, we trained decoders on EEG data at individual time-lags, rather than across a range of time-lags simultaneously.
For illustrative purposes, if the number of electrodes N = 2, and the response of electrode 1 at time t = 1 … T is defined as (t), and we want to calculate a decoder at a time-lag of ∼50 ms poststimulus, then at a sampling rate of 64 Hz, this equates to a time-lag of 3 samples. Therefore, the response matrix R becomes:
The decoder g is then calculated in the same way as before:
where S is the input stimulus envelope.
In our case, we evaluated decoders at time-lags ranging from 0 to 400 ms poststimulus. Therefore, at a sampling rate of 64 Hz, this resulted in 26 individual time-lag decoders separated by intervals of 15.6 ms.
Spatiotemporal Analysis of Decoders
In order to investigate which electrode channels contributed most to our decoding-accuracy, we examined the average decoder weightings at each individual time-lag. These individual time-lag decoders can essentially be considered as spatial filters that optimally map the channel data (at a particular lag) to the stimulus.
Correlation with Behavior
We wished to determine if there was any correlation between how well a subject performed at answering questions to the attended story and how well we could reconstruct the attended stimulus. We hypothesized that the reconstruction-accuracy would show a correlation with behavioral performance across subjects and across single trials. Initially, we performed this analysis using reconstructions based on the interval of time-lags from 0 to 250 ms.
We first assessed the correlation between the percentage of questions answered correctly for each trial (∼1200 trials in total), and the rattended obtained for each trial using the Attended decoders. We will refer to this as our Across Trials Reconstruction-Accuracy Test.
Next, we calculated the mean rattended across trials for each subject, and the percentage of questions answered correctly in total for each subject. We refer to this as our Across Subjects Reconstruction-Accuracy Test.
It should be noted that one subject was excluded from these analyses as the percentage of questions they answered correctly was almost 3 SDs below the mean (Z = −2.84), while no other subject performed >1.56 SDs below the mean.
Correlation with Behavior at Individual Time-Lags
As with our decoding-accuracy, we wanted to see if the correlations with behavior were specific to the 170–250 ms range. To do this, we used the r-values obtained from the decoders trained at individual time-lags (as described before), and assessed any correlation with behavior using the abovementioned tests. Specifically, we looked at rattended for both the Attended and Unattended decoders.
Effect of Trial Duration
Finally we wanted to see how the duration of the test data affected the decoding accuracy. To do this, we used the Attended Subject-Specific decoders with time-lags from 0 to 250 ms, while using progressively shorter durations of test data from each trial.
Results
Behavioural Results
As reported previously (Power et al. 2012), our behavioral results clearly showed that subjects were compliant in the task. On average, subjects correctly answered 80.4 ± 7.3% of questions on the attended story and 27.1 ± 7.0% on the unattended story, which was not statistically greater than chance (P = 0.77). This is in line with previous reports on dichotic listening behavior, which show that it is not possible to listen to, and remember, 2 concurrent speech streams (Cherry 1953). Consistent with this, a 2 × 2 ANOVA with factors of story (left ear/right ear) and attention (attended/unattended) revealed a significant main effect of attention (F = 1164.13, P < 0.001), no effect of story (F = 3.08, P = 0.084) and no story × attention interaction (F = 2.15, P = 0.147). Individual subject performance is given in Supplementary Figure 2.
Decoding Accuracy
1) Using the Subject-Specific decoding method, 39 of the 40 subjects had a decoding-accuracy significantly above chance, and 7 subjects had a decoding-accuracy of 100% (mean 89%; Fig. 2A). For the Unattended decoders, 37 subjects had a decoding-accuracy significantly above chance, with one subject being decoded with 100% accuracy (mean 78.9%; Fig. 2A). The significant level of decoding-accuracy (63.33%) was determined using a binomial test at the 5% significance level.
Figure 2.

Decoding-accuracy and reconstruction-accuracy across all trials and all subjects. (A) Decoding-accuracy for the Attended decoders (black), and the Unattended decoders (gray) using the Subject-Specific decoding method and (B) the Grand-Average decoding method. Subjects are sorted according to the performance of their Attended decoder. The solid line indicates the classification performance level at which decoding-accuracy is significantly greater than chance (63.33%) based on a binomial test at the 5% significance level. (C) Across all trials and all subjects, rattended is plotted against runattended for the Attended (black) and Unattended (gray) Subject-Specific decoders. (D) The same information when using the Grand-Average decoders.
2) Using the Grand-Average decoding method, the Attended decoders yielded a decoding-accuracy significantly greater than chance for 36 of the 40 subjects, with 100% accuracy for 5 subjects (mean 82%; Fig. 2B). For the Unattended decoders, 32 of the 40 subjects had a decoding-accuracy significantly greater than chance, with 100% accuracy for one subject (mean 75%; Fig. 2B). For the Attended decoders, the decoding-accuracy of the Subject-Specific approach was slightly, but significantly greater than that of the Grand-Average approach (P = 0.003, paired t-test). There was no significant difference between the Subject-Specific and Grand-Average decoding-accuracy for the Unattended decoders (P = 0.103).
Scatter plots showing rattended and runattended for all subjects and all trials using the Attended and Unattended decoders for both the Subject-Specific and Grand-Average decoding methods are shown in Figure 2C,D, respectively. The plots show that when using the Attended decoders, rattended is typically greater than runattended for both the Subject-Specific (median r = 0.054 and −0.005, respectively) and Grand-Average (median r = 0.038 and −0.007, respectively) decoding methods. Conversely, when using the Unattended decoders, runattended is typically greater than rattended for both the Subject-Specific (median r = 0.032 and −0.006, respectively), and Grand-Average decoding methods (median r = 0.026 and −0.012, respectively).
Reconstruction-Accuracy and Decoding-Accuracy at Individual Time-Lags
Although using individual time-lags reduced both the reconstruction-accuracy and the decoding-accuracy achievable, a clear pattern emerged indicating which time-lags are most important when determining attentional-selection for both the Subject-Specific and Grand-Average decoding methods (Fig. 3A,B). Using the Attended decoders, the reconstruction-accuracy for the attended speech stream (rattended) was found to be largest at time-lags between 170 and 250 ms, with a peak at ∼218 ms. Conversely, runattended was smallest during this time frame, with a negative peak at ∼203 ms. Consequently, decoding-accuracy was at a maximum between 170 and 250 ms for the Attended decoders, with a peak at ∼203 ms (Fig. 3C,D). A similar pattern emerged for the Unattended decoders, thus yielding a decoding-accuracy that was also maximal during the same time-interval (Fig. 3C,D).
Figure 3.

Reconstruction-Accuracy and Decoding-Accuracy across all time-lags. (A) Reconstruction-Accuracy for the Subject-Specific decoding method across individual time-lags from 0 to 400 ms for the Attended decoders (black) and the Unattended decoders (gray). (B) The same analysis for the Grand-Average decoding method. (C) Decoding-Accuracy for the Subject-Specific decoding method. (D) Decoding-Accuracy for the Grand-Average decoding method.
As a result of these individual time-lag results, we trained decoders using a narrow interval of time-lags from 170 to 250 ms (instead of the broad 0 to 250-ms-interval used earlier). While, as expected, the mean reconstruction-accuracy dropped significantly for the Subject-Specific and Grand-Average decoding methods (P = 0.0015 and P = 0.013, respectively; paired t-test), using these narrower time-lags produced an increase in decoding-accuracy for all methods. However, this increase was only significant for the Grand-Average decoding method (Attended P = 0.02, Unattended P = 0.004, paired t-test; Table 1). As was the case with the broader (0 to 250 ms) time interval used earlier, the Subject-Specific approach led to a small, but significantly greater decoding-accuracy than the Grand-Average approach for the Attended decoders (P = 0.0117), with no difference for the Unattended decoders (P = 0.3139).
Table 1.
Comparison of decoding-accuracy across time-lags and decoding methods
| 0–250 ms |
170–250 ms |
|||
|---|---|---|---|---|
| Attended (%) | Unattended (%) | Attended (%) | Unattended (%) | |
| Subject-Specific | 89.0a | 78.9 | 89.4a | 80.8 |
| Grand Average | 81.8 | 75.4 | 83.9b | 79.1b |
Note: The decoding-accruacy achieved when using broad time-lags from 0 to 250 ms, versus narrow time-lags from 170 to 250 ms.
aA significant increase (P < 0.05) in decoding-accuracy for the Subject-Specific decoding method compared with the Grand-Average decoding method.
bA significant increase (P < 0.05) in decoding-accuracy when using the narrower time-lags.
Spatiotemporal Analysis of Decoders
Figure 4 shows how the filter weights are distributed across the scalp for selected individual time-lags. While there is no obvious spatial pattern at lags of 100 and 150 ms, a clear pattern is evident at 200 and 250 ms. This pattern includes 2 bilateral foci of stronger weightings over temporal regions, with the weightings in these regions being inverted for the Unattended decoders relative to the Attended decoders. We take this highly structured pattern of decoder weights to support our claim that 200 ms represents an important locus of attention as opposed to being simply the locus of maximal decoding-accuracy produced by an exhaustive search across individual time-lags. This is especially true as the location of strongest decoder weights is over scalp regions indicative of auditory cortical activity. In addition, these patterns help to explain the pattern of reconstruction-accuracy results observed in Figure 3 (e.g., rattended for the Attended decoder is inverted relative to rattended for the Unattended decoder—circle symbols in Fig. 3B).
Figure 4.
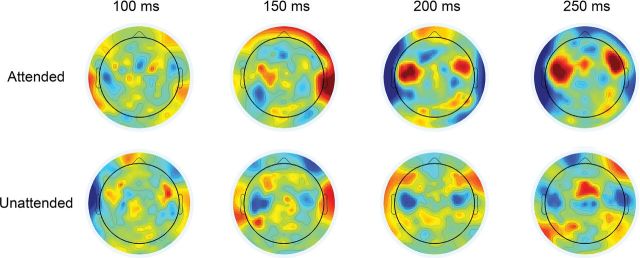
Topography of the decoder weights averaged over all subjects. Decoders were trained at individual time-lags, where the distribution of spatial filter weights across the scalp can be displayed as a topographic map.
Correlation with Behaviour
For the Across Trials Reconstruction-Accuracy test, we found a significant correlation with behavioral performance for both the Subject-Specific (r = 0.07, P = 0.017) and Grand-Average decoding methods (r = 0.08, P = 0.005). For the Across Subjects Reconstruction-Accuracy test, we found a significant correlation for the Grand-Average decoding method (r = 0.32, P = 0.05), but no significant correlation for the Subject-Specific decoding method (r = 0.12, P = 0.45). It is possible that the differing results for the Across Subjects (∼40 data points) and Across Trials (∼1200 data points) tests for the Subject-Specific decoding method may simply be an issue of statistical power. However, we suspect that the lack of any correlation in our Across Subjects test may have been driven by large inter-subject variations in reconstruction-accuracy (i.e., rattended) that may be independent of attention. It is almost certain that the strength at which the speech envelope is represented in the scalp EEG relates to several subject-specific factors, such as cortical folding, skull thickness, etc. Therefore, it is not unlikely that 2 subjects with similar behavioral performance would differ in their mean rattended values. With this in mind, we tested the hypothesis that good behavioral performance follows as a result of a subject being able to consistently sustain their attentional deployment, and that this consistency should be measurable in terms of a consistent difference between the accuracies with which we can reconstruct the attended and unattended streams (rattended − runattended), no matter what the absolute reconstruction-accuracy values. That is, the more consistent (i.e., lower variance) the reconstruction differences, the better a subject should have done on the questions. We will refer to this as as our Across Subjects Reconstruction-Consistency Test. Using this test, we found a significant correlation for the Attended Subject-Specific decoding method (r = −0.39, P = 0.01), but no significant correlation for for the Grand-Average decoding method (r = −0.08, P = 0.62).
Correlation with Behavior at Individual Time-Lags
As with our broad time-lags, we also found correlations with behavior at individual time-lags (Fig. 5). Correlations for the Attended decoders are shown in black, and the Unattended decoders are shown in gray. Significant correlations (P < 0.05) are indicated by filled circles. Most of the significant correlations occur at time-lags from 200 to 250 ms, with some occuring at lags 100 to 150 ms. Similar patterns can be observed for both the Across Subjects and Across Trials Reconstruction-Accuracy tests (both for Subject-Specific and Grand-Average methods) with the Attended and Unattended decoders producing correlations that are almost perfectly out of phase with one another and that are maximally different at ∼200–250 ms. This is not hugely surprising given the inverted spatial patterns observed in our decoder weightings (Fig. 4). As with the broad interval (0–250 ms) based analysis, the Across Subjects Reconstruction-Accuracy test was not found to be significant for the Subject-Specific approach, but the same time interval was revealed as important in the Across Subjects Reconstruction-Consistency Test.
Figure 5.

Correlation with behavior at Individual Time-Lags. Correlation between reconstruction-accuracy and behavioral performance across individual time-lags from 0 to 400 ms. The Attended decoders are shown in black, and the Unattended decoders are shown in gray. Large markers indicate significance (P < 0.05). Test 1 is the Across Trials Reconstruction-Accuracy Test, and assesses the correlation between the percentage of questions answered correctly on each trial, and the r-value obtained for each trial. Test 2 is the Across Subjects Reconstruction-Accuracy Test, and assesses the correlation between the percentage of questions answered correctly in total, and the mean r-value obtained for each subject. Test 3 is the Across Subjects Reconstruction-Consistency Test, where we assess the correlation between the variance of the difference between rattended and runattended, and the percentage of questions answered correctly in total.
Effect of Trial Duration
As expected, decoding-accuracy dropped as the test data duration decreased. However, even with just 10 s of test data, attention was correctly decoded significantly above chance for 30 of the 40 subjects (mean decoding-accuracy 68.6%, min 50%, max 86.7%; Supplementary Fig. 4).
Discussion
Using electroencephalography (EEG) to accurately characterize sensory activity on a single-trial basis has traditionally been extremely difficult due to the very large relative amplitude of the background EEG. The most widely used EEG-based method for analyzing auditory processing has been the Auditory Evoked Potential (AEP) technique, which focuses on the response evoked by the onsets of discrete stimuli, typically averaging the resulting responses over many trials to achieve a good signal-to-noise ratio (Picton and Hillyard 1974; Picton et al. 1974). More recently, regression methods have been used to quantify a mapping between continuous auditory stimuli and the resulting neural data (Kerlin et al. 2010; Lalor and Foxe 2010; Ding and Simon 2012a, 2012b; Koskinen et al. 2012; Mesgarani and Chang 2012; Power et al. 2012). Here, we used such an approach to reconstruct the input stimulus in an attempt to estimate attentional-selection in a multispeaker environment. Despite the fact that we used unaveraged EEG, and did not correct for muscle or blink artifacts, we were able to classify attention accurately on a single-trial basis. Moreover, we showed correlations between behavior and both the accuracy and consistency of our EEG-based stimulus reconstructions. Finally, we showed that correlations between behavior and reconstruction-accuracy were maximal during a timeframe of ∼200–250 ms poststimulus, results that provide support for the importance of a late locus of attention in solving the cocktail party problem.
Decoding Accuracy
We achieved a decoding accuracy of 82%–89%, which is comparable to that achieved in related work. For example, another recent study using stimulus-reconstruction to decode attention in a 2-speaker environment has reported an accuracy of up to 92% based on single-trial (1 min) MEG data (Ding and Simon 2012a). A direct comparison is difficult given that MEG and EEG are sensitive to different aspects of electromagnetic activity. Also, in that study, subjects were presented with the same stimuli 3 times, so that much of the background activity could be averaged out across trials. Moreover, the 2 speakers were of opposite sex, which may have led to greater separability of the neural activity to each stream based on inherent differences in the spectral characteristics of male and female speakers. Given these methodological differences, it is striking how similar our EEG results are to this previous result. This similarity is especially encouraging given that EEG is relatively low-cost, easy to use, and portable.
There has been other work that has attempted to use EEG to decode selective attention in a complex auditory environment. One recent study (Choi et al. 2013) shows that single-trial (∼3 s) AEP data can be used to classify the direction of attention in response to competing streams made of musical notes, achieving an accuracy of ∼65–70%. Another study modeled the degree of gamma band synchronization between stimuli and neural activity allowing them to distinguish attention to speech versus music with an average accuracy of 69% (Looney et al. 2010). Our decoding accuracies compare extremely well with these previous reports, especially given the naturalistic, speech-specific nature of our stimuli and task, albeit with single-trials of somewhat longer duration.
Reconstruction-Accuracy and Decoding-Accuracy at Individual Time-Lags
By examining stimulus-reconstruction using decoders based on individual time-lags we have shown that the interval of 170–250 ms is of paramount importance for decoding attention to speech. As mentioned above, this finding provides support for the existence of an important late locus of attention in solving the cocktail party problem. We have advanced this idea before with our previous paper speculating that effects at such latencies may represent a filtering process operating at the level of semantic analysis (Power et al. 2012), a speculation that fits with theories of a multistage process underpinning selective attention to speech (Treisman 1964). This notion is further supported by recent research using electrocorticography (ECoG) recordings that found significant differences in the strength of attentional effects on the representation of speech in different parts of auditory cortex (Mesgarani and Chang 2012; Zion Golumbic et al. 2013). Indeed, the fact that attention may differentially affect processing at distinct stages of the auditory processing hierarchy could be exploited to further improve the accuracy of the decoding of selective attention to speech using single-trial EEG data. While EEG captures a more global measure of neural activity than ECoG, including that of the entire auditory processing hierarchy, it should be possible to improve decoding performance by basing stimulus reconstructions on estimated source activity from ‘higher order’ auditory regions where attentional modulation is particularly strong. As we have used the recorded scalp EEG data directly, the unattended speech is likely strongly represented in our data. This is evident from the success of our Unattended decoders, and is in line with previous EEG and MEG research (Kerlin et al. 2010; Ding and Simon 2012b; Mesgarani and Chang 2012; Power et al. 2012).
While we have discussed the importance of processing at ∼200 ms for solving the cocktail party problem, it is important to note that many dichotic speech studies have shown much earlier effects using the averaged ERP method (e.g., (Hink and Hillyard 1976; Woods et al. 1984; Teder et al. 1993). As discussed previously (Power et al. 2012), the discrepancy between our results and these earlier studies may be due to this study's explicit assumption of a relationship between the EEG and the speech envelope. This might render our method insensitive to earlier attention effects (e.g., those based on space or frequency), which may be indexed by endogenous potentials that are more easily captured by averaged ERPs. That said, we suggest that it is highly unlikely that such early effects would correlate with our high-level behavioral measures, although this needs to be tested in future work.
Subject-Specific and Grand-Average Decoding Methods
We performed decoding using 2 approaches: Subject-Specific and Grand-Average. Both of these methods produced high decoding accuracies (Fig. 2) and similar patterns of decoding-accuracy and reconstruction-accuracy across time (Fig. 3). The fact that the Attended Subject-Specific decoding method outperformed the Attended Grand-Average decoding method may be due to inter-subject differences in how attended speech is represented in the EEG and/or to the aforementioned possibility that the Subject-Specific decoders might be slightly biased as a result of how we administered the task. The lack of any qualitative difference between the performances of the Attended Subject-Specific and Grand-Average decoders, combined with the fact that there was no quantitative difference for the Unattended decoders, lessens the immediate relevance of this issue. Future work should build more balance into the task design, possibly by training decoders on single-speaker speech prior to attentional decoding.
Spatiotemporal Analysis of Decoders
When comparing Attended and Unattended decoders, the inverted patterns of spatial filter weights at 200 and 250 ms (Fig. 4) was noteworthy. This was not a trivial finding given that the Attended and Unattended decoders were separately trained on the (independent) attended and unattended speech streams, respectively. We contend that these patterns provide further support for a locus of selective attention to speech operating at a specific level of the auditory processing hierarchy. Within this context, the foci of positive/negative spatial weights for the Attended/Unattended decoders reflect the relative enhancement/suppression of the attended and unattended speech at a particular level of processing. Given the relatively long latency at which these patterns become apparent, we postulate, as we have done before (Power et al. 2012), that this locus operates at a level where the content of unattended speech is suppressed and prevented from being encoded into working memory. These inverted patterns of spatial filter weights explain the related inverted patterns of reconstruction-accuracy (Fig. 3A,B) and behavioral correlations (Fig. 5A,B) reported above.
In our previous analysis of the same data (Power et al. 2012), we found a left-lateralized attention effect at ∼200 ms for those subjects who attended to their right ear, and a more bilateral distribution for those subjects who attended to their left ear. Therefore, it is somewhat surprising that we observed no obvious lateralization of weights in Figure 4. Analyzing the data separately for subjects attending to speech in their left and right ears provides some reconciliation. Spatial filter weights for those subjects attending their right ear were left lateralized whereas the weights for those attending their left ear were more bilaterally distributed (Supplementary Fig. S3).
Having made the point that the spatial filter weights (at least the foci at ∼200 ms) imply relative suppression of the unattended stream, it is important to recall that we have been able to reconstruct the unattended speech stream from our data, even using individual time-lag decoders at 200 ms (Fig. 3A,B—gray triangles), although to a far lesser extent than the attended stream. This implies, unsurprisingly, that the pattern of weights in our Unattended decoders are more complex than we have been suggesting and that unattended speech remains robustly represented in the data at these time lags. These data suggest, as has been done before (Ding and Simon 2012a), that attended speech is not simply more strongly represented by the same neural generators, but rather that both speech streams are represented separately in the neural data. Therefore, if one was interested solely in obtaining the highest decoding-accuracy, for example, for a BCI application, one would simply use the Attended decoders to attempt to reconstruct the attended stream.
Correlation with Behavior
From the point of view of future research, perhaps the most exciting findings from our data are the correlations between our reconstruction measures and behavioral performance. We showed a correlation across trials between our reconstruction-accuracy and behavioral performance for both the Subject-Specific and Grand-Average decoding methods. This was very surprising given the high-level nature of our task. Indeed our behavioral measure will certainly have included a sizeable amount of random variation given the trial-to-trial variability in the difficulty of the questions, and the fact that the task was multiple-choice. This would partly explain our low r-values. Moreover, the stimulus-reconstruction method, as we have applied it, is only sensitive to the cortical activity that tracks the slow amplitude envelope of speech. While the envelope of speech is important for speech comprehension (Peelle and Davis 2012; Ghitza et al. 2013), it is not a direct measure of intelligibility. Even if it were, intelligibility and short-term memory performance are unlikely to perfectly correlate with each other. Future studies using different behavioral measures that more directly index the instantaneous deployment of attention would likely show an even stronger relationship between decoding-accuracy and behavioral performance. Recent MEG work showing that the strength of the auditory cortical representation of the envelope of speech (in noise) strongly correlates with intelligibility provides support for this supposition (Ding and Simon 2013).
Our Across Subjects Reconstruction-Accuracy Test was only significant for the Grand-Average method. As we have postulated above, the lack of a correlation for the Subject-Specific approach might be due to inter-subject variation in reconstruction accuracy independent of attention. This variation might not have affected the Grand-Average analysis because of the generic nature of the decoders used in that analysis. On the same point, we observed a double dissociation when we implemented the Across Subjects Reconstruction-Consistency Test. In this case, the Subject-Specific approach produced a significant correlation with behavior, but the Grand-Average approach did not. We postulate that the Subject-Specific correlation reflects the notion that good behavioral performance should follow from consistency in sustaining attention and that this consistency should be reflected in the variance of the reconstruction accuracy. Again the generic nature of the Grand-Average decoders may explain the discrepant results by removing any inter-subject differences in the variance of the reconstruction-accuracy.
Advantages and Disadvantages of the Stimulus-Reconstruction Approach
The advantage of the stimulus-reconstruction method over other approaches is in its ability to incorporate all the available information across the scalp at each point in time. It does this by weighting the relative contribution from each electrode simultaneously (Fig. 4) by finding a multivariate linear filter that incorporates the channel covariance structure in the estimation of the impulse response. This approach encourages irrelevant parameters to maintain zero weight, while allowing the model to capture additional variance using electrodes potentially excluded by feature selection approaches; as such, this method can result in a significant quantitative improvement in the input–output mapping (Hastie 2009; Pasley et al. 2012). As seen in supplementary Figure 4, even 10 s of data is enough to decode attention for a number of subjects. This allows the possibility of near real-time decoding of EEG. The speed with which this can be done suggests a possible role for this method in the future design of BCIs. With sufficient data and training, it is feasible that a decoder optimized for a particular subject could have enough sensitivity to accurately decode attention based on data epochs that are far shorter than 60 s. Such sensitivity could also lead to the widespread use of stimulus-reconstruction approaches in EEG paradigms aimed at monitoring the ongoing dynamics of cognition.
The stimulus-reconstruction method has a number of disadvantages however. Firstly, unlike forward-mapping approaches, it does not produce an interpretable impulse response function for each electrode separately. This precludes the use of analysis techniques that have long been used in the event-related potential (ERP) literature. For example, the analysis of the timing and amplitude of such impulse responses can provide detailed insights into the time course of perception and cognitive processes (Luck 2005). In addition such responses can be analyzed using inverse modeling approaches to estimate the spatial locations of their neural generators (Scherg and Berg 1996). Therefore, we see the stimulus-reconstruction approach as complementary to forward-mapping methods (Lalor and Foxe 2010). When used together these methods have the potential to provide a fuller understanding of human sensory, perceptual, and cognitive processes.
Supplementary Material
Supplementary Material can be found at http://www.cercor.oxfordjournals.org/ online.
Funding
This study was supported by a grant from Science Foundation Ireland (09-RFP-NES2382); United States National Science Foundation (BCS0642584); CELEST, a National Science Foundation Science of Learning Center (NSF SBE-0354378). Additional salary support was provided by the Irish Research Council for Science, Engineering & Technology.
Supplementary Material
Notes
The authors acknowledge the organizers of the 2012 NSF-funded Neuromorphic Cognition Engineering Workshop in Telluride, CO, USA, where much of this work was conceived. The authors thank Emma-Jane Forde for assistance with preparation of the stimuli and assistance with data collection. Conflict of Interest: None declared.
References
- Bialek W, Rieke F, Vansteveninck RRD, Warland D. 1991. Reading a neural code. Science. 252:1854–1857. [DOI] [PubMed] [Google Scholar]
- Cherry EC. 1953. Some experiments on the recognition of speech, with one and with two ears. J Acoust Soc Am. 25:975–979. [Google Scholar]
- Choi I, Rajaram S, Varghese L, Shinn-Cunningham B. 2013. Quantifying attentional modulation of auditory-evoked cortical responses from single-trial electroencephalography. Front Hum Neurosci. 7:115. [DOI] [PMC free article] [PubMed] [Google Scholar]
- Ding N, Simon JZ. 2012a. Emergence of neural encoding of auditory objects while listening to competing speakers. Proc Natl Acad Sci USA. 109:11854–11859. [DOI] [PMC free article] [PubMed] [Google Scholar]
- Ding N, Simon JZ. 2012b. Neural coding of continuous speech in auditory cortex during monaural and dichotic listening. J Neurophysiol. 107:78–89. [DOI] [PMC free article] [PubMed] [Google Scholar]
- Ding N, Simon JZ. 2013. Adaptive temporal encoding leads to a background-insensitive cortical representation of speech. J Neurosci. 33:5728–5735. [DOI] [PMC free article] [PubMed] [Google Scholar]
- Ghitza O, Giraud A-L, Poeppel D. 2013. Neuronal oscillations and speech perception: critical-band temporal envelopes are the essence. Front Hum Neurosci. 6:340. [DOI] [PMC free article] [PubMed] [Google Scholar]
- Hastie T, Friedman J. 2009. Elements of statistical learning. New York: (NY: ): Springer Science. [Google Scholar]
- Hink RF, Hillyard SA. 1976. Auditory evoked potentials during selective listening to dichotic speech messages. Percept Psychophys. 20:236–242. [Google Scholar]
- Kahkonen S, Ahveninen J, Jaaskelainen IP, Kaakkola S, Naatanen R, Huttunen J, Pekkonen E. 2001. Effects of haloperidol on selective attention a combined whole-head MEG and high-resolution EEG study. Neuropsychopharmacology. 25:498–504. [DOI] [PubMed] [Google Scholar]
- Kerlin JR, Shahin AJ, Miller LM. 2010. Attentional gain control of ongoing cortical speech representations in a “Cocktail Party”. J Neurosci. 30:620–628. [DOI] [PMC free article] [PubMed] [Google Scholar]
- Koskinen M, Viinikanoja J, Kurimo M, Klami A, Kaski S, Hari R. 2012. Identifying fragments of natural speech from the listener’s MEG signals. Hum Brain Mapp. 346:1477–1489. [DOI] [PMC free article] [PubMed] [Google Scholar]
- Lalor EC, Foxe JJ. 2010. Neural responses to uninterrupted natural speech can be extracted with precise temporal resolution. Eur J Neurosci. 31:189–193. [DOI] [PubMed] [Google Scholar]
- Looney D, Park C, Xia Y, Kidmose P, Ungstrup M, Mandic DP. 2010. Towards estimating selective auditory attention from EEG using a novel time–frequency-synchronisation framework. In: Proceedings of the 2010 International Joint Conference on Neural Networks (accepted). [Google Scholar]
- Luck SJ. 2005. An introduction to the event-related potential technique.
- Mesgarani N, Chang EF. 2012. Selective cortical representation of attended speaker in multi-talker speech perception. Nature. 485:233–U118. [DOI] [PMC free article] [PubMed] [Google Scholar]
- Mesgarani N, David SV, Fritz JB, Shamma SA. 2009. Influence of context and behavior on stimulus reconstruction from neural activity in primary auditory cortex. J Neurophysiol. 102:3329–3339. [DOI] [PMC free article] [PubMed] [Google Scholar]
- Näätanen R, Teder W, Alho K, Lavikainen J. 1992. Auditory attention and selective input modulation: a topographical ERP study. Neuroreport. 3.6:493–496. [DOI] [PubMed] [Google Scholar]
- Pasley BN, David SV, Mesgarani N, Flinker A, Shamma SA, Crone NE, Knight RT, Chang EF. 2012. Reconstructing speech from human auditory cortex. PLoS Biol. 101:e1001251, doi:10.1371/journal.pbio.1001251. [DOI] [PMC free article] [PubMed] [Google Scholar]
- Peelle JE, Davis MH. 2012. Neural oscillations carry speech rhythm through to comprehension. Front Psychol. 3, doi:10.3389/fpsyg.2012.00320. [DOI] [PMC free article] [PubMed] [Google Scholar]
- Picton TW, Hillyard SA. 1974. Human auditory evoked-potentials. 2. Effects of attention. Electroencephalogr Clin Neurophysiol. 36:191–199. [DOI] [PubMed] [Google Scholar]
- Picton TW, Hillyard SA, Krausz HI, Galambos R. 1974. Human auditory evoked-potentials.1. Evaluation of components. Electroencephalogr Clin Neurophysiol. 36:179–190. [DOI] [PubMed] [Google Scholar]
- Power AJ, Foxe JJ, Forde EJ, Reilly RB, Lalor EC. 2012. At what time is the cocktail party? A late locus of selective attention to natural speech. Eur J Neurosci. 35:1497–1503. [DOI] [PubMed] [Google Scholar]
- Rieke F, Bodnar DA, Bialek W. 1995. Naturalistic stimuli increase the rate and efficiency of information transmission by primary auditory afferents. Proc R Soc B. 262:259–265. [DOI] [PubMed] [Google Scholar]
- Scherg M, Berg P. 1996. New concepts of brain source imaging and localization. Electroencephalogr Clin Neurophysiol Suppl. 46:127. [PubMed] [Google Scholar]
- Stanley GB, Li FF, Dan Y. 1999. Reconstruction of natural scenes from ensemble responses in the lateral geniculate nucleus. J Neurosci. 19:8036–8042. [DOI] [PMC free article] [PubMed] [Google Scholar]
- Teder W, Kujala T, Näätänen R. 1993. Selection of speech messages in free-field listening. NeuroReport. 5:307–309. [DOI] [PubMed] [Google Scholar]
- Treisman AM. 1964. Verbal cues, language, and meaning in selective attention. Am J Psychol. 77:206–219. [PubMed] [Google Scholar]
- Woods D, Hillyard SA, Hansen J. 1984. Event-related brain potentials reveal similar attentional mechanisms during selective listening and shadowing. J Exp Psychol Hum Percept Perform. 10:761. [DOI] [PubMed] [Google Scholar]
- Zion Golumbic EM, Ding N, Bickel S, Lakatos P, Schevon CA, McKhann GM, Goodman RR, Emerson R, Mehta AD, Simon JZ. 2013. Mechanisms underlying selective neuronal tracking of attended speech at a ‘cocktail party’. Neuron. 77:980–991. [DOI] [PMC free article] [PubMed] [Google Scholar]
Associated Data
This section collects any data citations, data availability statements, or supplementary materials included in this article.