

Abstract
Fibroblast growth factor receptor 1 (FGFR1) is an oncoprotein with known involvement in mammary tumorigenesis. To understand how FGFR1 signaling promotes mammary tumorigenesis, an inducible FGFR1 (iFGFR1) system was created previously. Previous studies have demonstrated that upon iFGFR1 activation in vivo, the epidermal growth factor (EGF) ligands amphiregulin (AREG) and epiregulin (EREG) are upregulated. Both AREG and EREG interact with the EGF receptor (EGFR). Here, we investigated whether the FGFR1-induced increase in AREG and EREG expression might coordinately increase EGFR signaling to promote mammary tumorigenesis. Treatment of mouse mammary epithelial cells with either AREG or EREG conferred a greater migratory potential, increased cellular proliferation and increased extracellular regulated kinase 1/2 (ERK1/2) activation. These effects could be blocked with the EGFR-specific inhibitor erlotinib, suggesting that they are EGFR-dependent. In transgenic mice with iFGFR1 under the control of the mouse mammary tumor virus (MMTV) promoter, iFGFR1 activation also led to increased mammary epithelial cell proliferation that was inhibited with erlotinib. Taken together, these data suggest that AREG and EREG mediate tumorigenic phenotypes by activating EGFR signaling, and that the oncogenic potential of FGFR1 requires EGFR activation to promote mammary tumorigenesis.
Key words: EGFR, FGFR1, Breast cancer, Mammary tumor
Introduction
The fibroblast growth factor receptor (FGFR) family consists of four receptor tyrosine kinases that are known regulators of cellular processes, such as proliferation, migration, survival and angiogenesis (reviewed by Dailey et al., 2005; Eswarakumar et al., 2005; Ornitz, 2000; Presta et al., 2005). Anomalous expression or uncontrolled activation of these receptors or their ligands has been correlated with progression of various types of cancer, including breast cancer (Dickson et al., 2000; Grose and Dickson, 2005; Koziczak et al., 2004). Specifically, the chromosomal locus for FGFR1, 8p11-12, is aberrantly amplified in ~10% of patients diagnosed with breast cancer (Andre et al., 2009; Elbauomy Elsheikh et al., 2007; Gelsi-Boyer et al., 2005; Penault-Llorca et al., 1995). Patients who harbor an FGFR1 amplification do not respond well to current therapies and develop resistance to hormone-based therapies (Chin et al., 2006; Turner et al., 2010). Therefore, understanding the molecular mechanisms of how FGFR1 overexpression promotes tumorigenesis might provide insights into better targets for novel, more effective therapies.
Because of the lack of binding specificity among the FGF ligands and their receptors, it is difficult to specifically activate FGFR1. Therefore, an inducible FGFR1 (iFGFR1) system was previously engineered to mimic endogenous FGFR1 signaling (Welm et al., 2002). Because the extracellular ligand-binding domain was removed, dimerization and activation of iFGFR1 is stimulated not by FGF ligands but by the synthetic molecule AP20187 (AP). Binding of AP to iFGFR1 results in homodimerization and subsequent activation of the same signaling pathways as endogenous FGFR1. Extensive characterization of the iFGFR1 system in vitro revealed that, following AP treatment of mouse mammary epithelial cells expressing iFGFR1, there was an increase in cellular migration, proliferation and signaling through the extracellular regulated kinase 1/2 (ERK1/2, hereafter referred to as ERK) pathway, similar to endogenous FGFR1 activation (Welm et al., 2002; Xian et al., 2009; Xian et al., 2005). The inducible system was also analyzed in vivo. For these previous studies, a transgenic mouse line was created in which the iFGFR1 construct was placed under the control of the mouse mammary tumor virus (MMTV) promoter, thereby restricting iFGFR1 expression to mammary epithelial cells (Welm et al., 2002). In the study by Welm et al., MMTV-iFGFR1 transgenic animals develop neoplasias within as little as 3 days of AP treatment, which are characterized by aberrant budding of the mammary gland ductal epithelial cells due to increased cellular proliferation. Extended AP treatment leads to progressively more severe phenotypes, and by 4 weeks of iFGFR1 activation, the mammary glands of transgenic animals contain large locally invasive growths. These results verify that iFGFR1 activation promotes tumorigenic phenotypes both in vivo and in vitro. To identify mechanisms by which FGFR1 promotes tumorigenesis, previously published studies have described the results of microarray studies that were performed on mammary glands from MMTV-iFGFR1 transgenic mice following iFGFR1 activation (Schwertfeger et al., 2006). In the current study, we explore the ability of two targets identified in the screen, amphiregulin (AREG) and epiregulin (EREG), to promote FGFR1-induced mammary tumorigenesis.
AREG and EREG are both members of the epidermal growth factor (EGF) family of ligands (reviewed by Schneider and Wolf, 2009). These ligands are originally synthesized as transmembrane proteins and are thought to be cleaved from the plasma membrane by the ADAM17 (a disintegrin and metalloproteinase 17) sheddase (Brown et al., 1998; Plowman et al., 1990; Sahin et al., 2004; Sternlicht et al., 2005; Sunnarborg et al., 2002; Toyoda et al., 1995a; Toyoda et al., 1995b). Furthermore, both ligands are known activators of the EGF receptor (EGFR); AREG exclusively binds to and signals through EGFR (Shoyab et al., 1989), whereas EREG can also bind to and signal through ERBB4 (Komurasaki et al., 1997; Shelly et al., 1998). AREG is essential for normal ductal morphogenesis in the mammary gland (Ciarloni et al., 2007; Luetteke et al., 1999) and has also been linked to breast cancer progression (Kenney et al., 1996a; Kondapaka et al., 1997; Ma et al., 1999; Silvy et al., 2001). Studies examining AREG expression in human breast cancers have found AREG expression to significantly correlate with regional lymph node metastases, large tumor size and high-grade tumors (LeJeune et al., 1993; Ma et al., 2001; Qi et al., 1994). Although EREG promotes proliferation of several normal and cancerous cell types (Komurasaki et al., 2002; Shirakata et al., 2000; Toyoda et al., 1997; Zhu et al., 2000), the role of EREG has not been extensively characterized in the mammary gland. However, recent studies have demonstrated that EREG is a potent mediator of metastasis of breast cancer cells to the lung and that overexpression of EREG is an indicator of poor prognosis for inflammatory breast cancer patients (Bieche et al., 2004; Eltarhouny et al., 2008; Gupta et al., 2007).
EGFR, a member of the ERBB receptor tyrosine kinase family, has been well studied in numerous systems (reviewed by Alroy and Yarden, 1997; Mitsudomi and Yatabe, 2010). In the mammary gland, it is known that EGFR is required for normal mammary gland ductal morphogenesis (Wiesen et al., 1999; Xie et al., 1997). However, overexpression or constitutive activation of EGFR in the mammary gland has been linked to mammary tumorigenesis (Brandt et al., 2000; Cho et al., 2008; Moscatello et al., 1995). Additionally, overexpression of EGFR in the breast is associated with recurrence of earlier-stage breast cancers and decreased disease-free and overall survival in later-stage breast cancer patients (Fabian et al., 1994; Fox et al., 1994; Klijn et al., 1992; Rimawi et al., 2010; Torregrosa et al., 1997). Therefore, together with the fact that aberrant FGFR1 activation in the mammary gland leads to upregulation of the EGFR ligands AREG and EREG, these data strongly support a model in which aberrant FGFR1 signaling requires EGFR activation for mammary tumor formation, a link that has not been previously established. Moreover, the EGFR kinase inhibitor erlotinib is currently an approved therapeutic for both non-small cell lung cancer patients and advanced pancreatic cancer patients (reviewed by Gridelli et al., 2010; Squadroni and Fazio, 2010). However, erlotinib has not been fully tested as a functional therapy for breast cancer patients.
Our current studies focus on identifying downstream mediators of iFGFR1-induced mammary tumorigenesis. We found that treatment of HC11 mouse mammary epithelial cells with either AREG or EREG promotes increased migration, proliferation and ERK activation in vitro. Importantly, the ability of these ligands to stimulate migration and proliferation in vitro requires activation of EGFR, as inhibiting the EGFR kinase blocks these processes. We also show that inhibiting EGFR in vivo blocks iFGFR1-mediated cellular proliferation of mouse mammary epithelial cells. These studies demonstrate that activation of EGFR is important for effective FGFR1-induced mammary tumorigenesis. Because there are currently no FGFR1-specific drugs that are used clinically, our studies suggest that inhibition of EGFR might represent a useful strategy for targeting breast cancers harboring FGFR1 amplifications.
Results
Activation of iFGFR1 in the mouse mammary gland results in increased expression of AREG and EREG
Owing to the prevalence of human breast cancer patients harboring aberrant FGFR1 amplification, it is necessary to determine the downstream molecular effects of FGFR1-induced signaling pathways. In order to specifically study FGFR1 signaling, the iFGFR1 system previously engineered to mimic endogenous FGFR1 signaling was developed (Welm et al., 2002). Activation of iFGFR1, by treatment with AP, within the mammary epithelial cells of MMTV-iFGFR1 transgenic mice, results in the formation of hyperplastic lesions within 3 days, which progress to mammary tumors upon prolonged AP treatment. To identify new mediators of such FGFR1-induced tumorigenesis, previously published studies described the results of microarray studies that were performed on RNA isolated from the mammary glands of MMTV-iFGFR1 transgenic animals following AP stimulation (Schwertfeger et al., 2006). Of the numerous genes induced by iFGFR1, two EGF family ligands, Areg and Ereg, were significantly upregulated following iFGFR1 activation (Fig. 1A,B). Areg was significantly (P<0.05) induced within 8 hours of treatment, whereas Ereg was significantly (P<0.05) induced following 16 hours of treatment. To validate the increased expression of AREG and EREG, immunohistochemical analysis of MMTV-iFGFR1 mammary gland sections was performed. As shown in Fig. 1C, both AREG and EREG proteins were produced at elevated levels following iFGFR1 activation. These studies identify two new targets of FGFR1 activation in the mammary gland in vivo.
Fig. 1.
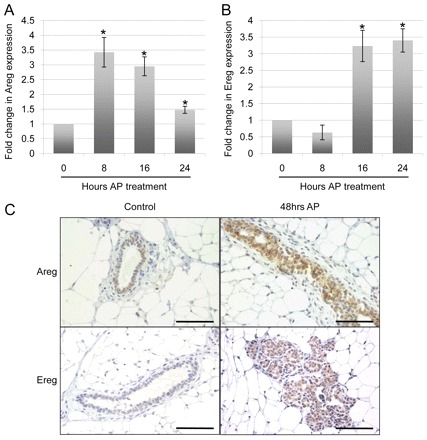
AREG and EREG are induced following FGFR1 activation in vivo. (A,B) MMTV-iFGFR1 animals were administered by intraperitoneal injections of 1 mg per kg of body weight AP for the times indicated. Following AP treatment, the animals were killed, and their fourth inguinal mammary glands were removed for either isolation of RNA or paraffin embedding and subsequent tissue analysis. An analysis of the data from previously published microarray experiments (Schwertfeger et al., 2006) demonstrates that Areg (A) and Ereg (B) were both significantly upregulated at the indicated timepoints. Error bars represent s.e.m. *P<0.05. (C) AREG and EREG detection by immunohistochemistry on mammary gland sections from either WT or MMTV-iFGFR1 mice treated with AP for 48 hours. Images are representative of at least three mice per treatment group. Scale bars: 50 μm.
Activation of iFGFR1 in HC11/R1 cells induces expression of AREG and EREG
We next determined whether iFGFR1 was capable of inducing Areg and Ereg in mouse mammary epithelial cells. For these studies, HC11/R1 cells, an immortalized non-transformed mammary epithelial cell line stably expressing iFGFR1, were used. Previous studies of HC11/R1 cells have demonstrated that activation of this receptor, through treatment with AP, promotes cell survival, proliferation, migration, invasion and epithelial-to-mesenchymal transition (EMT) (Welm et al., 2002; Xian et al., 2009; Xian et al., 2007; Xian et al., 2005). Quantitative reverse transcription PCR (qRT-PCR) was performed on RNA collected from HC11/R1 cells treated with AP for 0, 0.5, 1, 2 and 4 hours. As shown in Fig. 2A,B, both Areg and Ereg transcript levels increased following iFGFR1 activation in vitro. Areg transcript levels rapidly increased with AP treatment, peaking at 1 hour of AP treatment, and then decreased with prolonged AP treatment. Ereg transcript levels rose more slowly to peak at 2 hours after AP treatment and then, like Areg, decreased with continued AP treatment. These data are consistent with the in vivo analysis of Areg and Ereg transcripts, in that an increase in Areg mRNA is detectable earlier than an increase in Ereg mRNA, and demonstrate that Areg and Ereg are induced in mouse mammary epithelial cells following iFGFR1 activation.
Fig. 2.
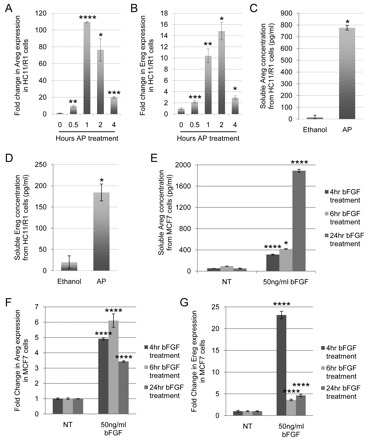
FGFR1 activation in mammary epithelial cells in vitro induces expression of AREG and EREG. (A,B) Mouse mammary epithelial HC11/R1 cells were treated with 30 nM AP for the indicated times. Following AP treatment, qRT-PCR analysis was performed on RNA isolated at each timepoint for both the Areg transcript (A) and the Ereg transcript (B), normalized to mouse cyclophilin B. Experiments were performed in biological triplicates. Error bars represent s.e.m. *P<0.05; **P<0.01; ***P<0.005; ****P<0.001. (C,D) To detect soluble AREG (C) and EREG (D) ligands, ELISAs were performed on conditioned HC11/R1 medium following treatment of cells with either 30 nM AP or its solvent, ethanol. Experiments were performed in biological triplicates. Error bars represent s.e.m. *P<0.05 (E) The conditioned medium of MCF7 human breast cancer cells treated with 50 ng/ml bFGF for 4, 6 or 24 hours were collected and soluble AREG was detected through an ELISA. Experiments were performed in biological triplicates. Error bars represent s.e.m. *P<0.05; ****P<0.001. (F,G) MCF7 cells were treated with 50 ng/ml bFGF for 4, 6 or 24 hours. Following bFGF treatment, qRT-PCR analysis was performed on RNA isolated at each timepoint for both AREG transcript (F) and EREG transcript (G), normalized to human cyclophilin B. NT, no treatment. Experiments were performed in biological triplicates. Error bars represent s.e.m. ****P<0.001.
To verify that Areg and Ereg transcripts are indeed translated into mature AREG and EREG proteins in vitro, AREG and EREG protein levels were quantified. Because it is known that EGF family ligands are shed from their membrane-bound precursors into the extracellular matrix (ECM) (Sahin et al., 2004; Sunnarborg et al., 2002), soluble AREG and EREG protein concentration was measured by ELISA from the conditioned medium of HC11/R1 cells treated overnight with either AP or its solvent, ethanol. Compared with the ethanol controls, HC11/R1 cells treated with AP had significantly (P<0.05) increased levels of soluble AREG and EREG (Fig. 2C,D). These data suggest that iFGFR1 activation induces both gene and protein expression of AREG and EREG.
AREG and EREG expression are upregulated following bFGF treatment in MCF7 cells
Further studies were performed to confirm that AREG and EREG are regulated by FGF signaling in another breast cancer model. The MCF7 human breast cancer cell line has been previously used to study mechanisms of FGF-induced tumorigenesis (Liu et al., 2002; Pond et al., 2010) and was used to verify that FGF treatment leads to increased expression of AREG and EREG. As shown in Fig. 2, qRT-PCR performed on RNA isolated from MCF7 cells treated with 50 ng/ml basic FGF (bFGF) for 4, 6 and 24 hours displayed a significantly (P<0.001) increased fold change in both AREG and EREG mRNA as compared with that in the no-treatment control samples (Fig. 2F,G). As in the mouse, human AREG and EREG are shed from the cell membrane. Thus, conditioned medium was collected to detect AREG protein levels through ELISA (Fig. 2E). Compared with the no-treatment control, 50 ng/ml bFGF treatment of MCF7 cells for 4, 6 and 24 hours significantly (P<0.001) induced soluble human AREG protein. These results demonstrate that activation of the endogenous FGF pathway by treating cells with ligand also increases AREG and EREG expression. Furthermore, as MCF7 cells are a human-derived breast cancer cell line, these studies suggest that activation of the FGF pathway signals an increase in both AREG and EREG expression in human cells, as well as mouse cells.
AREG and EREG both individually promote cellular migration and proliferation of mammary epithelial cells in vitro
On the basis of the fact that both AREG and EREG are upregulated following iFGFR1 activation and that iFGFR1 activation induces numerous tumorigenic phenotypes including migration and proliferation, we tested whether AREG and/or EREG affects these processes. To study the effects of AREG and EREG on migration, recombinant mouse AREG (rmAreg) or recombinant mouse EREG (rmEreg) was added to freshly scratch-wounded serum-starved HC11 mouse mammary epithelial cells, which do not express iFGFR1. The percentage of wound closure was calculated from the start of the treatment (0 hours) up to 18 hours after recombinant protein treatment. Compared with controls treated only with DMSO, addition of either rmAreg or rmEreg significantly (P<0.001) increased HC11 migration (Fig. 3A,B). Because AREG and EREG both activate EGFR (Shoyab et al., 1989; Komurasaki et al., 1997; Shelly et al., 1998), we examined the effects of blocking signaling through EGFR on the migratory potential of the rmAreg- or rmEreg-treated cells. For these studies, we used the EGFR inhibitor erlotinib, which exerts its effects by blocking EGFR kinase function. Cells treated with either rmAreg or rmEreg together with erlotinib had significantly (P<0.001) decreased migration compared with the rmAreg- or rmEreg-treated cells, similar to the DMSO-treated control levels (Fig. 3A,B). Moreover, erlotinib alone did not affect the migration of the HC11 cells as compared with the DMSO-treated controls (Fig. 3A,B), suggesting that the reduction in migration is not due to erlotinib-induced off-target effects but is due to an inhibition of EGFR signaling. These data suggest that treatment of cells with either AREG or EREG alone is enough to promote increased mammary epithelial cell migration, a hallmark of tumor progression. Furthermore, this migration is promoted at least in part through EGFR, as blocking EGFR activity by addition of erlotinib significantly impairs the ability of these epithelial cells to migrate into the open space of the wound.
Fig. 3.
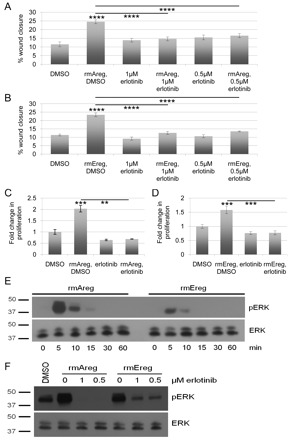
Treatment of HC11 cells with either AREG or EREG in vitro stimulates cellular migration, cellular proliferation and ERK activation. (A) Freshly wounded mouse mammary epithelial HC11 cells were treated with either DMSO, 20 ng/ml rmAreg+DMSO, 1 μM erlotinib, 20 ng/ml rmAreg+1 μM erlotinib, 0.5 μM erlotinib or 20 ng/ml rmAreg+0.5 μM erlotinib for 18 hours. Five representative images were taken per well at 0 and 18 hours, and the area of the open space of the wound was determined using Leica LAS Software. Migration was measured as the percentage of wound closure. Each treatment was performed in biological triplicates. Error bars represent s.e.m. ****P<0.001. (B) The migration assay was performed as in A using 10 ng/ml rmEreg instead of rmAreg. Each treatment was performed in biological triplicates. Error bars represent s.e.m. ****P<0.001. (C) HC11 cells were treated with DMSO, 100 ng/ml rmAreg, 1 μM erlotinib, or 100 ng/ml rmAreg+1 μM erlotinib for 48 hours. Proliferation was measured with an MTT assay and normalized to the levels at treatment day 0. Each treatment was performed in biological triplicates. Error bars represent s.e.m. **P<0.01; ***P<0.005. (D) HC11 cells were treated as in C, but with 10 ng/ml rmEreg in place of rmAreg. Proliferation was measured with an MTT assay at 48 hours and normalized to the levels at day 0 of treatment. Each treatment was performed in biological triplicates. Error bars represent s.e.m. ***P<0.005. (E) HC11 cells were treated with either 20 ng/ml rmAreg or 10 ng/ml rmEreg for the indicated times. Following treatment, whole cell lysates were collected and analyzed by immunoblot for phosphorylated ERK (pERK) and total ERK. The experiment shown is representative of three individual experiments. (F) HC11 cells were treated with combinations of 20 ng/ml rmAreg or 10 ng/ml rmEreg and DMSO, 1 μM erlotinib or 0.5 μM erlotinib as designated for 10 minutes. Whole cell lysates were collected and analyzed by immunoblot for phosphorylated ERK and total ERK. The experiment shown is representative of three individual experiments.
Previous studies have also demonstrated that activation of iFGFR1 induces proliferation of mammary epithelial cells (Welm et al., 2002; Xian et al., 2009; Xian et al., 2005). Because EGFR activation has also been linked to increased proliferation, we hypothesized that the upregulation of EGF ligands, such as AREG and EREG, might promote proliferation. Therefore, initial studies were performed to determine the ability of AREG and EREG to stimulate mammary epithelial cell proliferation. For these studies, HC11 cells were treated with rmAreg or rmEreg and either DMSO or erlotinib for 48 hours before performing an MTT assay. Treatment of HC11 cells with either rmAreg (Fig. 3C) or rmEreg (Fig. 3D) significantly (P<0.005) promoted proliferation compared with DMSO-treated controls, and this proliferation was blocked with erlotinib treatment. Taken together, these data demonstrate that treatment of mammary epithelial cells with recombinant AREG or EREG promotes EGFR-dependent migration and stimulates EGFR-dependent mammary epithelial cell proliferation.
AREG and EREG stimulate ERK activation in vitro, which is inhibited by erlotinib
The results described above, in which AREG and EREG treatment stimulates migration and proliferation of HC11 mammary epithelial cells, and that this is blocked by addition of the EGFR kinase inhibitor erlotinib, suggest that EGFR activation is required for AREG and EREG to exert their signaling effects. Because a known target of EGFR activation is ERK, we next examined the activation profile of ERK following rmAreg or rmEreg treatment. HC11 cells were treated with either rmAreg or rmEreg for various times up to 1 hour, and immunoblot analysis was performed to examine levels of phosphorylated and total ERK. Both rmAreg and rmEreg treatments led to increased ERK activation by 5 minutes, which was largely diminished within 15 minutes (Fig. 3E). These results suggest that AREG or EREG treatment induces rapid and transient ERK activation.
To confirm that the detected phosphorylated ERK is induced downstream of EGFR, HC11 cells were treated with rmAreg or rmEreg in the presence or absence of erlotinib for 10 minutes. Compared with DMSO-treated controls, rmAreg- or rmEreg-only treated cells showed increased phosphorylation of ERK (Fig. 3F), as expected on the basis of our above results. Notably, treatment of cells with erlotinib at either 1 μM or 0.5 μM, in addition to rmAreg or rmEreg, blocked ERK phosphorylation (Fig. 3F), suggesting that blocking EGFR activation, and thus signaling through EGFR, blocks activation of ERK in mammary epithelial cells. These data imply that EGFR must be activated in order for AREG and EREG to exert their effects and that blocking EGFR signaling effectively inhibits the effects of AREG and EREG stimulation.
Activation of iFGFR1 in mammary epithelial cells induces migration, proliferation and ERK activation in vitro, which are inhibited by erlotinib
As shown thus far, iFGFR1 activation upregulates expression of the EGFR ligands AREG and EREG, and the EGFR-specific inhibitor erlotinib blocks Areg- and Ereg-induced cellular processes and signaling. Therefore, we next assessed whether EGFR is activated following iFGFR1 activation in HC11/R1 cells. Serum-starved HC11/R1 cells were treated with AP or ethanol for 18 hours before the phosphorylation status of three crucial tyrosine residues within the EGFR kinase domain was evaluated. As shown in Fig. 4A, AP treatment stimulated phosphorylation of residues Y845, Y1068 and Y1173, as compared with that upon ethanol treatment, suggesting that activation of iFGFR1 does subsequently cause EGFR activation.
Fig. 4.
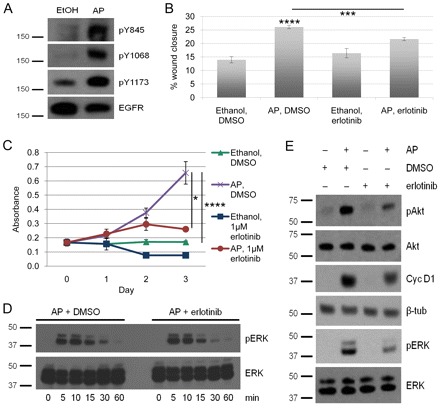
Erlotinib inhibits FGFR1-induced migration, proliferation and ERK activation in vitro. (A) HC11/R1 cells were treated with either 30 nM AP or ethanol for 18 hours. Whole cell lysates were collected and analyzed by immunoblot for total EGFR and EGFR phosphorylated at Y845, Y1068, and Y1173 (pY845, pY1068 and pY1173). Experiments shown are representative of three individual experiments. (B) Freshly wounded mouse mammary epithelial HC11/R1 cells were treated with ethanol+DMSO, 30 nM AP+DMSO, ethanol+1 μM erlotinib, or 30 nM AP+1 μM erlotinib for 18 hours. Five representative images were taken per well at 0 and 18 hours, and the area of the open space of the wound was determined using Leica LAS Software. Migration was measured as percent wound closure. Each treatment was performed in biological triplicates. Error bars represent s.e.m. ***P<0.005; ****P<0.001. (C) HC11/R1 cells were treated as in B for 72 hours. Proliferation was then measured with an MTT assay and normalized to the levels at day 0 of treatment. Each treatment was performed in biological triplicates. Error bars represent s.e.m. *P<0.05; ****P<0.001. (D) HC11/R1 cells were treated with 30 nM AP in the presence of either DMSO or 2 μM erlotinib for the times indicated. Whole cell lysates were collected and analyzed by immunoblot for phosphorylated ERK (pERK) and total ERK. The experiment shown is representative of three individual experiments. (E) HC11/R1 cells were treated with 30 nM AP or ethanol and either DMSO or 1 μM erlotinib for 7 [for measuring the cyclin D1 (Cyc D1) and β-tubulin (β-tub) levels] or 18 (for Akt and ERK) hours. Whole cell lysates were collected and analyzed by immunoblot for phosphorylated Akt (pAkt), total Akt, Cyc D1, β-tubulin, pERK and total ERK. Experiments shown are representative of three individual experiments.
Because treatment of cells with recombinant AREG and EREG protein stimulates migration and proliferation of HC11 cells, and because activating iFGFR1 results in EGFR phosphorylation, we next tested whether iFGFR1-induced cellular processes were dependent upon EGFR activity. Freshly wounded and serum-starved HC11/R1 cells were treated overnight with either AP and DMSO, or ethanol and DMSO. The percentage of wound closure was calculated from the start time of treatment (0 hours) to 18 hours post treatment. As expected based on previous studies (Xian et al., 2005), AP and DMSO treatment significantly stimulated migration of the HC11/R1 cells compared to ethanol and DMSO-treated controls (Fig. 4B). To determine whether EGFR activation is required for the increased iFGFR1-induced migration of HC11/R1 cells, we also added erlotinib to AP- or ethanol-treated cells. As shown in Fig. 4B, addition of erlotinib to AP-treated cells partially, but significantly decreased migration to levels close to the ethanol and DMSO-treated control. Erlotinib treatment of the ethanol control cells did not inhibit migration as compared with that in the ethanol and DMSO-treated control cells, demonstrating that the decreased migration of the AP- and erlotinib-treated HC11/R1 cells is not due to non-specific off-target effects of erlotinib. These results suggest that iFGFR1 activation signals through EGFR to promote migration in vitro.
To determine whether iFGFR1-mediated cellular proliferation could also be blocked by erlotinib treatment, an MTT assay was performed. As shown in Fig. 4C, AP and DMSO treatment of HC11/R1 cells induced greater cellular proliferation than ethanol and DMSO-treated controls. This proliferation was partially, but significantly (P<0.05), inhibited by erlotinib treatment, suggesting that iFGFR1 activation, at least in part, signals through EGFR to promote cellular proliferation in vitro. Moreover, erlotinib treatment of the ethanol control cells did not significantly block proliferation as compared with the ethanol- and DMSO-treated control cells, again demonstrating that the reduction in proliferation of the AP- and erlotinib-treated HC11/R1 cells is not due to off-target effects of erlotinib.
To be certain that erlotinib does not inhibit iFGFR1-driven migration and proliferation by blocking iFGFR1 activity in a non-specific manner, HC11/R1 cells were treated with AP in the presence of erlotinib and phosphorylation of ERK, a well-established downstream target of FGFR1 signaling, was determined. For these studies, serum-starved cells were treated for 0, 5, 10, 15, 30 and 60 minutes with AP in the presence of either erlotinib or DMSO. As shown in Fig. 4D, erlotinib did not block iFGFR1-induced activation of ERK during this timecourse. These results demonstrate that erlotinib is not blocking migration and proliferation by non-specifically inhibiting iFGFR1 activity.
On the basis of these results, we predicted that the accumulation of the ligands AREG and EREG over time leads to activation of EGFR and its downstream signaling pathways, and that this autocrine stimulation of EGFR contributes to FGFR1-induced migration and proliferation. To address this prediction, immunoblot analysis of signaling molecules downstream of EGFR was performed on HC11/R1 cells treated with AP or ethanol in the presence or absence of erlotinib or DMSO for 7 or 18 hours. As expected, phosphorylation of Akt and ERK was higher in the 18-hour AP-treated samples as compared with ethanol-treated samples (Fig. 4E). Moreover, the expression of the cell cycle regulator cyclin D1 was upregulated following 7 hours of AP treatment as compared with 7 hours of ethanol treatment. Importantly, erlotinib inhibited both Akt and ERK phosphorylation and cyclin D1 expression (Fig. 4E), suggesting that EGFR activation in HC11/R1 cells results in subsequent activation of several downstream signaling pathways.
Activation of iFGFR1 in vivo induces cellular proliferation of mouse mammary epithelial cells, which is inhibited by erlotinib
Activating iFGFR1 in vivo is known to stimulate aberrant epithelial cell budding due to increased proliferation of the epithelial cells (Welm et al., 2002). On the basis of our above results in which AREG and EREG promote cellular proliferation in vitro in an erlotinib-dependent manner, we wanted to determine whether erlotinib could also inhibit aberrant cellular proliferation in vivo. For these studies, MMTV-iFGFR1 transgenic mice were treated with erlotinib daily through oral gavage for 3 days in conjunction with intraperitoneal injections of AP on the second day of erlotinib treatment. At 2 days after iFGFR1 activation, the mice were injected with BrdU 2 hours before killing. The fourth inguinal mammary glands were harvested and tissue sections were stained for further analysis. Using hematoxylin and eosin (H&E) staining, it was found that, compared with wild-type controls, mammary glands from mice in which iFGFR1 was activated exhibited more aberrant epithelial budding around the ductal lumens (Fig. 5A–D). This aberrant budding significantly (P<0.05) decreased when the transgenic animals were treated with erlotinib in conjunction with iFGFR1 activation, suggesting that activation of EGFR is, at least in part, required for the anomalous mammary epithelial cell budding (Fig. 5A–D).
Fig. 5.
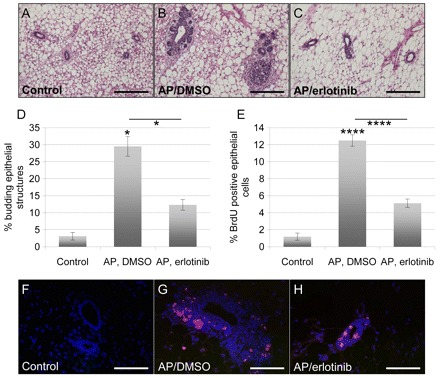
Erlotinib inhibits FGFR1-induced mammary epithelial cell budding and proliferation in vivo. (A–C) Representative images of H&E-stained sections of paraffin-embedded mammary glands from wild-type (control) mice (A), and MMTV-iFGFR1 transgenic mice treated with 1 mg per kg of body weight per day AP through intraperitoneal injections and either DMSO (B) or 25 mg per kg of body weight per day erlotinib (C) through oral gavage. Scale bars: 50 μm. (D) Quantification of the number of budding ductal structures. Every ductal structure distal to the lymph node was counted in H&E-stained sections of the 3 classes of mice, and was then grouped into budding or not budding structures. At least three sections were analyzed per mouse. Error bars represent s.e.m. *P<0.05. (E) Cellular proliferation was measured by immunofluorescence through BrdU staining. All epithelial cells were counted in ten ductal structures per section through DAPI staining, and the percentage of BrdU-positive epithelial cells was determined. A minimum of 1500 cells was counted per treatment group. Error bars represent s.e.m. ****P<0.001. (F–H) Representative images of BrdU-stained (red) sections of paraffin-embedded mammary glands from wild-type (control) mice (F), and MMTV-iFGFR1 transgenic mice treated with 1 mg per kg of body weight per day AP through intraperitoneal injections and either DMSO (G) or 25 mg per kg of body weight per day erlotinib (H) through oral gavage. The sections were also stained with DAPI (blue) to visualize all cells. Scale bars: 50 μm.
To ensure that the observed phenotype is due to aberrant cellular proliferation and not just a rearrangement of the cellular structure of the ductal tree, histological sections were stained with an anti-BrdU antibody. As shown in Fig. 5E–H, iFGFR1 activation in transgenic animals greatly increased cellular proliferation of the ductal epithelial cells as compared with wild-type controls. Erlotinib treatment of iFGFR1 transgenic mice significantly (P<0.001) reduced the number of BrdU-positive epithelial cells. These data suggest that iFGFR1-induced cellular proliferation in vivo requires activation of EGFR, as inhibiting the EGFR kinase domain with erlotinib treatment blocks the ability of the epithelial cells to proliferate.
Discussion
The gene encoding FGFR1 is located on human chromosome 8p11-12, which is a common site of amplification in human breast cancers (Gelsi-Boyer et al., 2005; Kwek et al., 2009; Letessier et al., 2006; Ugolini et al., 1999). Although it is still not clear whether FGFR1 is the driving oncoprotein in this region, studies that focused on identification of smaller segments within the amplicon have found that the region containing FGFR1 has been linked to poor prognosis (Gelsi-Boyer et al., 2005). Furthermore, recent studies have demonstrated that although FGFR1 might not be sufficient to drive tumor formation on its own, it can act in concert with genes in other co-amplified regions, such as MYC on 11q13, to promote tumorigenesis (Kwek et al., 2009). In agreement with this hypothesis, studies using mouse models have demonstrated that FGFR1 activation, in conjunction with another oncogenic signal, such as WNT1, can dramatically decrease tumor latency (Pond et al., 2010). Finally, recent studies have implicated FGFR1 in breast cancer, particularly in the resistance of breast cancer cells to endocrine- and chemotherapy-based treatments (Chin et al., 2006; Turner et al., 2010). Therefore, FGFR1 might represent a novel therapeutic target in breast cancer patients, particularly in patients that do not respond well to standard therapies.
On the basis of the potential contributions of FGFR1 to breast tumorigenesis, we have utilized both in vitro and in vivo models to better understand the mechanisms by which FGFR1 promotes mammary tumor formation. Previous studies have demonstrated that activation of FGFR1 in mammary epithelial cells in vitro results in increased proliferation, survival, migration, invasion and EMT (Welm et al., 2002; Xian et al., 2007; Xian et al., 2005). Furthermore, activation of FGFR1 in mammary epithelial cells in vivo leads to the formation of alveolar hyperplasias, ultimately resulting in the formation of tumors with both adenocarcinoma and squamous characteristics (Schwertfeger et al., 2006; Welm et al., 2002). We have further utilized these cell culture and transgenic mouse models to delineate the mechanisms by which FGFR1 promotes mammary tumor formation. Obtaining a better understanding of these mechanisms will ultimately lead to the development of therapeutic strategies to target tumors in breast cancer patients with high levels of FGFR1 and increased resistance to conventional therapies.
Previous gene expression studies, using microarray analysis, led to the identification of numerous potential genes involved in promoting FGFR1-driven tumorigenesis (Schwertfeger et al., 2006). Our recent studies have focused primarily on secreted factors regulated by FGFR1 because of the potential ability of secreted factors to regulate both epithelial and stromal cells. During the analysis of these previous studies, we found a significant induction of two EGF ligands, AREG and EREG, following iFGFR1 activation. This finding was further verified in our iFGFR1 in vitro system. Importantly, AREG and EREG expression was increased following iFGFR1 activation at both the transcript and protein levels. This observation was also confirmed in the MCF7 human breast cancer cell line, which has been previously used to study FGF signaling in breast cancer cells. We chose to further evaluate the ability of these ligands to act through the EGFR pathway to promote FGFR1-driven mammary tumorigenesis.
Both AREG and EREG have been implicated in breast cancer (Bieche et al., 2004; Eltarhouny et al., 2008; Gupta et al., 2007; Kenney et al., 1996b; Kondapaka et al., 1997; Ma et al., 1999; Silvy et al., 2001). High levels of AREG expression have been identified in cancerous lesions but not in neighboring non-cancerous tissue (LeJeune et al., 1993; Panico et al., 1996; Qi et al., 1994). This expression has also been associated with large high-grade tumors and metastases found in lymph nodes, suggesting that high levels of AREG expression are a marker for aggressive invasive breast cancers (LeJeune et al., 1993; Ma et al., 2001; Qi et al., 1994). EREG expression has also been found to correlate with breast cancer metastasis to the lung, suggesting that it too promotes invasive breast cancer progression (Eltarhouny et al., 2008; Gupta et al., 2007). AREG is known to exclusively bind and activate EGFR (Shoyab et al., 1989), whereas EREG acts through both EGFR and ERBB4 (Komurasaki et al., 1997; Shelly et al., 1998). In these studies, we found that AREG and EREG were both able to induce proliferation, migration and activation of the ERK pathway in HC11 cells. Furthermore, AREG and EREG both act primarily through EGFR, as demonstrated by the inhibition of these phenotypes by the EGFR-specific inhibitor erlotinib.
Because AREG and EREG, which are both EGFR ligands, are both induced by iFGFR1 activation and are capable of promoting both migration and proliferation of the HC11 cells, we hypothesized that activation of EGFR could be a mechanism by which iFGFR1 promotes these phenotypes. In agreement with this hypothesis, the present study demonstrates that iFGFR1 activation stimulates phosphorylation of EGFR and that blocking EGFR activity inhibits iFGFR1-induced migration and proliferation. Moreover, investigation of downstream molecules demonstrated that AP treatment of HC11/R1 cells stimulated activation of Akt and ERK and expression of cyclin D1 in an EGFR-dependent manner. However, analysis of other signaling pathways revealed that both MAPK14 and phospholipase Cγ were regulated solely by iFGFR1 and not by EGFR (data not shown). Although erlotinib treatment significantly inhibited iFGFR1-driven proliferation and migration, this inhibition was not complete, suggesting that EGFR-independent pathways also contribute to these phenotypes. Therefore, it is possible that using a combination of erlotinib and additional inhibitors that specifically target these pathways will lead to a more complete inhibition of iFGFR1-driven phenotypes. Overall, the results presented here support the hypothesis that iFGFR1 leads to activation of EGFR, which then contributes to the regulation of some signaling pathways that promote iFGFR1-induced tumorigenesis.
Because the concentration of AREG in the medium was consistently higher than that of EREG, we predicted that AREG would be the dominant ligand responsible for EGFR activation. However, knockdown of Areg in the HC11/R1 cells using shRNA strategies did not reveal any differences in iFGFR1-induced migration or proliferation (data not shown). Therefore, it is possible that EREG compensates for the loss of AREG and that targeting single ligands might not be an effective therapeutic strategy when multiple EGFR ligands are present. Current studies are focusing on understanding the regulation of the sheddase ADAM17 by FGFR1 and the ability of this protease to release of both AREG and EREG into the medium. Targeting the regulation of AREG and EREG release into the medium might represent a better strategy than targeting the ligands themselves.
Using a mouse model of mammary tumorigenesis, we have demonstrated that treatment of mice with erlotinib inhibits epithelial proliferation and subsequent formation of early-stage hyperplastic lesions following iFGFR1-activation in vivo. Although our cell culture studies focused on the autocrine effects of iFGFR1-induced activation of EGFR, it is possible that paracrine stimulation of EGFR is also involved in regulating the tumorigenic phenotype in vivo. For example, transplantation studies using different combinations of AREG and EGFR-null and -positive epithelial and stromal cell types found that, for proper mammary gland development, AREG expression is required in the mammary epithelial cells, whereas EGFR is required in the stromal, and not the epithelial, compartment (Sternlicht et al., 2005; Wiesen et al., 1999). These data indicate that AREG can act in a paracrine manner through stromal EGFR to stimulate expression of growth factor(s) that can act to drive epithelial cell proliferation, which is necessary for proper ductal network formation within the mammary gland. Further studies are required to better understand the effects of AREG and EREG on cells within the stroma and how these interactions might promote tumorigenesis.
Taken together, our results reveal the complex interactions between various signaling pathways that can regulate tumorigenesis and suggest that targeted therapies need to take into account more than one pathway. To date, FGFR1 inhibitors have not yet been tested in patients, although there are reports of FGFR1 inhibitors in preparation (Zhou et al., 2010). However, EGFR inhibitors have been successfully utilized in patients with certain types of cancers, including lung cancers (Gridelli et al., 2010; Squadroni and Fazio, 2010). Therefore, inhibition of the EGFR pathway might be an alternative targeting strategy in breast cancer patients with high levels of FGFR1. Further studies are required to determine the link between FGFR1 expression and EGFR activation in human breast cancer tissue samples.
In summary, we have demonstrated that the EGFR pathway is an important downstream regulator of FGFR1-induced mammary tumor formation. Growth factor receptors and their downstream signaling pathways in breast cancer have been the focus of numerous studies. However, these studies have generally focused on single pathways at a time. It is becoming clear that these pathways probably interact and that understanding the key points at which these pathways communicate is important for generating novel therapies that most efficiently inhibit tumor formation and progression.
Materials and Methods
Cell culture and treatment
Generation of HC11 cells stably expressing the iFGFR1 construct (HC11/R1 cells) was described previously (Xian et al., 2005), and the cells were obtained from Jeff Rosen (Baylor College of Medicine, Houston, TX). Cells were maintained in HC11/R1 complete medium [serum free (SF)-RPMI (Invitrogen) supplemented with of 10% fetal bovine serum (FBS) (Invitrogen), 1% penicillin-streptomycin (Invitrogen), 5 μg/ml insulin (Sigma-Aldrich), 10 ng/ml EGF (Invitrogen) and 0.7 μg/ml puromycin (Sigma-Aldrich) (final percentages or concentrations)]. HC11 cells were maintained in HC11 complete medium (HC11/R1 complete medium without puromycin). Before treatment with 30 nM AP (Ariad Pharmaceuticals, Cambridge, MA) or its solvent ethanol, confluent cells were rinsed twice with 1 × PBS (Cellgro, Manassas, VA) and incubated in SF–RPMI overnight. 2 μM erlotinib (Boynton Pharmacy, University of Minnesota, Minneapolis, MN, USA), 1 μM erlotinib, 0.5 μM erlotinib, or DMSO (Sigma-Aldrich) as a solvent control, was added to the SF media as indicated. MCF7 cells were previously obtained from the American Type Culture Collection (ATCC, Manassas, VA) and maintained in MCF7 complete medium [SF–Dulbecco's modified Eagle's medium (DMEM; Invitrogen) supplemented with 10% FBS, 1% penicillin-streptomycin and 5 μg/ml insulin (final percentages or concentrations)]. Before treatment with bFGF (Invitrogen), confluent MCF7 cells were rinsed twice with 1 × PBS and starved overnight in SF-DMEM. For bFGF treatment, cells were incubated for the indicated time with 50 ng/ml bFGF. All cells were grown and maintained at 37°C under a 5% CO2 atmosphere.
RNA isolation and quantitative RT-PCR analysis
RNA was isolated from HC11/R1 and MCF7 cells and from the fourth inguinal mammary glands of MMTV-iFGFR1 transgenic mice using TRIzol (Invitrogen) as described previously (Reed et al., 2009; Schwertfeger et al., 2006). For qRT-PCR analysis, cDNA was generated using the Quantitect reverse transcription kit (Qiagen) and used in quantitative SYBR green qRT-PCR reactions as described previously (Yuen et al., 2002) using the Bio-Rad iQ5 system. Relative quantification of gene expression was calculated and normalized to averaged cyclophilin B expression levels using the 2−ΔΔCt method (Livak and Schmittgen, 2001). The following mouse primer sequences were used: AREG, 5′-GGGGACTACGACTACTCAGAG-3′ and 5′-TCTTGGGCTTAATCACCTGTTC-3′; EREG, 5′-TCCGAGGATAACTGTACCGC-3′ and 5′-CTCTCATGTCCACCAGGTAGAT-3′; and cyclophilin B, 5′-TGAGCACTGGGGAGAAAGG-3′ and 5′-TTGCCATCCAGCCACTCAG-3′. For MCF7 cells, the following human primers were used: AREG, 5′-GTGGTGCTGTCGCTCTTGATA-3′ and 5′-ACTCACAGGGGAAATCTCACT-3′9; EREG, 5′-CTGCCTGGGTTTCCATCTTCT-3′ and 5′-GCCATTCATGTCAGAGCTACACT-3′; and cyclophilin B, 5′-GAAAGAGCATCTACGGTGAGC-3′ and 5′-GTCTTGACTGTCGTGATGAAGAA-3′. Experiments were performed in biological triplicates. Statistical analysis was performed using the unpaired Student's t-test to compare two means (GraphPad QuickCalcs).
Immunohistochemistry
The following antibodies were used: anti-AREG (AF989) and anti-EREG (AF1068) antibodies (R&D Systems). For both antibodies, sodium citrate antigen retrieval was used as described previously (Grimm and Rosen, 2003) and primary antibodies were used at a concentration of 15 μg/ml. Immunohistochemistry analysis was performed on mammary gland sections from a minimum of three mice per treatment and genotype.
ELISA
Serum-starved HC11/R1 cells were treated with either 30 nM AP or its solvent ethanol overnight. Serum-starved MCF7 cells were treated with 50 ng/ml bFGF for 4, 6 or 24 hours. Conditioned medium was collected and used to quantify the soluble ligand concentration of AREG and/or EREG using ELISA assays (R&D Systems). Experiments were performed in biological triplicates. Statistical analysis was performed using the unpaired Student's t-test to compare two means (GraphPad QuickCalcs).
Migration assays
For AREG and EREG overexpression, HC11 cells were grown to confluence and then starved in SF-RPMI. The next day, a P10 pipette tip was used to make a scratch down the center of each well. Cells were then treated with either 20 ng/ml rmAreg or 10 ng/ml rmEreg (both R&D Systems) in the presence or absence of either 1 μM or 0.5 μM erlotinib, or an equivalent amount of DMSO. To test iFGFR1-induced migration, HC11/R1 cells were grown to confluence and then starved in SF-RPMI overnight. Serum starved cells were treated with 30 nM AP or an equivalent amount of ethanol overnight. Additionally, the HC11/R1 cells were treated with 1 μM erlotinib or an equivalent amount of DMSO. All treatments were performed in biological triplicates. Five representative pictures of each scratch were taken at the start time of treatment and 18 hours later. Areas of the open space in each picture were determined using the Leica LAS software, and the percentage of wound closure was calculated for each treatment. Statistical analysis was performed using the unpaired Student's t-test to compare two means (GraphPad QuickCalcs).
MTT assays
HC11 or HC11/R1 cells were plated in complete medium on day 0 into 24-well tissue culture plates at 20,000 cells per well. Cells were grown overnight and then starved in SF-RPMI. The next day, cells were stimulated with 100 ng/ml rmAreg (HC11 cells), 10 ng/ml rmEreg (HC11 cells) or 30 nM AP (HC11/R1 cells) in the presence or absence of 1 μM erlotinib or an equivalent amount of DMSO. After 48 (HC11 cells) or 72 (HC11/R1 cells) hours, Thiazolyl Blue Tetrazolium Bromide (Sigma-Aldrich) was added to each well at a final concentration of 0.3 mg/ml for 2 hours. The medium was then removed from the wells, and the cells were solubilized in 95% DMSO and 5% 1 × PBS. The solubilized dye was detected on a plate reader at an absorbance at 570 nm with background fluorescence at 650 nm subtracted from each value. Experiments were performed in biological triplicates. Statistical analysis was performed using the unpaired Student's t-tests to compare two means (GraphPad QuickCalcs).
Immunoblot analysis
HC11 or HC11/R1 cells were grown to confluence and then starved in SF-RPMI overnight. The next day, each well of HC11 cells was treated with 20 ng/ml rmAreg or 10 ng/ml rmEreg for the indicated time (Fig. 3E) or overnight (Fig. 3F) in the presence or absence of either 1 μM or 0.5 μM erlotinib, or an equivalent amount of DMSO. HC11/R1 cells were treated with either 30 nM AP or ethanol in the presence of either 1 μM erlotinib or an equivalent amount of DMSO for 7 or 18 hours (Fig. 4A,E). Alternatively, HC11/R1 cells were treated with 30 nM AP with 2 μM erlotinib or an equivalent amount of DMSO for the times indicated (Fig. 4D). Following all treatments, lysates were collected in RIPA buffer, and the total protein concentration was determined using a Bradford assay. At total of 30 μg protein was analyzed by SDS-PAGE and immunoblotting for phosphorylated Akt (1:2000, 9271, Cell Signaling), cyclin D1 (1:2000, 2926, Cell Signaling), β-tubulin (1:1000, 2146, Cell Signaling), EGFR (1:100,000, ab52894, Abcam), EGFR phosphorylated at Y845 (1:1000, 2231, Cell Signaling), EGFR phosphorylated at Y1068 (1:1000, 3777, Cell Signaling), EGFR phosphorylated at Y1173 (1:1000, ab5652, Abcam), or phosphorylated ERK (1:500, 9101, Cell Signaling). Additionally, 5 μg protein was analyzed by SDS-PAGE and immunoblotting for total Akt (1:1000, 9272, Cell Signaling) or ERK (1:2000, sc-94, Santa Cruz Biotechnology). Experiments were performed at least three separate times.
Animals
Generation of MMTV-iFGFR1 transgenic mice has been described previously (Welm et al., 2002) and the mice were obtained from Jeff Rosen. Animal care and procedures were approved by the Institutional Animal Care and Use Committee of the University of Minnesota and were in accordance with the procedures detailed in the Guide for Care and Use of Laboratory Animals.
Treatment of mice
Six-week-old MMTV-iFGFR1 female mice were administered with 25 mg per kg of body weight per day erlotinib or an equivalent amount of the DMSO solvent through oral gavage once daily for 3 days. On the second day of oral gavage treatment, the mice were also given intraperitoneal injections of 1 mg per kg of body weight AP to activate iFGFR1. At 24 hours after the third oral gavage, the mice were given intraperitoneal injections of 0.3 mg per kg of body weight BrdU (GE Healthcare). Mice were killed 2 hours after the BrdU injections, and their fourth inguinal mammary glands were harvested for further analysis.
Mammary gland histology and measurement of epithelial budding
Glands were fixed in fresh 4% paraformaldehyde (PFA) for 2 hours on ice and then stored in 70% ethanol. For histological and immunofluorescence analysis, glands were embedded in paraffin and sectioned (5 μm thickness). H&E-stained sections were used to calculate the percentage of budding structures. Each epithelial structure distal to the lymph node was counted and grouped into either no budding, moderate budding (1–4 buds) or severe budding (>4 buds). The percentage of budding was calculated by comparing all budding structures to all structures for each category of mice. At least three sections were analyzed per mouse. For immunofluorescence analysis, 5-μm sections were stained with anti-BrdU antibody (1:300, ab6326, Abcam,) according to standard protocols. Sections were mounted in ProLong Gold antifade reagent with DAPI (Invitrogen) to visualize the nuclei. A total of 10 epithelial ductal structures distal to the lymph node were imaged per mammary gland section. On the basis of the DAPI staining, all epithelial cells within each structure were counted and all BrdU-positive epithelial cells of the same structure were counted to determine the percentage of BrdU-positive cells. A minimum of 1500 epithelial cells were counted per treatment group, and all studies were performed in a blinded manner. Statistical analysis was performed using the unpaired Student's t-test to compare two means (GraphPad QuickCalcs).
Acknowledgments
We thank Laura Bohrer, Johanna Reed and Thomas Beadnell, Jr for critical reading of this manuscript. These studies were supported by funding from the Minnesota Medical Foundation and the American Cancer Society (RSG-09-192-01-LIB).
References
- Alroy I., Yarden Y. (1997). The ErbB signaling network in embryogenesis and oncogenesis: signal diversification through combinatorial ligand-receptor interactions. FEBS Lett. 410, 83-86. [DOI] [PubMed] [Google Scholar]
- Andre F., Job B., Dessen P., Tordai A., Michiels S., Liedtke C., Richon C., Yan K., Wang B., Vassal G., et al. (2009). Molecular characterization of breast cancer with high-resolution oligonucleotide comparative genomic hybridization array. Clin. Cancer Res. 15, 441-451. [DOI] [PubMed] [Google Scholar]
- Bieche I., Lerebours F., Tozlu S., Espie M., Marty M., Lidereau R. (2004). Molecular profiling of inflammatory breast cancer: identification of a poor-prognosis gene expression signature. Clin. Cancer Res. 10, 6789-6795. [DOI] [PubMed] [Google Scholar]
- Brandt R., Eisenbrandt R., Leenders F., Zschiesche W., Binas B., Juergensen C., Theuring F. (2000). Mammary gland specific hEGF receptor transgene expression induces neoplasia and inhibits differentiation. Oncogene 19, 2129-2137. [DOI] [PubMed] [Google Scholar]
- Brown C. L., Meise K. S., Plowman G. D., Coffey R. J., Dempsey P. J. (1998). Cell surface ectodomain cleavage of human amphiregulin precursor is sensitive to a metalloprotease inhibitor. Release of a predominant N-glycosylated 43-kDa soluble form. J. Biol. Chem. 273, 17258-17268. [DOI] [PubMed] [Google Scholar]
- Chin K., DeVries S., Fridlyand J., Spellman P. T., Roydasgupta R., Kuo W. L., Lapuk A., Neve R. M., Qian Z., Ryder T., et al. (2006). Genomic and transcriptional aberrations linked to breast cancer pathophysiologies. Cancer Cell 10, 529-541. [DOI] [PubMed] [Google Scholar]
- Cho E. Y., Choi Y. L., Han J. J., Kim K. M., Oh Y. L. (2008). Expression and amplification of Her2, EGFR and cyclin D1 in breast cancer: immunohistochemistry and chromogenic in situ hybridization. Pathol. Int. 58, 17-25. [DOI] [PubMed] [Google Scholar]
- Ciarloni L., Mallepell S., Brisken C. (2007). Amphiregulin is an essential mediator of estrogen receptor alpha function in mammary gland development. Proc. Natl. Acad. Sci. USA 104, 5455-5460. [DOI] [PMC free article] [PubMed] [Google Scholar]
- Dailey L., Ambrosetti D., Mansukhani A., Basilico C. (2005). Mechanisms underlying differential responses to FGF signaling. Cytokine Growth Factor Rev. 16, 233-247. [DOI] [PubMed] [Google Scholar]
- Dickson C., Spencer-Dene B., Dillon C., Fantl V. (2000). Tyrosine kinase signalling in breast cancer: fibroblast growth factors and their receptors. Breast Cancer Res. 2, 191-196. [DOI] [PMC free article] [PubMed] [Google Scholar]
- Elbauomy Elsheikh S., Green A. R., Lambros M. B., Turner N. C., Grainge M. J., Powe D., Ellis I. O., Reis-Filho J. S. (2007). FGFR1 amplification in breast carcinomas: a chromogenic in situ hybridisation analysis. Breast Cancer Res. 9, R23. [DOI] [PMC free article] [PubMed] [Google Scholar]
- Eltarhouny S. A., Elsawy W. H., Radpour R., Hahn S., Holzgreve W., Zhong X. Y. (2008). Genes controlling spread of breast cancer to lung “gang of 4”. Exp. Oncol. 30, 91-95. [PubMed] [Google Scholar]
- Eswarakumar V. P., Lax I., Schlessinger J. (2005). Cellular signaling by fibroblast growth factor receptors. Cytokine Growth Factor Rev. 16, 139-149. [DOI] [PubMed] [Google Scholar]
- Fabian C. J., Zalles C., Kamel S., Kimler B. F., McKittrick R., Tranin A. S., Zeiger S., Moore W. P., Hassanein R. S., Simon C., et al. (1994). Prevalence of aneuploidy, overexpressed ER, and overexpressed EGFR in random breast aspirates of women at high and low risk for breast cancer. Breast Cancer Res. Treat. 30, 263-274. [DOI] [PubMed] [Google Scholar]
- Fox S. B., Smith K., Hollyer J., Greenall M., Hastrich D., Harris A. L. (1994). The epidermal growth factor receptor as a prognostic marker: results of 370 patients and review of 3009 patients. Breast Cancer Res. Treat. 29, 41-49. [DOI] [PubMed] [Google Scholar]
- Gelsi-Boyer V., Orsetti B., Cervera N., Finetti P., Sircoulomb F., Rouge C., Lasorsa L., Letessier A., Ginestier C., Monville F., et al. (2005). Comprehensive profiling of 8p11-12 amplification in breast cancer. Mol. Cancer Res. 3, 655-667. [DOI] [PubMed] [Google Scholar]
- Gridelli C., Maione P., Bareschino M. A., Schettino C., Sacco P. C., Ambrosio R., Barbato V., Falanga M., Rossi A. (2010). Erlotinib in the treatment of non-small cell lung cancer: current status and future developments. Anticancer Res. 30, 1301-1310. [PubMed] [Google Scholar]
- Grimm S. L., Rosen J. M. (2003). The role of C/EBPbeta in mammary gland development and breast cancer. J. Mammary Gland Biol. Neoplasia 8, 191-204. [DOI] [PubMed] [Google Scholar]
- Grose R., Dickson C. (2005). Fibroblast growth factor signaling in tumorigenesis. Cytokine Growth Factor Rev. 16, 179-186. [DOI] [PubMed] [Google Scholar]
- Gupta G. P., Nguyen D. X., Chiang A. C., Bos P. D., Kim J. Y., Nadal C., Gomis R. R., Manova-Todorova K., Massague J. (2007). Mediators of vascular remodelling co-opted for sequential steps in lung metastasis. Nature 446, 765-770. [DOI] [PubMed] [Google Scholar]
- Kenney N. J., Smith G. H., Maroulakou I. G., Green J. H., Muller W. J., Callahan R., Salomon D. S., Dickson R. B. (1996a). Detection of amphiregulin and Cripto-1 in mammary tumors from transgenic mice. Mol. Carcinog. 15, 44-56. [DOI] [PubMed] [Google Scholar]
- Kenney N. J., Smith G. H., Rosenberg K., Cutler M. L., Dickson R. B. (1996b). Induction of ductal morphogenesis and lobular hyperplasia by amphiregulin in the mouse mammary gland. Cell Growth Differ. 7, 1769-1781. [PubMed] [Google Scholar]
- Klijn J. G., Berns P. M., Schmitz P. I., Foekens J. A. (1992). The clinical significance of epidermal growth factor receptor (EGF-R) in human breast cancer: a review on 5232 patients. Endocr. Rev. 13, 3-17. [DOI] [PubMed] [Google Scholar]
- Komurasaki T., Toyoda H., Uchida D., Morimoto S. (1997). Epiregulin binds to epidermal growth factor receptor and ErbB-4 and induces tyrosine phosphorylation of epidermal growth factor receptor, ErbB-2, ErbB-3 and ErbB-4. Oncogene 15, 2841-2848. [DOI] [PubMed] [Google Scholar]
- Komurasaki T., Toyoda H., Uchida D., Nemoto N. (2002). Mechanism of growth promoting activity of epiregulin in primary cultures of rat hepatocytes. Growth Factors 20, 61-69. [DOI] [PubMed] [Google Scholar]
- Kondapaka S. B., Fridman R., Reddy K. B. (1997). Epidermal growth factor and amphiregulin up-regulate matrix metalloproteinase-9 (MMP-9) in human breast cancer cells. Int. J. Cancer 70, 722-726. [DOI] [PubMed] [Google Scholar]
- Koziczak M., Holbro T., Hynes N. E. (2004). Blocking of FGFR signaling inhibits breast cancer cell proliferation through downregulation of D-type cyclins. Oncogene 23, 3501-3508. [DOI] [PubMed] [Google Scholar]
- Kwek S. S., Roy R., Zhou H., Climent J., Martinez-Climent J. A., Fridlyand J., Albertson D. G. (2009). Co-amplified genes at 8p12 and 11q13 in breast tumors cooperate with two major pathways in oncogenesis. Oncogene 28, 1892-1903. [DOI] [PMC free article] [PubMed] [Google Scholar]
- LeJeune S., Leek R., Horak E., Plowman G., Greenall M., Harris A. L. (1993). Amphiregulin, epidermal growth factor receptor, and estrogen receptor expression in human primary breast cancer. Cancer Res. 53, 3597-3602. [PubMed] [Google Scholar]
- Letessier A., Sircoulomb F., Ginestier C., Cervera N., Monville F., Gelsi-Boyer V., Esterni B., Geneix J., Finetti P., Zemmour C., et al. (2006). Frequency, prognostic impact, and subtype association of 8p12, 8q24, 11q13, 12p13, 17q12, and 20q13 amplifications in breast cancers. BMC Cancer 6, 245. [DOI] [PMC free article] [PubMed] [Google Scholar]
- Liu J. F., Crepin M., Liu J. M., Barritault D., Ledoux D. (2002). FGF-2 and TPA induce matrix metalloproteinase-9 secretion in MCF-7 cells through PKC activation of the Ras/ERK pathway. Biochem. Biophys. Res. Commun. 293, 1174-1182. [DOI] [PubMed] [Google Scholar]
- Livak K. J., Schmittgen T. D. (2001). Analysis of relative gene expression data using real-time quantitative PCR and the 2(-Delta Delta C(T)) method. Methods 25, 402-408. [DOI] [PubMed] [Google Scholar]
- Luetteke N. C., Qiu T. H., Fenton S. E., Troyer K. L., Riedel R. F., Chang A., Lee D. C. (1999). Targeted inactivation of the EGF and amphiregulin genes reveals distinct roles for EGF receptor ligands in mouse mammary gland development. Development 126, 2739-2750. [DOI] [PubMed] [Google Scholar]
- Ma L., Gauville C., Berthois Y., Millot G., Johnson G. R., Calvo F. (1999). Antisense expression for amphiregulin suppresses tumorigenicity of a transformed human breast epithelial cell line. Oncogene 18, 6513-6520. [DOI] [PubMed] [Google Scholar]
- Ma L., de Roquancourt A., Bertheau P., Chevret S., Millot G., Sastre-Garau X., Espie M., Marty M., Janin A., Calvo F. (2001). Expression of amphiregulin and epidermal growth factor receptor in human breast cancer: analysis of autocriny and stromal-epithelial interactions. J. Pathol. 194, 413-419. [DOI] [PubMed] [Google Scholar]
- Mitsudomi T., Yatabe Y. (2010). Epidermal growth factor receptor in relation to tumor development: EGFR gene and cancer. FEBS J. 277, 301-308. [DOI] [PubMed] [Google Scholar]
- Moscatello D. K., Holgado-Madruga M., Godwin A. K., Ramirez G., Gunn G., Zoltick P. W., Biegel J. A., Hayes R. L., Wong A. J. (1995). Frequent expression of a mutant epidermal growth factor receptor in multiple human tumors. Cancer Res. 55, 5536-5539. [PubMed] [Google Scholar]
- Ornitz D. M. (2000). FGFs, heparan sulfate and FGFRs: complex interactions essential for development. BioEssays 22, 108-112. [DOI] [PubMed] [Google Scholar]
- Panico L., D'Antonio A., Salvatore G., Mezza E., Tortora G., De Laurentiis M., De Placido S., Giordano T., Merino M., Salomon D. S., et al. (1996). Differential immunohistochemical detection of transforming growth factor alpha, amphiregulin and CRIPTO in human normal and malignant breast tissues. Int. J. Cancer 65, 51-56. [DOI] [PubMed] [Google Scholar]
- Penault-Llorca F., Bertucci F., Adelaide J., Parc P., Coulier F., Jacquemier J., Birnbaum D., deLapeyriere O. (1995). Expression of FGF and FGF receptor genes in human breast cancer. Int. J. Cancer 61, 170-176. [DOI] [PubMed] [Google Scholar]
- Plowman G. D., Green J. M., McDonald V. L., Neubauer M. G., Disteche C. M., Todaro G. J., Shoyab M. (1990). The amphiregulin gene encodes a novel epidermal growth factor-related protein with tumor-inhibitory activity. Mol. Cell. Biol. 10, 1969-1981. [DOI] [PMC free article] [PubMed] [Google Scholar]
- Pond A. C., Herschkowitz J. I., Schwertfeger K. L., Welm B., Zhang Y., York B., Cardiff R. D., Hilsenbeck S., Perou C. M., Creighton C. J., et al. (2010). Fibroblast growth factor receptor signaling dramatically accelerates tumorigenesis and enhances oncoprotein translation in the mouse mammary tumor virus-Wnt-1 mouse model of breast cancer. Cancer Res. 70, 4868-4879. [DOI] [PMC free article] [PubMed] [Google Scholar]
- Presta M., Dell'Era P., Mitola S., Moroni E., Ronca R., Rusnati M. (2005). Fibroblast growth factor/fibroblast growth factor receptor system in angiogenesis. Cytokine Growth Factor Rev. 16, 159-178. [DOI] [PubMed] [Google Scholar]
- Qi C. F., Liscia D. S., Normanno N., Merlo G., Johnson G. R., Gullick W. J., Ciardiello F., Saeki T., Brandt R., Kim N., et al. (1994). Expression of transforming growth factor alpha, amphiregulin and cripto-1 in human breast carcinomas. Br. J. Cancer 69, 903-910. [DOI] [PMC free article] [PubMed] [Google Scholar]
- Reed J. R., Leon R. P., Hall M. K., Schwertfeger K. L. (2009). Interleukin-1beta and fibroblast growth factor receptor 1 cooperate to induce cyclooxygenase-2 during early mammary tumourigenesis. Breast Cancer Res. 11, R21. [DOI] [PMC free article] [PubMed] [Google Scholar]
- Rimawi M. F., Shetty P. B., Weiss H. L., Schiff R., Osborne C. K., Chamness G. C., Elledge R. M. (2010). Epidermal growth factor receptor expression in breast cancer association with biologic phenotype and clinical outcomes. Cancer 116, 1234-1242. [DOI] [PMC free article] [PubMed] [Google Scholar]
- Sahin U., Weskamp G., Kelly K., Zhou H. M., Higashiyama S., Peschon J., Hartmann D., Saftig P., Blobel C. P. (2004). Distinct roles for ADAM10 and ADAM17 in ectodomain shedding of six EGFR ligands. J. Cell Biol. 164, 769-779. [DOI] [PMC free article] [PubMed] [Google Scholar]
- Schneider M. R., Wolf E. (2009). The epidermal growth factor receptor ligands at a glance. J. Cell. Physiol. 218, 460-466. [DOI] [PubMed] [Google Scholar]
- Schwertfeger K. L., Xian W., Kaplan A. M., Burnett S. H., Cohen D. A., Rosen J. M. (2006). A critical role for the inflammatory response in a mouse model of preneoplastic progression. Cancer Res. 66, 5676-5685. [DOI] [PubMed] [Google Scholar]
- Shelly M., Pinkas-Kramarski R., Guarino B. C., Waterman H., Wang L. M., Lyass L., Alimandi M., Kuo A., Bacus S. S., Pierce J. H., et al. (1998). Epiregulin is a potent pan-ErbB ligand that preferentially activates heterodimeric receptor complexes. J. Biol. Chem. 273, 10496-10505. [DOI] [PubMed] [Google Scholar]
- Shirakata Y., Komurasaki T., Toyoda H., Hanakawa Y., Yamasaki K., Tokumaru S., Sayama K., Hashimoto K. (2000). Epiregulin, a novel member of the epidermal growth factor family, is an autocrine growth factor in normal human keratinocytes. J. Biol. Chem. 275, 5748-5753. [DOI] [PubMed] [Google Scholar]
- Shoyab M., Plowman G. D., McDonald V. L., Bradley J. G., Todaro G. J. (1989). Structure and function of human amphiregulin: a member of the epidermal growth factor family. Science 243, 1074-1076. [DOI] [PubMed] [Google Scholar]
- Silvy M., Giusti C., Martin P. M., Berthois Y. (2001). Differential regulation of cell proliferation and protease secretion by epidermal growth factor and amphiregulin in tumoral versus normal breast epithelial cells. Br. J. Cancer 84, 936-945. [DOI] [PMC free article] [PubMed] [Google Scholar]
- Squadroni M., Fazio N. (2010). Chemotherapy in pancreatic adenocarcinoma. Eur. Rev. Med. Pharmacol. Sci. 14, 386-394. [PubMed] [Google Scholar]
- Sternlicht M. D., Sunnarborg S. W., Kouros-Mehr H., Yu Y., Lee D. C., Werb Z. (2005). Mammary ductal morphogenesis requires paracrine activation of stromal EGFR via ADAM17-dependent shedding of epithelial amphiregulin. Development 132, 3923-3933. [DOI] [PMC free article] [PubMed] [Google Scholar]
- Sunnarborg S. W., Hinkle C. L., Stevenson M., Russell W. E., Raska C. S., Peschon J. J., Castner B. J., Gerhart M. J., Paxton R. J., Black R. A., et al. (2002). Tumor necrosis factor-alpha converting enzyme (TACE) regulates epidermal growth factor receptor ligand availability. J. Biol. Chem. 277, 12838-12845. [DOI] [PubMed] [Google Scholar]
- Torregrosa D., Bolufer P., Lluch A., Lopez J. A., Barragan E., Ruiz A., Guillem V., Munarriz B., Garcia Conde J. (1997). Prognostic significance of c-erbB-2/neu amplification and epidermal growth factor receptor (EGFR) in primary breast cancer and their relation to estradiol receptor (ER) status. Clin. Chim. Acta 262, 99-119. [DOI] [PubMed] [Google Scholar]
- Toyoda H., Komurasaki T., Ikeda Y., Yoshimoto M., Morimoto S. (1995a). Molecular cloning of mouse epiregulin, a novel epidermal growth factor-related protein, expressed in the early stage of development. FEBS Lett. 377, 403-407. [DOI] [PubMed] [Google Scholar]
- Toyoda H., Komurasaki T., Uchida D., Takayama Y., Isobe T., Okuyama T., Hanada K. (1995b). Epiregulin. A novel epidermal growth factor with mitogenic activity for rat primary hepatocytes. J. Biol. Chem. 270, 7495-7500. [DOI] [PubMed] [Google Scholar]
- Toyoda H., Komurasaki T., Uchida D., Morimoto S. (1997). Distribution of mRNA for human epiregulin, a differentially expressed member of the epidermal growth factor family. Biochem. J. 326, 69-75. [DOI] [PMC free article] [PubMed] [Google Scholar]
- Turner N., Pearson A., Sharpe R., Lambros M., Geyer F., Lopez-Garcia M. A., Natrajan R., Marchio C., Iorns E., Mackay A., et al. (2010). FGFR1 amplification drives endocrine therapy resistance and is a therapeutic target in breast cancer. Cancer Res. 70, 2085-2094. [DOI] [PMC free article] [PubMed] [Google Scholar]
- Ugolini F., Adelaide J., Charafe-Jauffret E., Nguyen C., Jacquemier J., Jordan B., Birnbaum D., Pebusque M. J. (1999). Differential expression assay of chromosome arm 8p genes identifies Frizzled-related (FRP1/FRZB) and Fibroblast Growth Factor Receptor 1 (FGFR1) as candidate breast cancer genes. Oncogene 18, 1903-1910. [DOI] [PubMed] [Google Scholar]
- Welm B. E., Freeman K. W., Chen M., Contreras A., Spencer D. M., Rosen J. M. (2002). Inducible dimerization of FGFR1: development of a mouse model to analyze progressive transformation of the mammary gland. J. Cell Biol. 157, 703-714. [DOI] [PMC free article] [PubMed] [Google Scholar]
- Wiesen J. F., Young P., Werb Z., Cunha G. R. (1999). Signaling through the stromal epidermal growth factor receptor is necessary for mammary ductal development. Development 126, 335-344. [DOI] [PubMed] [Google Scholar]
- Xian W., Schwertfeger K. L., Vargo-Gogola T., Rosen J. M. (2005). Pleiotropic effects of FGFR1 on cell proliferation, survival, and migration in a 3D mammary epithelial cell model. J. Cell Biol. 171, 663-673. [DOI] [PMC free article] [PubMed] [Google Scholar]
- Xian W., Schwertfeger K. L., Rosen J. M. (2007). Distinct roles of fibroblast growth factor receptor 1 and 2 in regulating cell survival and epithelial-mesenchymal transition. Mol. Endocrinol. 21, 987-1000. [DOI] [PubMed] [Google Scholar]
- Xian W., Pappas L., Pandya D., Selfors L. M., Derksen P. W., de Bruin M., Gray N. S., Jonkers J., Rosen J. M., Brugge J. S. (2009). Fibroblast growth factor receptor 1-transformed mammary epithelial cells are dependent on RSK activity for growth and survival. Cancer Res. 69, 2244-2251. [DOI] [PMC free article] [PubMed] [Google Scholar]
- Xie W., Paterson A. J., Chin E., Nabell L. M., Kudlow J. E. (1997). Targeted expression of a dominant negative epidermal growth factor receptor in the mammary gland of transgenic mice inhibits pubertal mammary duct development. Mol. Endocrinol. 11, 1766-1781. [DOI] [PubMed] [Google Scholar]
- Yuen T., Zhang W., Ebersole B. J., Sealfon S. C. (2002). Monitoring G-protein-coupled receptor signaling with DNA microarrays and real-time polymerase chain reaction. Methods Enzymol. 345, 556-569. [DOI] [PubMed] [Google Scholar]
- Zhou W., Hur W., McDermott U., Dutt A., Xian W., Ficarro S. B., Zhang J., Sharma S. V., Brugge J., Meyerson M., et al. (2010). A structure-guided approach to creating covalent FGFR inhibitors. Chem. Biol. 17, 285-295. [DOI] [PMC free article] [PubMed] [Google Scholar]
- Zhu Z., Kleeff J., Friess H., Wang L., Zimmermann A., Yarden Y., Buchler M. W., Korc M. (2000). Epiregulin is up-regulated in pancreatic cancer and stimulates pancreatic cancer cell growth. Biochem. Biophys. Res. Commun. 273, 1019-1024. [DOI] [PubMed] [Google Scholar]