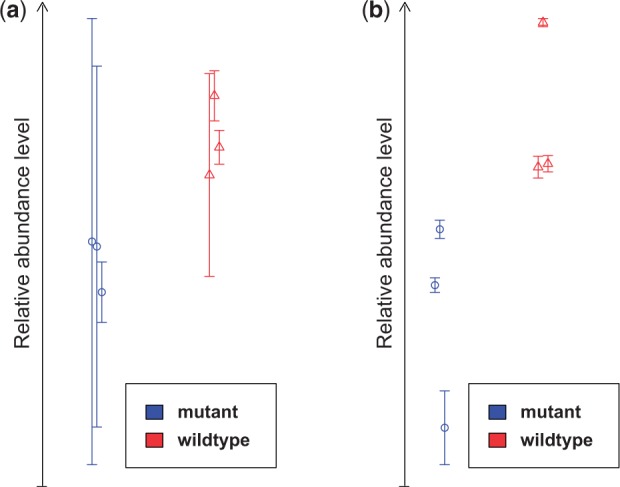
Fig. 1.

(a) Whisker plot for the top differentially abundant metabolite (l-valine) in the Arabidopsis dataset according to the eBayes approach applied to the mean-summarized replicates; (b) Whisker plot for the top differentially abundant metabolite (l-proline) according to the PPLR score (circle and triangle symbols represent the sample averages of mutant, resp. wild-type samples, vertical lines represent the technical error per biological sample)
