

Abstract
Background
Trauma to the head and neck results in a range of injuries, spanning minor lacerations to life threatening airway compromise. Few studies provide a global analysis of trauma-injuries to the head and neck region. We aim to 1) describe head and neck injury prevalence, 2) quantify procedures, and 3) investigate outcomes, including predictors of admission and mortality.
Study Design
The 2011 U.S. Nationwide Emergency Department Sample was queried for encounters with a primary diagnosis of head and neck injury, as categorized by the Barell Injury Matrix. Weighted estimates for demographic data, injury category, and mechanism were extracted. Predictors of mortality and admission were determined by multivariable logistic regression.
Results
We identified 131 million ED encounters. A weighted total of 5,418,539 visits were related to primary injuries of the head and neck. Average patient age was 30 years (SE=0.4) and 56.8% were male. Sixty-four percent of injuries were attributed to fall or blunt trauma. Open wounds comprised 41.8% of injuries. The most common procedure was laceration repair (70%). The majority of patients (97%) were discharged home. Mortality rate was less than 1%. Predictors of admission and mortality (p<0.05) included multiple trauma, trauma to blood vessels, and burns. Other risk factors included foreign body, older age, and male gender.
Conclusions
We provide a landscape analysis of U.S. head and neck trauma, including investigation of types of injuries, and risk factors for admission and mortality. These data have broad implications for surgical training and resource management.
Keywords: Otolaryngology, head and neck, trauma, injury, emergency department, surgical education
INTRODUCTION
There are over 50 million trauma-related emergency department (ED) visits in the United States each year that are estimated to cost $406 billion dollars (1, 2). The head, neck and face account for just 12% of total body surface area, yet injuries to these areas are disproportionally represented (3, 4). Injuries can range from minor soft tissue lacerations to complex facial fractures, penetrating neck wounds and cranial nerve injury. Similar to the range of injuries, the mechanism of injuries are broad and may include minor falls to armed assault and motor vehicle accidents.
Prior literature and data investigating all-comer head and neck injury-related visits to the ED are limited. In 1995, Sastry et al. characterized facial trauma in the United States using retrospective data from the Major Trauma Outcome Study (1982–1987) (3). Of the 87,174 trauma patients in the database, one third had facial trauma including fractures, blunt or penetrating injuries, most resulting from motor vehicle accidents. Recent estimates suggest the burden of trauma may be significantly greater; Allareddy et al identified 407,157 facial fracture-related ED visits in the United States in 2007, the majority of which were nasal fractures and infrequently resulted in admission (5). Using the Nationwide Emergency Department Sample, the same group identified 13,090 firearm injuries involving facial or skull fractures between 2003 and 2010 (6).
Additional studies have examined non-fracture injuries. In a prospective study of craniofacial trauma at a University Hospital in London, soft-tissue injuries of the forehead, nose, lips and chin were most common injuries to the head, face or head and frequently resulted from falls (7). Penetrating neck injuries can account for five to ten percent of traumatic injuries in adults (8). External laryngeal trauma is estimated to occur with an incidence of 1 in every 137,000 emergency department visits (9).
These and other studies, however, are limited by their focus on a specific type or mechanism of injury (4–7, 9, 10), reporting of data from a single institution (7, 11, 12), small patient cohorts (7–9) and focus on a specific population (11, 13) or geographic region (14–16). No single study provides a contemporary, epidemiological analysis of all types of head and neck injuries that are evaluated in EDs across the United States.
Herein we report national estimates for the prevalence and incidence of extra-cranial head and neck injuries in children and adults using the largest ED database in the United States, with data from over 131 million ED encounters. We provide detailed descriptive analysis of patient demographics, visit characteristics, injury type and mechanism as well as geocoding analysis to depict variation in injury patterns across the United States. We provide an overview of significant predictors of inpatient admission and death to help the consulting surgeon assess injury acuity. The data presented here are relevant to surgical education and resource management.
METHODS
This study was exempt from institutional review board approval. The 2011 Nationwide Emergency Department Sample (NEDS), published by the Healthcare Cost and Utilization Project (HCUP) and sponsored by the Agency for Healthcare Research and Quality (AHRQ), was used to estimate the national prevalence of trauma and injury to the head and neck region. NEDS is the largest publically available, all-payer ED database in the United States. It contains discharge abstracts for 29 million ED visits at 951 hospitals in 30 states and provides a twenty percent stratified sample of all hospital-based EDs in the country. Individual ED encounters can be weighted to calculate national estimates.
In NEDS, the first-listed, primary diagnosis was queried for International Classification of Diseases, Ninth Revision, Clinical Modification (ICD-9CM) codes consistent with injury to the head and neck as categorized in the Barell Injury Diagnosis Matrix (17). The Barell Matrix, published by the Centers for Disease Control and Prevention (CDC) International Collaborative Effort on Injury Statistics, categorizes injuries by body region and nature of injury using ICD-9CM codes. There are nine injury categories that contain ICD-9CM codes relevant to the head and neck: fractures, dislocations, sprains and strains (e.g. jaw sprain or nasal septum sprain), open wounds, injury to blood vessels, contusions/superficial injury, burns, injury to nerves and unspecified injuries. Intracranial and ophthalmologic injuries were excluded.
Mechanism of injury is categorized by HCUP in NEDS based on ICD-9CM external causes of injury codes (E-codes) according to established methods (18). There are eleven, non-mutually exclusive categories including injury by cutting or piercing, drowning or submersion, fall, fire/flame/hot object, firearm, machinery, motor vehicle traffic, natural or environmental causes including stings and bites, poisoning, being struck by or against something (blunt trauma), and suffocation.
Procedures performed in the ED are coded in NEDS according to ICD-9CM procedure codes. These codes were also grouped into 244 clinically meaningful categories using the HCUP Clinical Classifications Software for Services and Procedures.
Descriptive analysis was performed to characterize patient demographics (age, race, gender, national quartile for median household income of patient’s ZIP code and insurance), visit characteristics (day of week and month), hospital characteristics (teaching status, trauma designation and geographic region) and injury characteristics (Barell Matrix category and mechanism of injury). The ten most frequent diagnoses and procedures were tabulated. The incidence of head and neck injury per 100,000 US population was calculated using 2011 population estimates for the United States obtained from the US Census Bureau Population Estimates Program. Statistical weighting methods were employed to account for the sampling design of NEDS.
Patient demographics, visit, injury and hospital characteristics were compared by patient disposition. Differences in proportions were assessed using the Wald Chi-Square test and differences in means assessed by unpaired T-test. Significant predictors of admission and mortality were determined by multivariable logistic regression. Each outcome was modeled separately and was inclusive of independent variables previously listed. Statistical significance was determined by a type I error threshold of 0.05 corresponding to 95% confidence intervals. Data linkages and statistical analysis were conducted using SAS v.9.3 (SAS Institute, Cary, NC)
A choropleth map, or visually-graded representation of frequency or density within defined geographic areas, was generated to characterize variation in population-adjusted estimates for head and neck injury by region of the United States (West, Midwest, South and Northeast), as defined by the United States Census Bureau. Maps were generated using the Epi InfoTM v7.1.3 software published by the CDC.
RESULTS
There were over 131 million ED visits in 2011. A weighted total of 5,418,539 (standard deviation of weighted frequency [SD] = 116,802) visits were attributed to primary injury of the head and neck region and were included in our analysis (4.1% of all ED visits). There were 1,738 ED visits per 100,000 population with an average of 14,845 visits nationwide per day. Nearly all patients were treated and released (97.2%); a minority were admitted (N=150,148, 2.7%) or died in the ED or hospital (N=2,680, 0.1%).
Demographic statistics are summarized in Table 1. The average patient age was 30.0 years (SD=0.4), 56.8% were male and the greatest proportion were age 0–17 years (43.1%). Seventy-percent of patients were treated at a non-trauma or level III trauma hospital. Most visits occurred on a weekday (68.1%) and injury volume was greatest during summer months (June to August) (Figure 1). The highest number of injuries occurred in the geographic south of the United States (36.4%) and the least in the geographic west (18.6%) (Figure 2).
Table 1.
Barell Diagnostic Injury Matrix ICD-9CM Codes for Head and Neck Region.
| Region | ICD-9CM Codes |
|---|---|
| Head (not including traumatic brain injury) | 873 (.0–. 1,.8–.9), 941.x6, 951, 959.01 |
| Face | 802, 830, 848.0–.1, 872, 873.2–.7, 941 (.x1,.x3–.x5,.x7) |
| Neck | 807.5–.6, 848.2, 874, 925.2, 941.x8, 953.0, 954.0 |
| Head, face, and neck unspecified | 900, 910, 920, 925.1, 941.x0, .x9, 947.0, 957.0, 959.09 |
Figure 1.

Monthly variation in volume of primary head and neck injury–related visits to hospital-based emergency departments in the United States in 2011. Error bars denote standard deviation of weighted frequency.
Figure 2.

National weighted estimates for incidence of primary head and neck injuries per 100,000 population by census-defined regions of the United States.
Figure 3 illustrates the proportion of injuries by Barell injury diagnosis matrix categories. The most common type of injury was open wound (N=2,262,298, 42%). More life-threatening injuries, including fractures (N=260,559, 5%), burns (N=47,910, 1%), injury to blood vessels (N=1,565, 0.03%) and injury to nerves (N=598, 0.01%), were less common. Types of injuries varied by age group; foreign bodies were most common among pediatric patients (50%) and serious injuries including burns, fractures, injury to vessels, nerve injuries were more common among patients aged 18 to 44 years (Figure 4). The ten most frequent diagnoses are listed in Table 2. The majority of injuries were unintentional (89.5%) and 35% of patients had more than one injury diagnosis (regardless of body region). Falls (38.9%) and blunt trauma (26.2%) were the most common mechanism of injury (Table 1). Mechanism was also noted to be age-dependent with higher rates of natural or environmental causes among children and high rates of firearm related injuries among adults aged 18–44 years (Figure 5).
Figure 3.
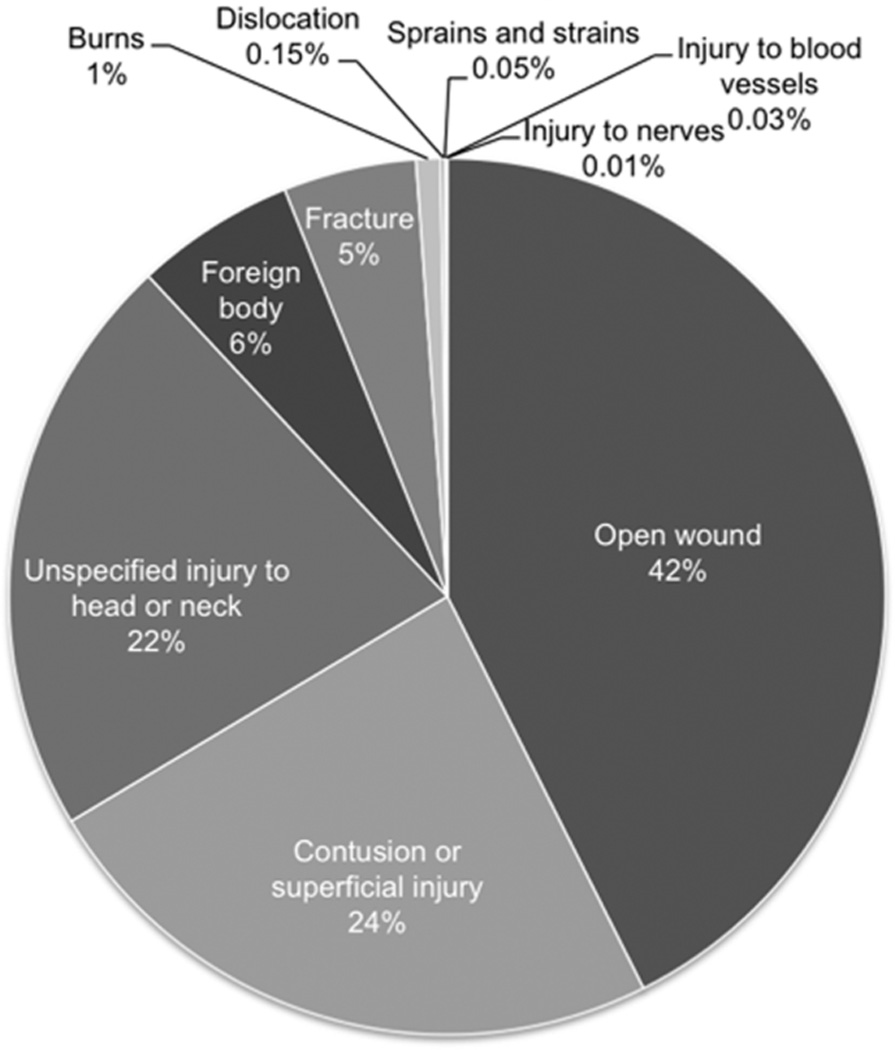
Frequency of primary head and neck injuries by Barell Injury Matrix category.
Figure 4.

Frequency of primary head and neck injury categories by age group.
Table 2.
Characteristics of ED Encounters for Primary Head and Neck–Related Injury, Stratified by Admission versus Treatment and Release.
| Weighted Frequency, % (Standard Error) | ||||
|---|---|---|---|---|
| Variable | Total (N = 5,418,539) | Admitted (N = 150,148) | Treated and Released (N = 5,265,712) | P Valuea |
| Age category | <.0001 | |||
| 0–17 | 43.1 (0.9) | 20.7 (1.2) | 43.8 (0.9) | |
| 18–44 | 28.5 (0.5) | 32.8 (0.8) | 28.4 (0.5) | |
| 45–64 | 15.1 (0.3) | 19.1 (0.4) | 13.0 (0.2) | |
| >65 | 13.2 (0.2) | 27.4 (0.9) | 14.8 (0.3) | |
| Male gender | 56.8 (0.1) | 63.4 (0.5) | 56.6 (0.2) | <.0001 |
| Patient’s residence | <.0001 | |||
| Large central, metropolitan | 27.1 (1.3) | 33.4 (2.6) | 27.0 (1.3) | |
| Large fringe, metropolitan | 24.5 (1.3) | 21.7 (1.3) | 24.6 (1.3) | |
| Median metropolitan | 21.2 (1.2) | 17.1 (1.4) | 21.7 (1.3) | |
| Small metropolitan | 8.9 (0.9) | 6.9 (0.7) | 9.0 (0.9) | |
| Micropolitan | 11.3 (0.5) | 11.6 (0.8) | 11.6 (0.8) | |
| Other | 6.9 (0.3) | 9.3 (0.6) | 6.8 (0.3) | |
| Median household income | .2146 | |||
| $1–$38,999 | 27.5 (0.9) | 29.7 (1.6) | 27.4 (0.9) | |
| $39,000–$47,999 | 25.2 (0.8) | 24.9 (0.9) | 25.2 (0.8) | |
| $48,000–$63,999 | 25.0 (0.7) | 24.3 (0.9) | 25.1 (0.7) | |
| $64,000 or more | 22.2 (1.0) | 21.1 (1.5) | 22.2 (1.0) | |
| Primary payer | <.0001 | |||
| Private insurance | 36.6 (0.6) | 30.1 (1.9) | 36.8 (0.6) | |
| Medicaid | 26.9 (0.5) | 19.1 (0.8) | 27.2 (0.5) | |
| Medicare | 16.4 (0.4) | 28.5 (0.9) | 16.1 (0.4) | |
| Self-pay | 13.7 (0.3) | 14.2 (0.8) | 13.7 (0.3) | |
| Other | 6.1 (0.2) | 7.2 (0.5) | 6.0 (0.2) | |
| No charge | 0.3 (0.1) | 0.7 (0.2) | 0.3 (0.1) | |
| Weekend visit (Sat or Sun) | 31.9 (0.1) | 33.9 (0.3) | 31.8 (0.1) | <.0001 |
| Injury characteristics | ||||
| Unintentional | 89.5 (1.0) | 85.6 (1.3) | 89.6 (1.0) | <.0001 |
| Assault | 9.9 (0.3) | 16.9 (0.8) | 9.7 (0.3) | <.0001 |
| Intended self-harm | 0.2 (0.01) | 1.9 (0.1) | 0.2 (0.01) | <.0001 |
| Multiple injuries | 35.3 (0.5) | 56.9 (1.2) | 34.7 (0.5) | <.0001 |
| Injury mechanismb | ||||
| Fall | 38.9 (0.5) | 31.8 (0.9) | 39.1 (0.5) | <.0001 |
| Blunt trauma | 26.2 (0.4) | 16.3 (1.0) | 26.5 (0.4) | <.0001 |
| Motor vehicle trafficc | 7.0 (0.1) | 11.6 (0.5) | 6.8 (0.1) | <.0001 |
| Naturec | 2.9 (0.1) | 2.4 (0.1) | 2.9 (0.05) | .0006 |
| Cut or piercing | 2.8 (0.1) | 3.6 (0.2) | 2.8 (0.1) | <.0001 |
| Fire | 0.8 (0.02) | 4.4 (0.5) | 0.7 (0.02) | <.0001 |
| Suffocation | 0.4 (0.03) | 3.2 (0.2) | 0.3 (0.03) | <.0001 |
| Firearm | 0.1 (0.01) | 1.6 (0.2) | 0.1 (0.01) | <.0001 |
| Machinery | 0.1 (0.01) | 0.2 (0.03) | 0.1 (0.01) | <.0001 |
| Poisoning | 0.1 (0.01) | 0.3 (0.03) | 0.1 (0.01) | <.0001 |
| Drowning or submersion | 0.02 (0.01) | 0.01 (0.01) | 0.02 (0.01) | .3226 |
| Hospital trauma designation: | <.0001 | |||
| Trauma level I or II | 30.3 (1.1) | 41.3 (2.4) | 29.9 (1.1) | |
| Non—trauma or level III | 69.7 (1.1) | 58.7 (2.4) | 70.1 (1.1) | |
| Hospital teaching status: | .0993 | |||
| Nonteaching, metropolitan | 42.7 (1.1) | 38.4 (3.0) | 42.8 (1.1) | |
| Teaching, metropolitan | 39.6 (1.1) | 44.4 (2.6) | 39.5 (1.1) | |
| Nonmetropolitan | 17.6 (0.6) | 17.1 (1.1) | 17.7 (0.6) | |
p value denotes level of significance for comparison between admitted and discharged patients. For independent variables with mutually exclusive categories, P value denotes results of a chi-square test of independence.
May not add to 100% as patients may have had none or more than 1 type of injury mechanism.
Motor vehicle traffic = injury involving motor vehicle traffic, including occupant of a car, motorcyclist, pedal cyclist, pedestrian, or unspecified person; nature = injury involving natural or environmental causes, including bites and stings.
Figure 5.

Frequency of primary head and neck injury mechanism by age group.
Twenty-four percent of patients underwent a diagnostic or therapeutic procedure in the ED (Table 3). Over half of these patients underwent laceration repair. Complex laceration repair of the eyelid/eyebrow, lip, nose, and external ear was performed in 205,188 patients. Non-operative foreign body retrieval in the ED was performed in 66,001 patients. Diagnostic imaging occurred infrequently; computerized axial tomography of the head was obtained 57,006 patients and plain film X-ray of facial bones was obtained in 6,890 patients.
Table 3.
List of 10 Most Common Diagnoses among Patients with Primary Head and Neck Injuries.
| All Patients N = 5,418,539 |
||
|---|---|---|
| Diagnosis (ICD-9CM) | Weighted Frequency | Percentage (SE) |
| Unspecified head injury (959.01) | 1,155,519 | 21.3 (0.5) |
| Contusion of face, scalp, or neck (920) | 960,261 | 17.7 (0.3) |
| Open wound of forehead (873.42) | 647,369 | 11.9 (0.1) |
| Open wound of scalp (873.0) | 527,249 | 9.7 (0.1) |
| Open wound of lip (873.34) | 285,701 | 5.3 (0.1) |
| Abrasion of head (910.0) | 212,287 | 3.9 (0.1) |
| Open wound of jaw (874.44) | 179,424 | 3.3 (0.1) |
| Nasal bone fracture, closed (802.0) | 132,915 | 2.5 (0.1) |
| Open wound of face, not otherwise specified (873.40) | 127,580 | 2.4 (0.1) |
| Foreign body in ear (931) | 114,772 | 2.1 (0.1) |
Patient demographic, visit and injury characteristics were compared between patients who were admitted versus treated and released. Bivariable comparisons are presented in Table 1. Several predictors of inpatient admission were identified in multivariable logistic regression modeling. Odds ratios and significance levels are listed in Table 5. Notably, demographic predictors included male gender and older age. Visit characteristics included weekend visit and trauma level I or II hospital (versus non-trauma or level III trauma hospital). Several injury categories predicted inpatient admission (all compared to reference category of open wound): burns, injury to blood vessels, foreign body, fractures and injury to nerves. Additionally, patients with multiple injuries and patients sustaining injuries from self-harm or from assault were at significantly greater odds of admission. Finally, injuries resulting from motor vehicle traffic, natural or environmental causes, cut or piercing and suffocation were more likely to result in admission.
Significant predictors of mortality are listed in Table 5. They included male gender, older age, injury to blood vessels, burns, injuries resulting from self-harm, and injuries resulting from motor vehicle traffic, suffocation, firearms, and machinery.
DISCUSSION
This study provides a contemporary, landscape analysis of all-comer, extra-cranial, head and neck injury-related visits to hospital-based EDs in the United States based on data extracted from the largest, all-payer ED database. There were over five million injuries in 2011, the majority of which were open wounds resulting from falls or blunt trauma, which infrequently resulted in hospital admission or death. Multiple surgical specialties are involved in the management of head and neck injuries including general surgery, otolaryngology-head and neck surgery, plastic surgery and oral and maxillofacial surgery. The consulting surgeon and surgical trainee should be armed with the knowledge of primary injuries to expect, have adequate training to provide expertise in non-operative procedures in the ED and be able to anticipate what injuries or patient factors are associated with higher risk of death or admission to the hospital.
Several epidemiological patterns were observed. As expected, head and neck injuries occur more frequently among males and in the spring and summer months. This data is consistent with gender biases and seasonal variation observed in general trauma studies (1) and epidemiological surveys of traumatic brain injury (19). While existing literature has focused on complex trauma, including facial fractures and penetrating neck injuries, this report finds, not surprisingly, that minor injuries such as lacerations are common and typically occur from unintentional falls and blunt trauma. This is consistent with prior studies surveying head and neck injuries in the United Kingdom (7), 2010 injury statistic data compiled by the CDC National Center for Injury Prevention and Control (20) as well as survey responses on trauma practice patterns reported by academic and private otolaryngologists (21). Geographically, the incidence of head and neck injuries was greatest in the South, which may reflect increased injury burden or variable ED utilization patterns.
More acute trauma (burns, fractures, injury to blood vessels and nerves) occurred less frequently and comprised less than seven percent of all injuries. Our data may underestimate injuries resulting from penetrating neck trauma involving the carotid artery or jugular vein, as many of these patients are dead on arrival to the ED (8). The prevalence of facial fractures is lower than reported by Allareddy et al (6) in their analysis of the 2007 NEDS database, which identified craniofacial fractures coded in any of the 15 diagnostic columns provided and did not exclude intracranial injuries. However, the present report queried only primary injuries attributed to the head, face or neck to ensure regression results predicting mortality and admission could be attributed solely to head and neck injuries.
There were several notable age-related trends based on injury category and injury mechanism. Acute injuries, such as burns, fractures, nerve and vessel injuries, occurred more frequently in young adult and middle-aged individuals (18–65 years), suggesting greater risk-prone behaviors among this population. While the average age of patients was 30 years, pediatric patients were the largest proportion of patients represented in our cohort; they commonly presented to the ED with foreign bodies and generally did not have life-threatening injuries, consistent with prior studies (REF). Falls were the most common cause of injury and had a bimodal distribution among children (aged 0–17 years) and the elderly (greater than 65 year).
Predictors of admission and mortality have been studied in general trauma patients, however they have not been reported for all-comer head and neck injuries. Injury to blood vessels and burns were identified as significant predictors of death. We were unable to determine burn severity, however the association between burns and death may also reflect concomitant smoke inhalation injury which is independently associated with significantly higher morbidity and mortality (22). Injury to neck vessels has previously been associated with a high mortality, likely due to exsanguination (8).
Mechanism of injury is important to ascertain when predicting outcomes for patients with head and neck injuries. Consistent with general trauma cases, motor vehicle accidents, suffocation and injuries incurred by firearms or machinery significantly predicted admission and mortality. Injuries inflicted with the intention of self-harm also significantly predicted death, consistent with the notion that suicidal intent often proves fatal. Socioeconomic factors such as location of patient residence, insurance and median income quartile were not associated, despite established associations between socioeconomic disparities and increased risk of morbidity and mortality in general trauma series (23). Similar to general trauma findings, however, older age and male gender were associated with mortality (24).
Predictors of admission were less discrete. Several demographic factors were associated including male gender, older age, location of patient residence and insurance type. Rural residents may be more at higher odds of admission due to convenience rather than acuity of injury. Notably, uninsured patients who self-paid were at significantly lower odds of admission than patients who had Medicare suggesting that financial barriers may prevent additional medical care. Patients who visited the ED on the weekend (versus Monday through Friday) were at higher odds of admission. It is plausible that higher acuity injuries occurred during the weekend when large proportion of the population is away from work or not in school, or may reflect inadequate surgical staffing in the ED. Patients triaged at trauma level I or II hospitals were more likely to be admitted, likely because they had higher acuity injuries and were intentionally transported to these facilities for more advanced level care. There was no association between hospital teaching status and admission, or mortality, suggesting there are no significant disparities in level of care between these types of institutions.
Taken together, regression results suggest that consulting surgeons should anticipate investing greater time and effort in triaging and managing patients with burns, injury to blood vessels or nerves, and fractures. Additionally, increased resources and attention should be given to patients with injuries incurred by self-harm, suffocation, firearms, or machinery as these frequently result in admission or death.
Our study has implications for surgical training and resource management. There is concern about decreased head and neck trauma experience for residents in otolaryngology-head and neck surgery, plastic surgery and oral maxillofacial surgery (21, 25, 26). In a survey of 444 junior academic and private otolaryngologists, respondents cited concern about inadequate residency training in vascular, facial nerve and laryngotracheal injuries (21). Treatment of facial fractures is listed among the key indicator cases for otolaryngology, plastic surgery and oral and maxillofacial surgery residency training. The volume of acute injuries that may require operative intervention, such as facial fractures, injury to blood vessels and nerves, appear to be low (less than 7% of all injuries that present to the ED). Absolute numbers, however, are comparable to prior studies and suggest relatively stable volumes.
It is important to note, however, that surgical specialties play an integral role in non-operative procedures in the ED. In general surgery, the management of trauma patients with solid abdominal injuries has become increasingly non-operative and graduating residents frequently do not attain the minimum required number of operative trauma cases (27). Based on data reported here, surgical residents representing head and neck specialties may, more often than not, be asked to repair complex lacerations of the lips, nose, eyebrow/eyelid and external ear. Indeed, one of the many challenges in the management of head and neck wounds is providing patients with good cosmetic result; emphasizing training and skills in this area may be particularly valuable.
The prevalence of foreign body, particularly among children, was greater than 300,000 patients. Residents should be competent in diagnosing and retrieving foreign body objects from the nose, ear, oral cavity, upper airway and upper digestive tract. Residency review committees, charged with developing standardized surgical training curricula, may consider modifying trauma experience guidelines to account for contemporary trauma patterns and trends.
In terms of resource management, care of patients sustaining head and neck trauma and injuries is shared by multiple specialties, however many surgeons, including general trauma surgeons, have expressed concern about including trauma coverage as part of their daily practice (28). The severe shortage of on-call specialists has already become apparent in states like Oregon where 48% of hospitals are no longer able to provide continuous coverage for at least one specialty (29). Junior otolaryngologists primarily cite inadequate reimbursement and lack of practice guidelines as obstacles to the inclusion of trauma care in their ideal practice (21). In this report, we found that the burden of all-comer head and neck injuries (4% of all ED visits) is high, and will likely increase as more Americans are insured. Therefore, surgical societies may consider revisiting these issues, such as reimbursement and practice guidelines, to ensure high level head and neck trauma care in the future.
There are several limitations to this study. As with all large, retrospective database studies, this study is limited in its ability to account for unknown confounders. Discharge abstracts are interpreted and coded by independent reviewers and are subject to their individual biases. Injuries are classified in the study according to the Barell Injury Diagnosis Matrix that precludes a more detailed analysis of specific injury types. However, for such a broad overview study we felt it was an appropriate method for communicating and simplifying national trends and patterns. Only the first listed diagnostic code was queried in order to identify primary injuries of the head and neck region, therefore the estimates published in this report may conservatively estimate the total burden of head and neck injuries in the United States. Socioeconomic disparities have been previously associated with differences in trauma care outcomes. While we were able to account for insurance, median household income and location of patient residence, we were unable to account for race as this data was not provided in NEDS.
CONCLUSIONS
This study provides a contemporary, landscape analysis of head and neck injuries and trauma in the United States. In 2011, there were over 5 million injuries that ranged in severity from minor lacerations to penetrating wounds. These injuries infrequently result in admission to a hospital or death. Significant predictors of inpatient admission or death include injury to blood vessels, burns, motor vehicular trauma and injury from machinery, male gender, and older age. The results presented here are widely applicable to multiple surgical specialties and have vast implications for surgical education, resource management and injury prevention.
Table 4.
List of Top 10 Non-Imaging Procedures Performed in the ED.
| All Patients Who Underwent Procedure in ED N = 1,293,887 |
||
|---|---|---|
| Procedure (ICD-9CM code) | Weighted Frequency | Percentage (SE) |
| Laceration repair of open wound (86.59) | 702,843 | 54.3 (1.4) |
| Laceration repair of eyelid/eyebrow (08.81) | 85,476 | 6.6 (0.3) |
| Laceration repair of lip (27.51) | 77,923 | 6.0 (0.3) |
| Intraluminal foreign body removal (98.11) | 34,325 | 2.7 (0.1) |
| Laceration repair of nose (21.81) | 23,786 | 1.8 (0.1) |
| Laceration repair of external ear (18.4) | 18,003 | 1.4 (0.1) |
| Removal of foreign body from nose (98.12) | 15,293 | 1.2 (0.1) |
| Application of splint (93.54) | 9347 | 0.7 (0.06) |
| Esophagogastroduodenoscopy (45.13) | 9503 | 0.7 (0.05) |
| Other repair and reconstruction of skin and subcutaneous tissue (86.89) | 8058 | 0.6 (0.1) |
ACKNOWLEDGEMENTS
None
FUNDING:
None
Footnotes
PRESENTATION:
Pending
DISCLOSURES:
R.K.V.S., E.D.K., D.J.L., M.G.S., S.T.G. have no conflicts of interest to report.
REFERENCES
- 1.Mackenzie EJ, Rivara FP, Jurkovich GJ, et al. The National Study on Costs and Outcomes of Trauma. J Trauma. 2007 Dec;63(6 Suppl):S54–S67. doi: 10.1097/TA.0b013e31815acb09. discussion S81–6. [DOI] [PubMed] [Google Scholar]
- 2.Corso P, Finkelstein E, Miller T, Fiebelkorn I, Zaloshnja E. Incidence and lifetime costs of injuries in the United States. Inj Prev. 2006 Aug;12(4):212–218. doi: 10.1136/ip.2005.010983. [DOI] [PMC free article] [PubMed] [Google Scholar]
- 3.Sastry SM, Sastry CM, Paul BK, Bain L, Champion HR. Leading causes of facial trauma in the major trauma outcome study. Plast Reconstr Surg. 1995 Jan;95(1):196–197. doi: 10.1097/00006534-199501000-00039. [DOI] [PubMed] [Google Scholar]
- 4.Wade AL, Dye JL, Mohrle CR, Galarneau MR. Head, face, and neck injuries during Operation Iraqi Freedom II: results from the US Navy-Marine Corps Combat Trauma Registry. J Trauma. 2007 Oct;63(4):836–840. doi: 10.1097/01.ta.0000251453.54663.66. [DOI] [PubMed] [Google Scholar]
- 5.Allareddy V, Allareddy V, Nalliah R. Epidemiology of Facial Fractures. Journal of Oral and Maxillofacial Surgery. 2011;69(10):2613–2618. doi: 10.1016/j.joms.2011.02.057. [DOI] [PubMed] [Google Scholar]
- 6.Allareddy V, Nalliah R, Lee MK, Rampa S. Impact of Facial Fractures and Intracranial Injuries on Hospitalization Outcomes Following Firearm Injuries. JAMA Otolaryngol Head Neck Surg. 2014 Mar 6; doi: 10.1001/jamaoto.2014.61. [DOI] [PubMed] [Google Scholar]
- 7.Hussain K, Wijetunge DB, Grubnic S, Jackson IT. A comprehensive analysis of craniofacial trauma. J Trauma. 1994 Jan;36(1):34–47. doi: 10.1097/00005373-199401000-00006. [DOI] [PubMed] [Google Scholar]
- 8.Demetriades D, Skalkides J, Sofianos C, Melissas J, Franklin J. Carotid artery injuries: experience with 124 cases. J Trauma. 1989 Jan;29(1):91–94. [PubMed] [Google Scholar]
- 9.Jewett BS, Shockley WW, Rutledge R. External laryngeal trauma analysis of 392 patients. Arch Otolaryngol Head Neck Surg. 1999 Aug;125(8):877–880. doi: 10.1001/archotol.125.8.877. [DOI] [PubMed] [Google Scholar]
- 10.McMullin BT, Rhee JS, Pintar FA, Szabo A, Yoganandan N. Facial fractures in motor vehicle collisions: epidemiological trends and risk factors. Archives of facial plastic surgery. 2009 May-Jun;11(3):165–170. doi: 10.1001/archfacial.2009.11. [DOI] [PubMed] [Google Scholar]
- 11.Lim LH, Kumar M, Myer CM., 3rd Head and neck trauma in hospitalized pediatric patients. Otolaryngology--head and neck surgery : official journal of American Academy of Otolaryngology-Head and Neck Surgery. 2004 Feb;130(2):255–261. doi: 10.1016/j.otohns.2003.11.010. [DOI] [PubMed] [Google Scholar]
- 12.Gassner R, Tuli T, Hachl O, Rudisch A, Ulmer H. Cranio-maxillofacial trauma: a 10 year review of 9,543 cases with 21,067 injuries. Journal of cranio-maxillo-facial surgery : official publication of the European Association for Cranio-Maxillo-Facial Surgery. 2003 Feb;31(1):51–61. doi: 10.1016/s1010-5182(02)00168-3. [DOI] [PubMed] [Google Scholar]
- 13.Imahara SD, Hopper RA, Wang J, Rivara FP, Klein MB. Patterns and outcomes of pediatric facial fractures in the United States: a survey of the National Trauma Data Bank. J Am Coll Surg. 2008 Nov;207(5):710–716. doi: 10.1016/j.jamcollsurg.2008.06.333. [DOI] [PMC free article] [PubMed] [Google Scholar]
- 14.Bring G, Bjornstig U, Westman G. Gender patterns in minor head and neck injuries: an analysis of casualty register data. Accid Anal Prev. 1996 May;28(3):359–369. doi: 10.1016/0001-4575(96)00002-4. [DOI] [PubMed] [Google Scholar]
- 15.Bener A, Rahman YS, Mitra B. Incidence and severity of head and neck injuries in victims of road traffic crashes: In an economically developed country. Int Emerg Nurs. 2009 Jan;17(1):52–59. doi: 10.1016/j.ienj.2008.07.007. [DOI] [PubMed] [Google Scholar]
- 16.Zargar M, Khaji A, Karbakhsh M, Zarei MR. Epidemiology study of facial injuries during a 13 month of trauma registry in Tehran. Indian J Med Sci. 2004 Mar;58(3):109–114. [PubMed] [Google Scholar]
- 17.Barell V, Aharonson-Daniel L, Fingerhut LA, et al. An introduction to the Barell body region by nature of injury diagnosis matrix. Inj Prev. 2002 Jun;8(2):91–96. doi: 10.1136/ip.8.2.91. [DOI] [PMC free article] [PubMed] [Google Scholar]
- 18.Finkelstein E, Corso P, Miller T. Incidence and economic burden of injuries in the United States. New York, NY: Oxford University Press; 2000. [Google Scholar]
- 19.Bruns J, Jr, Hauser WA. The epidemiology of traumatic brain injury: a review. Epilepsia. 2003;44(Suppl 10):2–10. doi: 10.1046/j.1528-1157.44.s10.3.x. [DOI] [PubMed] [Google Scholar]
- 20.CDC. National estimates of the ten leading causes of nonfatal injuries. [Accessed March 14, 2014]; Available at: http://www.cdc.gov/injury/wisqars/pdf/National_Estim_10_Leading_Causes_Nonfatal_Injuries_Tx_Hospital-ED_US2010-a.pdf.
- 21.McCusker SB, Schmalbach CE. The otolaryngologist's cost in treating facial trauma: American Academy of Otolaryngology--Head and Neck Surgery survey. Otolaryngology--head and neck surgery : official journal of American Academy of Otolaryngology-Head and Neck Surgery. 2012 Mar;146(3):366–371. doi: 10.1177/0194599811429007. [DOI] [PubMed] [Google Scholar]
- 22.Cancio LC. Airway management and smoke inhalation injury in the burn patient. Clin Plast Surg. 2009 Oct;36(4):555–567. doi: 10.1016/j.cps.2009.05.013. [DOI] [PubMed] [Google Scholar]
- 23.Haider AH, Chang DC, Efron DT, Haut ER, Crandall M, Cornwell EE, 3rd, et al. Race and insurance status as risk factors for trauma mortality. Arch Surg. 2008 Oct;143(10):945–949. doi: 10.1001/archsurg.143.10.945. [DOI] [PubMed] [Google Scholar]
- 24.Sauaia A, Moore FA, Moore EE, et al. Epidemiology of trauma deaths: a reassessment. J Trauma. 1995 Feb;38(2):185–193. doi: 10.1097/00005373-199502000-00006. [DOI] [PubMed] [Google Scholar]
- 25.Lee LN, Bhattacharyya N. Contemporary trends in procedural volume for adult facial trauma, 1996–2006. Otolaryngology--head and neck surgery : official journal of American Academy of Otolaryngology-Head and Neck Surgery. 2012 Feb;146(2):226–229. doi: 10.1177/0194599811427825. [DOI] [PubMed] [Google Scholar]
- 26.Eckert M, Cuadrado D, Steele S, Brown T, Beekley A, Martin M. The changing face of the general surgeon: national and local trends in resident operative experience. American journal of surgery. 2010 May;199(5):652–656. doi: 10.1016/j.amjsurg.2010.01.012. [DOI] [PubMed] [Google Scholar]
- 27.Bulinski P, Bachulis B, Naylor DF, Jr, Kam D, Carey M, Dean RE. The changing face of trauma management and its impact on surgical resident training. J Trauma. 2003 Jan;54(1):161–163. doi: 10.1097/00005373-200301000-00020. [DOI] [PubMed] [Google Scholar]
- 28.Cohn SM, Price MA, Villarreal CL. Trauma and surgical critical care workforce in the United States: a severe surgeon shortage appears imminent. J Am Coll Surg. 2009 Oct;209(4):446–452. e4. doi: 10.1016/j.jamcollsurg.2009.06.369. [DOI] [PubMed] [Google Scholar]
- 29.McConnell KJ, Johnson LA, Arab N, Richards CF, Newgard CD, Edlund T. The on-call crisis: a statewide assessment of the costs of providing on-call specialist coverage. Ann Emerg Med. 2007 Jun;49(6):727–733. 33 e1–33 e18. doi: 10.1016/j.annemergmed.2006.10.017. [DOI] [PubMed] [Google Scholar]