


Abstract
The formation of skeletal muscles is associated with drastic changes in protein requirements known to be safeguarded by tight control of gene transcription and mRNA processing. The contribution of regulation of mRNA translation during myogenesis has not been studied so far. We monitored translation during myogenic differentiation of C2C12 myoblasts, using a simplified protocol for ribosome footprint profiling. Comparison of ribosome footprints to total RNA showed that gene expression is mostly regulated at the transcriptional level. However, a subset of transcripts, enriched for mRNAs encoding for ribosomal proteins, was regulated at the level of translation. Enrichment was also found for specific pathways known to regulate muscle biology. We developed a dedicated pipeline to identify translation initiation sites (TISs) and discovered 5333 unannotated TISs, providing a catalog of upstream and alternative open reading frames used during myogenesis. We identified 298 transcripts with a significant switch in TIS usage during myogenesis, which was not explained by alternative promoter usage, as profiled by DeepCAGE. Also these transcripts were enriched for ribosomal protein genes. This study demonstrates that differential mRNA translation controls protein expression of specific subsets of genes during myogenesis. Experimental protocols, analytical workflows, tools and data are available through public repositories (http://lumc.github.io/ribosome-profiling-analysis-framework/).
INTRODUCTION
Myogenesis, the formation and maintenance of skeletal muscles, occurs during embryogenesis and muscle regeneration. During embryonic development, muscle progenitor cells are committed to the myogenic program and become myoblasts. Myoblasts fuse to form multinucleated myotubes, which will give rise to muscle fibers. During muscle regeneration, the process is similar. Satellite cells are differentiated into myoblasts, which can fuse with existing myotubes to repair the adult muscle tissue (1).
The molecular mechanisms controlling myogenesis at the transcriptional level are well characterized. Several myogenic transcription factors, including MYF5, MYOD1, MYOG, MEF2 and MYF6, are expressed at different stages of myogenesis to tightly control the transcription of numerous muscle-specific genes encoding contractile proteins and to reorganize cell metabolism (2,3).
Less is known about the control of myogenesis at the level of mRNA translation. Several mechanisms enhance or repress translation through RNA binding proteins or miRNAs (4,5). The presence of translational enhancers able to interact with translation initiation complexes and increase protein synthesis have been reported also in the context of skeletal muscle differentiation, where they target crucial differentiation factors (6). However, a genome wide overview of translational regulation, as it exists for transcription (7), is missing. Therefore we set out to investigate control of mRNA translation during myogenesis, with a focus on translation initiation.
Regulation at the translational level defines not only the abundance of a protein, but also the identity through the use of alternative translation initiation sites (TISs). Translation can initiate upstream or downstream of the primary open reading frame (pORF). TISs located in the 5′ untranslated region (5′-UTR) of a transcript may give rise to upstream open reading frames (uORFs) or protein isoforms with extended N-termini (8). Translation of the uORF may have various consequences for the translation of the pORF: uORFs may repress translation, induce translation of protein isoforms truncated at their N-termini or even enhance translation of the pORF (9–19). TISs located in the coding region of the pORF may give rise to N-terminal truncated isoforms, with possibly different biological functions (20). The complexity of the translatome is further increased by the presence of dual coding regions, nucleotide sequences that can be translated in more than one reading frame (21). Recent studies based on ribosome footprint profiling have reported extensive regulation of protein expression at the translational level, in particular as a part of stress responses, but also under normal physiological conditions (8,22,23). Translational regulation is mostly exerted at the level of translation initiation, whereas translational elongation rates are more constant across conditions (22,24–27). In mammals, between 50 and 65% of transcripts have been reported to contain at least two TISs (8,24,26), more than 50% of which are located upstream of the pORF. Nonetheless, to what extent gene expression is regulated at translational level is still being debated. A major role for translational regulation was hinted by studies that found a poor correlation between total mRNA and protein levels (20% (28) or no more than 40% (29–33)). However, other studies reported a much higher correlation (up to 80% (34)) and suggested that previously observed discrepancies between mRNA and protein levels were mainly of technical nature. Nevertheless, there is a role for translational regulation, at least for subsets of (functionally linked) proteins (35).
To explore how and to what extent myogenesis is regulated at translational level in mammalian skeletal muscles, we monitored translation at nucleotide resolution in a genome-wide high-throughput manner, using ribosome profiling on the murine C2C12 cell line, a model for skeletal muscle differentiation. Ribosome profiling (25) is a method based on deep-sequencing of ribosome-protected mRNA fragments that are recovered from mRNAs engaged by ribosomes, after digestion of non-protected regions of the mRNAs. Even though the ribosome profiling technique has been standardized and used in several studies (24,26,36,37), the isolation and sequencing of the ribosome footprints is laborious and the analysis represents a challenge due to short read length and noise surrounding genuine TISs. We simplified the existing protocol and developed a data analysis pipeline to characterize translation initiation during differentiation of myoblasts into myotubes, to detect switches in the use of alternative TISs, as well as to quantify translation. We further investigated the extent of translational control over transcriptional control by comparing ribosome profiling data with RNAseq, miRNA-seq and DeepCAGE data. miRNA-seq data was used to investigate the contribution of miRNAs in the regulation of gene expression at translational level. DeepCAGE data was used to identify transcription start sites (TSSs) and detect switches in the use of alternative promoters; this allowed us to discriminate between switches in TISs usage due to changes in the transcriptome and switches purely controlled during translation.
MATERIALS AND METHODS
Cell culture
Mouse myoblasts C2C12 were grown on collagen-coated plates in Dulbecco's modified Eagle medium (DMEM) supplemented with 10% fetal bovine serum (FBS), 1% glucose and 2% glutamax (Invitrogen). Differentiation was induced by serum deprivation for 7 days, by culturing in DMEM supplemented with 2% FBS, 1% glucose and 2% glutamax. Cells were grown under 10% CO2.
Ribosome footprint profiling, DeepCAGE, RNAseq and miRNAseq sequencing libraries
Ribosome footprints libraries were prepared starting from 5 million C2C12 cells, seeded in 10 cm dishes. After 24 h in proliferation phase, myoblasts were treated with 100 μg/ml cycloheximide (C7698-1G, Sigma) for 10 min or with 2 μg/ml harringtonin (sc-204771A, Santa Cruz Biotechnology) for 5 min followed by 10 min of cycloheximide treatment. Same treatment was performed in myotubes, after 7 days of serum deprivation. After drug treatment at 37°C, dishes were transferred on ice and cells were washed with ice-cold phosphate buffered saline supplemented with 100 μg/ml cycloheximide. Cells lysis was performed using 1 ml ice-cold lysis buffer (1× salt buffer [10× solution contained 100 mM Tris, 120 mM MgCl2, 1.4 M NaCl, pH 7.4], 0.5% IGEPAL) supplemented with RnaseOUT (500 U/ml, Invitrogen), dithiothreitol (DDT) (1.5 mM), cOmplete Protease Inhibitor Cocktail (40 μl of 25× stock, Roche) and cycloheximide (100 μg/ml). Nuclei were removed by centrifugation at 13 000 rpm in a FA-45-30-11 rotor (18 000 g) for 10 min. Supernatant was digested with RnaseI (1500U/ml, Ambion) for 30 min at room temperature. Digestion was blocked with SuperaseIN (600U/ml, Ambion) and lysate was layered on frozen sucrose gradients (7–46% sucrose) and separated by ultracentrifugation at 35 000 rpm in a SW 41 Ti rotor (210 000 g) for 3 h at 4°C. Twelve fractions (750 μl each) were collected from the top and digested with proteinase K (0.15 mg/750 μl) for 30 min at 42°C in the presence of 1% sodium dodecyl sulphate. RNA was extracted by acid phenol (Ambion) purification followed by ethanol precipitation. For each sucrose gradient separation, an undigested lysate was used to monitor the polysome profile, determined on the Bioanalyzer (Agilent) with the RNA 6000 Nano kit. Fractions containing monosomes (corresponding to fractions nine and ten) were combined. Cytoplasmic rRNAs and mitochondrial rRNAs were removed using Ribo-Zero Magnetic Gold Kit (Epicentre) according to manufacturer's instructions, with the following modifications: removal solution was incubated for 4 min at 68°C prior RNA addition, then mixed with RNA and kept at 37°C for 15 min; RNA hybridized to removal solution was incubated with magnetic beads at room temperature for 5 min, followed by 1 min at 50°C and 4 min at 37°C. Size selection of footprints with length 28–32 nt was performed on 15% TBE-urea gel (Invitrogen). Footprints were dephosphorylated with T4 polynucleotide kinase (10U, NEB) and ligated to double stranded RNA adapters at both ends (SOLID Total RNA-Seq Kit, Ambion). RNA was reverse transcribed and amplified using indexed custom primers adapted for Illumina Hiseq 2000 (5′-AATGATACGGCGACCACCGATGGGCAGTCGGTGAT-3′, 5′-GCGGAACCGGCATGTCGTC|index|AGCATACGGCAGAAGACGAA-3′). Sequencing libraries were size selected for amplicons of 120 bps on 4–12% polyacrylamide gel electrophoresis gel (Novex TBE, Life Technologies). A total of twelve strand specific libraries were pooled and sequenced in one lane. Single end sequencing was performed on the Illumina Hiseq2000 for 50 cycles. The complete protocol is available in the extended experimental procedures.
DeepCAGE libraries were prepared as described previously (38).
Strand specific RNAseq libraries were generated using the method described by Parkhomchuk et al. (39) with minor modifications. In short, mRNA was isolated from 500 ng total RNA using oligo-dT Dynabeads (Life Technologies) and fragmented to 150–200 nt in first strand buffer for 3 min at 94°C. First strand cDNA was generated using random primers. Second strand was generated using dUTP instead of dTTP to tag the second strand. Subsequent steps to generate the sequencing libraries were performed with the NebNext kit for Illumina sequencing with the following modifications: after adapter ligation to the dsDNA fragments, libraries were treated with USER enzyme (NEB M5505L) in order to digest the second strand derived fragments. Amplified libraries were pooled and sequenced in one single lane. Paired-end (2 × 100 bps) sequencing was performed on the Illumina HiSeq2000. miRNAseq libraries were prepared starting from purified small RNAs isolated with mirVana miRNA Isolation kit (Ambion) according to manufacturer's instructions. Sequencing libraries were prepared according to the method previously described (40) and single-end sequencing was performed on the Illumina Genome Analyzer II.
Protein isolation and western blot analysis
Protein isolation was performed starting from cell pellet recovered from 75 cm2 flasks. Cell pellet was resuspended in 500 μl of protein lysis buffer (50 mM HEPES, 50CmM NaCl, 10 mM ethylenediaminetetraacetic acid, 10 mM dithiothreitol (DTT), 0.1% 3-((3-Cholamidopropyl)dimethylammonium)-1-propanesulfonate (CHAPS), Complete Mini Protease inhibitor cocktail tablet (Roche)). Cell lysate was sonicated with ultrasound (5 s at amplitude 60 for three times) and incubated for 1 h at 4°C while rotating. Supernatant was recovered after centrifugation at 14 000 rpm in a FA-45–30–11 rotor (20 800 g) for 15 min at 4°C. Protein concentration was assessed using BCA Protein Assay kit (Pierce) according to manufacturer's instructions. Protein separation was performed on 18% Criterion TGX Gel (Bio-Rad) in 1× XT Tricine running buffer. A total of 30 μg of protein lysate were heat denatured in 2× Laemmli sample buffer (95°C for 5 min) prior loading. Proteins were transferred with Trans-Blot turbo transfer system (Bio-Rad) on a nitrocellulose membrane (0.2 μm Trans blot turbo, Bio-Rad). The following primary antibodies were used: rabbit anti-RPL7 antibody (Bethyl, 1:2000), rabbit anti-RPS15 middle region (Aviva System Biology, 1:1000), rabbit anti-RPL34 (Abcam, 1:1000), anti-beta Actin (Abcam, 1:5000). RPL7, RPS15 and RPL34 were detected using goat anti-rabbit secondary antibody (IRDye800CW, Licor,1:5000), b-Actin was detected using goat anti-mouse secondary antibody (IRDye680CW, Licor, 1:5000). Signals were visualized with the Odyssey Infrared Imaging Sistem (LI-Cor Biosciences).
Data analysis
Mapping of ribosome footprints, DeepCAGE and RNAseq reads
Ribosome footprints reads were aligned to both transcriptome and genome references using a combined approach. Reads were first aligned to a transcriptome reference using Bowtie (41,42), with the following parameters: -k 1 -m 20 -n 1, –best –strata –norc. An index transcriptome reference was built based on RefSeq RNA sequences (ftp://ftp.ncbi.nlm.nih.gov/refseq/M_musculus/mRNA_Prot/ last modified 2013/05/08). Unmapped reads were then mapped to the GRCm38/mm10 genome reference using Bowtie with the following parameters: -k 1 -m 2 -n 1 –best –strata. For each SAM file, reads shorter than 25 nt were filtered out. SAM files were converted into a wiggle format, in which only the 5′ end of each read was reported. For SAM files obtained from the transcriptome alignment, transcriptomic coordinates were converted into genomic coordinates and stored into a wiggle format. Wiggle files are available at http://gwips.ucc.ie/.
To retrieve corresponding genomic coordinates, we first mapped RefSeq RNA sequences (the same used to build the transcriptome reference) to the GRCm38/mm10 genome assembly using GMAP (43), with the following parameters: -f samse -n0. The corresponding genomic coordinates were used to convert the transcriptomic coordinates of the mapped footprint reads. RefSeq RNA sequences which mapped to the genome with insertions and/or deletions (introns excluded) were not included when building the transcriptome reference. Wiggle files of each alignment containing the 5′ ends of reads mapped were then merged.
DeepCAGE reads were trimmed to 27 nt and the first nucleotide at the 5′ end was removed. Trimmed reads were aligned to the GRCm38/mm10 genome reference, with the following parameters: -m 10 -k 10 -n 2 –best –strata. For CAGE tags mapping to multiple genomic locations, we applied a weighting strategy, based on the number of CAGE tags within a 200 bp window around each candidate mapping location. A weight of 1.0 was assigned for uniquely mapped sequences, for multi-mapped tags weight varied from 0.0 to 1.0. Only tags with a weight equal or higher than 0.9 were kept (44).
Paired end RNAseq reads were aligned to RefSeq RNA sequences (ftp://ftp.ncbi.nlm.nih.gov/refseq/M_musculus/mRNA_Prot/) using Bowtie2 (45), with the following parameters: -N 1 –norc.
Triplet periodicity analysis in ribosome footprints
Using a custom PHP script the merged wiggle files were converted to a format suitable for the Batch PositionConverter Interface in Mutalyzer (46) 2.0.beta-32 (https://mutalyzer.nl/batch-jobs?job_type=position-converter). These converted files with genomic coordinates were manually loaded into Mutalyzer to retrieve positions relative to the annotated TIS. The triplet periodicity pattern was analyzed by calculating the number of reads mapping in the first, second and third nucleotide of each codon for all detected transcripts. Positions were filtered out if they had coverage lower than 3 reads, or if they only mapped in intronic or intergenic regions (500 nt upstream or downstream from annotated coding regions) or if they only mapped to non-coding transcripts. Since for samples treated with harringtonin the 5′ end of a footprint was expected to be located −12 nt far from the TIS, positions located up to −15 nt were counted as positions in coding regions. To calculate the triplet periodicity, positions shared by overlapping transcripts were filtered as follows: if a position was shared between a coding and an untranslated region (3′ or 5′-UTR), the position was counted only for the coding region; if it was shared between 3′-UTR and 5′-UTR of two overlapping transcripts, the position closest to the coding region was reported, but only if the difference in the distance of the two positions relative to the coding region was larger than 100 nt, otherwise both positions were discarded.
Transcription start site assignment and annotation
TSSs were assigned by summing the weighted number of CAGE tags at each genomic position. Weighted numbers were based on the MuMRescue software (44). Peaks located within a window of 20 bp were merged and reported whenever the coverage was at least 10 tags per million (tpm) in at least one experimental condition. BAM files were converted into BED files and annotated based on RefSeq collection, using intersectBed (BEDTools (47)). The RefSeq collection was modified by extending the 5′-UTR of each transcript with 500 nt. Peaks located more than 850 nt downstream the annotated TSS were not considered for further analysis. BAM files were converted into a wiggle format using custom scripts.
Translation initiation site assignment and annotation
A dynamic local peak calling algorithm was developed to identify TISs in the ribosome footprint data from harringtonin treated cells. To discriminate between genuine initiation sites and noise, we evaluated the signal in the region surrounding each peak. Peaks were first filtered following the same procedures used for the triplet periodicity analysis, except for positions shared by overlapping transcripts, which were filtered as follows: if a position was shared between the 3′-UTR and a coding or 5′-UTR, the position was counted only for the coding region or the 5′-UTR. Peak calling was then performed after combining footprints from three independent biological replicates. Each position with a coverage of at least 20 reads was analysed and called if the following conditions were met: the peak had higher coverage compared to any peak located 3, 6, 9, 12 or 15 bases upstream; the peak showed a triplet periodicity pattern (the two nucleotides following the peak had a summed coverage 40% or lower than the total coverage of that codon); the five codons downstream should not contain a base with a coverage higher than that of the peak analysed; the five downstream codons, when having a coverage of at least 10% of the peak analysed, should show a triplet periodicity pattern. Once a peak was called, the analysis continued at the next nucleotide, allowing the detection of TISs in different frames. For each gene, the TIS with the highest coverage was kept as reference, and any other TISs which had a coverage lower than 10% of the reference TIS was discarded for further analysis. For each called TIS, the coverage of that peak in each individual sample was reported. TISs were then classified into six categories: annotated TIS, 5′-UTR (or unannotated 5′-UTR) TIS, coding TIS, 3′-UTR TIS and multiple TIS. TISs mapping in position −12, −11 and −10 nt relative to the start codon were reported as annotated TISs. TISs mapping upstream of position −12 were annotated as 5′-UTR TISs (or unannotated 5′-UTR TISs if the TIS was not located in the 5′-UTR sequence present in the transcript's reference sequence), TISs located between position −10 and the stop codon were annotated as coding TISs, TISs located after the stop codon were annotated as 3′-UTR TISs, TISs which fell in more than one category were annotated as multiple (unless one of the categories was annotated TIS, which was then the only one reported). Peaks located 5 kb downstream of the annotated start codon (counted as transcript positions, not genome) were not considered for downstream analysis. The background noise in these regions was higher, likely because the ribosomes were not allowed sufficient time to finish the translation of transcripts on which they had already engaged in the elongation phase at the start of the harringtonin treatment. Wiggle files showing all the mapped footprints are available and visualized at http://gwips.ucc.ie/.
Differential expression analysis and functional annotation
For RNAseq, CAGE and ribosome profiling data, custom scripts were used to quantify the number of mapped reads. For miRNAseq data, the E-miR software package was used to map trimmed sequencing reads and quantify the number of mapped reads (40). The statistical programming language R (version 2.15.1) was used for analysis of differential expression between myoblasts and myotubes. The analysis was performed using the R Bioconductor package edgeR (48) (version 3.0.8). A negative binomial model was fitted and GLM Tag-wise dispersion was estimated prior testing procedures. Exact P-values were computed using the exact test and adjusted for multiple testing according to Benjamini–Hochberg method (49). Differential expression analysis was performed at gene level after summing reads mapped to Refseq sequences (ftp://ftp.ncbi.nlm.nih.gov/refseq/M_musculus/mRNA_Prot/). KEGG (Kyoto Encyclopedia of Genes and Genomes) pathway analysis was performed using DAVID Functional Annotation Tool (50).
Statistical model to identify genes with alternative TIS or TSS usage
We fitted the previously published logistic generalized linear mixed model (51) to the counts for each TIS (or TSS) using fixed effects for location, myotube, and their interaction, and a random intercept and location effect within cell culture. The model was fitted using R Bioconductor package lme4.0 (R version 2.15.1, http://cran.r-project.org/web/packages/lme4/index.html. Chi-squared likelihood ratio tests were used for testing the presence of location-myotube interactions, i.e. switches in TIS (or TSS) usage. Both a global chi-squared likelihood ratio test for the presence of any interaction and t-tests for individual effects per TIS were calculated.
Codon usage, uORFs and out-of-frame analysis
For each TIS, the nucleotide sequence of the codon was reported based on RefSeq. For 5′-UTR TISs, sequences were reported up to the annotated TIS and translated into the corresponding amino acid sequence until the first stop codon or the annotated TIS. For TISs in unannotated 5′-UTR, the genomic sequences were retrieved from GRCm38/mm10 genome assembly using the genomic Refseq reference sequences). For any TIS located in the 5′-UTR and leading to a stop codon (upstream or downstream of the annotated start codon), the length of the amino acid sequence was calculated. The frame of coding TISs was defined by dividing the mRNA position (adjusted for the distance of the 5′ end of the read relative to the actual TIS position) by 3.
IRES and 5′ TOP analysis
The 5′-UTR sequences of transcripts containing TISs in their 5′-UTR and transcripts containing TISs only in the annotated TIS and/or the coding region were retrieved from Refseq using UCSC Table Browser. Fasta files were uploaded into UTRScan (52) (http://itbtools.ba.itb.cnr.it/utrscan/help) and analysed for IRES and 5′ TOP motifs. Enrichment was calculated by comparing the number of transcripts containing IRES and TIS in the 5′-UTR versus those containing IRES but no TISs in the 5′-UTR. Transcripts containing IRES were then overlapped with transcripts containing uORFs.
In silico screening of alternative TISs
Raw MS/MS proteomic datasets were retrieved from PRoteomics IDEntifications (PRIDE) database (accession numbers: PXD000328, PXD000022, PXD000065). Amino acid sequences for 24665 Mus Musculus proteins were retrieved from UniProt (http://www.uniprot.org/uniprot/?query=organism%3A%22mus+musculus%22+AND+reviewed%3Ayes+AND+keyword%3A1185&sort=score) in fasta format and used as background reference. A fasta file containing amino acid sequences of a set of candidate alternative and uORFs was created and merged with the UniProt reference file. For candidate ORFs containing non-canonical start codons, an alternative peptide sequence was included, where the first amino-acid was replaced with methionine. The MS/MS analysis was performed using the Trans-Proteomic Pipeline v 4.6.3 (53). The raw MS/MS data were converted to mzXML and peptides identified by X!Tandem. The output files were then processed with PeptideProphet for spectrum-level validation and only spectra with probability greater than 0.90 were reported for manual inspection.
Accession codes and hyperlinks to public repositories
Raw deep sequencing data from the C2C12 RNAseq, miRNAseq and ribosome footprint profiling are available for download at European Nucleotide Archive (http://www.ebi.ac.uk/ena) under accession number PRJEB7207. Wiggle files of ribosome profiling data from cycloheximide and harringtonin experiments are available at http://gwips.ucc.ie/ and can be visualized as ‘Elongating Ribosomes’ and ‘Initiating Ribosomes’ tracks, respectively. All analysis scripts together with a README file containing instructions for users are publicly available at GitHub: http://lumc.github.io/ribosome-profiling-analysis-framework/.
RESULTS
A simplified ribosome profiling protocol
The standard protocol for ribosome profiling (25) involves numerous steps, including the isolation of the protected ribosome footprints from the monosomes, obtained by RNAse digestion of cytosolic extracts and the conversion of the small single stranded RNA footprints into a double stranded DNA sequencing library. The conversion is usually accomplished by ligation of single stranded adapters to the 3′ ends of the RNA footprints, followed by reverse transcription and circularization. The circular template is then used for polymerase chain reaction amplification (Figure 1A). Each of these steps may be subject to certain biases. We simplified the existing method by converting the ribosome footprints into sequencing libraries with a standard small RNA sample preparation protocol, which avoids the multistep circularization procedure. Double stranded RNA adapters were ligated to the small RNA footprints, reverse transcribed and directly amplified for sequencing. This resulted in high quality ribosome footprints, as evidenced from the analyses described below. The complete protocol is available in the extended experimental procedures.
Figure 1.
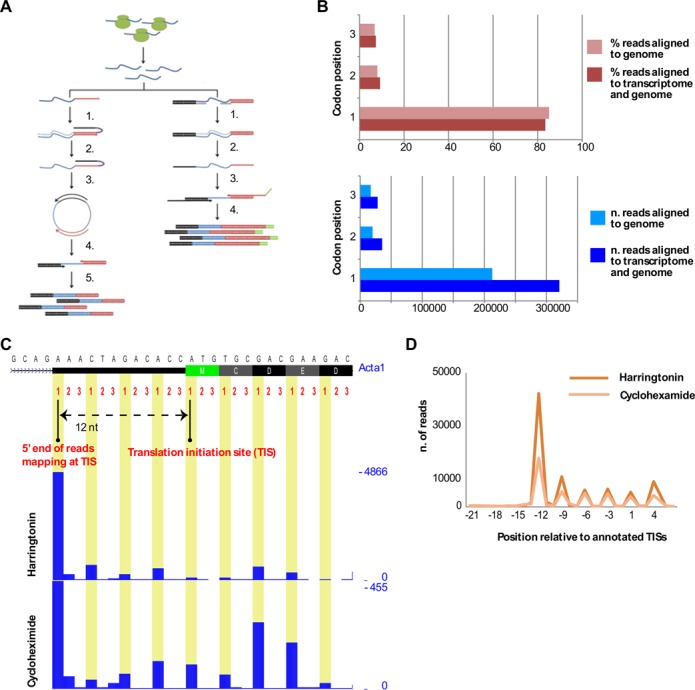
Generation and quality control of the ribosome profiling datasets. (A) An outline of our experimental procedures. The initial steps include the halting of ribosomes on the mRNA by harringtonin or cycloheximide, the treatment of cytosolic extracts with RNAse and the isolation of monosomes on sucrose gradients. These steps are identical to the original protocol developed by Ingolia et al. (23). The original protocol further includes the steps indicated in the left panel: single stranded adapters are ligated to the 3′ ends of the RNA footprints (1), reverse transcribed (2,3) and circularized (4) prior to amplification (5). The right panel shows our simplified sample preparation protocol. Double stranded RNA adaptors, with an overhang of six degenerated nucleotides, are ligated to the RNA footprints (1). Footprints are reverse transcribed (2,3) and amplified for sequencing (4). (B) Percentage of reads mapped to the first, second and third position of each codon in all detected translated transcripts (top) and number of reads (bottom) mapped to the genome reference (light bars) or to combined transcriptome and genome reference (dark bars). (C) A screenshot of UCSC Genome browser displaying the triplet periodicity of the 5′ ends of footprints mapped to Acta1 gene. Harringtonin and cycloheximide treated myoblasts are shown as independent traces. The y-axis represents the coverage of the highest peak. On top of the coverage tracks, the first, second and third nucleotide positions are shown for each codon for the first 27 nt of the first exon. Arrows display the distance of the highest peak relative to the annotated start codon. (D) Number of reads mapped to the first 2 codons and up to 21 nt upstream the start codon for harringtonin (dark yellow) and cycloheximide (light yellow) treated myoblasts.
Analysis pipeline
High quality ribosome footprints are characterized by a distinct triplet periodicity pattern originating from the translocation of a ribosome from one codon to the next during translation elongation. In case of initiating ribosomes, the first nucleotide of each read is usually 12 nt upstream of the start of the codon that is being translated (25,54). These characteristics are commonly used as metrics for the quality of ribosome profiling data. We developed a custom script to analyze the triplet periodicity pattern by converting the first position of the aligned reads to transcript coordinates and relating those coordinates to annotated TISs and the reading frame downstream of the annotated TIS. The script reports the number of reads mapping to the first, second and third nucleotide of each codon for all detected coding transcripts and the number of reads in each position relative to the annotated TIS. The results of this procedure clearly show in our data that ∼80% of reads mapped to the first nucleotide of each codon, as expected from previous studies (28,54,55) (Figure 1B top, 1C, Supplementary Table S1). For all samples, a major peak was observed at −12 nt from the annotated TIS, which is in accordance with previously reported data on the size and the position of the fragment protected by the ribosome (25,54). A higher percentage of 5′ end reads mapping −12 nt from the annotated TIS was also observed for footprints generated by halting initiation of translation (harringtonin treated cells) compared to footprints generated by halting translation elongation (cycloheximide treated cells), as expected (Figure 1D).
The alignment of short (28–29 nt (Supplementary Figure S1)) ribosome footprints represents a challenge because footprints often span splice junctions, with short overhangs on either side of the junction. We calculated that 5421 murine transcripts (Supplementary Table S2) contain a TIS that is not mappable by standard genome alignment, because the TIS is located within a splice junction or it is located <15 nt upstream or downstream an exon–exon junction. Common procedures to avoid loss of reads crossing exon–exon junctions use splicing-aware short-read alignment programs such as TopHat v1 (25,56). Alternatively, reads were mapped to the genome reference using a standard short read aligner, followed by the mapping of unaligned reads to known splice junctions using TopHat v1 (57). Both analyses are potentially flawed by the suboptimal performance of TopHat v1 on reads that are as short as 30 nt. Even though the upgraded TopHat2 performs better in the alignment of exon–exon junction reads that extend 10 nt or less into one of the exons (58), its performance has been optimized for long paired-end reads. Another problem in the genomic mapping of short RNA-derived reads is the presence of pseudogenes. The alternative of mapping exclusively to the transcriptome is also not ideal because it may miss hits in unannotated transcripts or in unannotated parts of transcripts, such as alternative first exons (59).
To overcome these limitations, we performed a combination of transcriptome and genome alignment. Footprint reads were aligned to a transcriptome reference, and only reads that did not map to the transcriptome were aligned to the genome (Supplementary Table S3). Mapping first to the transcriptome and then to the genome slightly reduced the number of reads mapping to pseudogenes (Supplementary Tables S4 and S5). The coordinates from the reads mapping to the transcriptome were converted to genomic coordinates and then combined with the mappings from the genome alignment. The improvements obtained by the combined alignment can be appreciated by the recovery of ∼30% of otherwise unmappable reads. These reads are likely genuine ribosome footprints as they show a triplet periodicity identical to the reads that do not span exon–exon junctions (Figure 1B, bottom).
A dynamic local peak calling algorithm was then developed to identify TISs in the ribosome footprint data from harringtonin treated cells. The developed algorithm evaluates the signal in the region surrounding each peak, takes into account the triplet periodicity in the nearby codons and is able to report start codons in different frames. A complete description is available in ‘Materials and Methods’ section. Scripts used for the combined alignment, triplet periodicity analysis and peak calling are publicly available at http://lumc.github.io/ribosome-profiling-analysis-framework/.
Experimental setup
We performed ribosome profiling on undifferentiated myoblasts and differentiated myotubes from the murine C2C12 cell line, a well-characterized model for skeletal muscle differentiation (60). Ribosome footprints were recovered from initiating ribosomes and elongating ribosomes after halting translation with harringtonin or cycloheximide, respectively, analyzing three independent cultures for each condition.
Ribosome footprints derived from coding and non-coding genes
Footprints recovered after halting translation with harringtonin or cycloheximide mainly mapped to protein coding genes (Figure 2A, Supplementary Tables S4 and S5). Reads mapping to repetitive sequences, including contamination from ribosomal and transfer RNAs, are shown separately in Supplementary Table S3.
Figure 2.
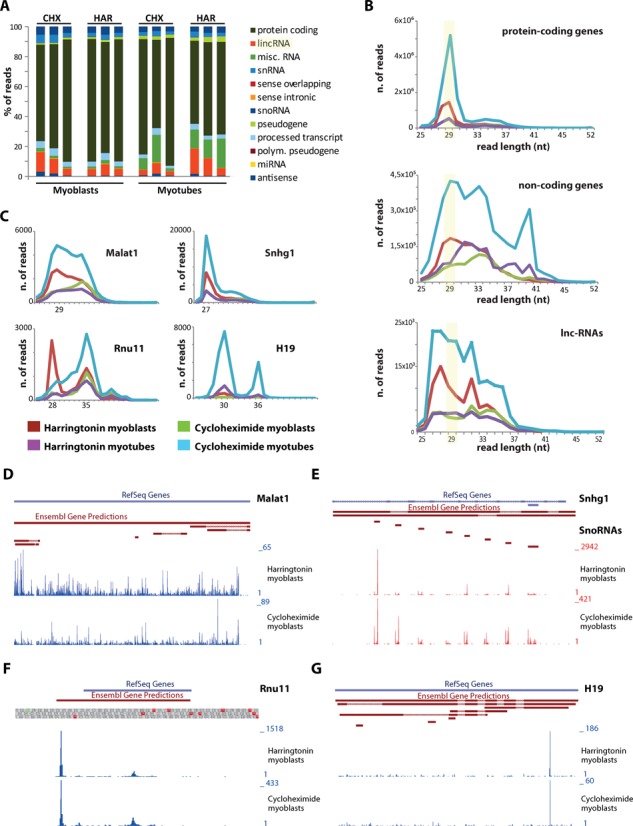
(A) Percentage of reads mapped to coding and non-coding genes in myoblasts and myotubes treated with harringtoning (Har) or cycloheximide (Chx). (B) Read-length distribution of footprints mapping to protein-coding genes (top), non-coding genes (including small and long non-coding genes) or only to lincRNAs (bottom). (C) Read-length distribution of footprints mapping to Malat1, Snhg1, Rnu11 and H19. (D–G) Coverage patterns for Malat1, Snhg1, Rnu11 and H19 in harringtonin (top traces) and cycloheximide (bottom traces) treated myoblasts.
In addition, a relative high proportion of reads mapped to long intergenic non-coding RNAs (lincRNAs) (between 5 and 10% in average) and small RNAs (between 10 and 20% in average). To address the coding potential of lincRNAs in our dataset, we compared the read length distribution of footprints mapping to coding genes, non-coding genes (all genes with accession prefix ‘NR_’ in the RefSeq collection, including also lincRNAs) or only lincRNAs (Figure 2B). Footprints mapping to protein-coding genes were preferentially 29 nt long, whereas footprints from non-coding genes did not show this preference in length. The read-length distribution of footprints mapping only to lincRNAs was similar to the one of footprints mapping to any other non-coding genes. Nevertheless, in both cases a portion of reads was 27–30 nt long.
We identified highly covered lincRNAs with protected fragments of 27–36 nt (e.g. Malat1) or with a preference for reads 27–30 nt long (e.g. Snhg1, Rnu11, H19) (Figure 2C). Malat1 reads mapped along the full body of the transcript, it did not show a preferential peak at AUG codons nor other common non-AUG start codons and it lacked of a drop of coverage at any corresponding stop codon (Figure 2D). Snhg1 showed coverage in intronic regions transcribing for snoRNAs, as previously reported in the Gas5 transcript (Figure 2E) (61). The coverage in Rnu11 (Figure 2F) and H19 (Figure 2G) was restricted to one or two regions, and no difference was shown between the cycloheximide and harringtonin treatment. Based on these observations, we suggest that the majority of footprints deriving from lincRNAs in our dataset do not have a coding potential.
Subsets of mRNAs primarily regulated at translational level during myoblasts differentiation
To investigate the impact of translational regulation in myogenesis, ribosome profiling data were compared to regular RNAseq data on total poly(A)+ RNA. The numbers of genes detected by ribosome profiling and RNAseq were similar (Supplementary Figure S2). Switches in the abundance of known markers of myogenesis were observed in both the RNAseq and the ribosome profiling data, as exemplified by the upregulation of the myogenic markers Myog, Tnnc1 and Myh7, and the downregulation of Myf5 (Supplementary Table S6).
Differential expression between myoblasts and myotubes was analysed at the gene level and the calculated log fold changes were compared between ribosome-bound RNAs (Supplementary Tables S7 and S8) and total RNA (Supplementary Table S9). Overall we observed a positive correlation between total and ribosome-bound RNAs (r = 0.71 and 0.65 for cycloheximide and harringtonin footprints, respectively, Pearson correlation) (Figure 3). However, the fold change observed in ribosome-bound RNA is generally lower than the fold change in total RNA, as demonstrated by the slope of the regression line (0.46 for cycloheximide footprints [95% confidence interval: 0.457–0.474] and 0.42 for harringtonin footprints [95% confidence interval: 0.413–0.431]). This is indicative for a general dampening effect of translational regulation. A subset of genes showed discrepant total and ribosome-bound RNA levels. In harringtonin-treated C2C12 (Figure 3A), 5680 genes showed significant changes between myoblasts and myotubes (P-value < 0.05) in total RNA but not in ribosome bound RNA levels, indicative of a dampening effect of translation on transcription-induced changes. A total of 431 genes were regulated exclusively at translational level but not at the transcriptional level. Finally, 544 genes were regulated in opposite direction, meaning that they were upregulated at transcriptional level but showed lower translational efficiencies or vice versa. In cycloheximide-treated cells (Figure 3B), a similar trend was observed, even though the number of genes that reached a statistical significance (P-value < 0.05) was lower (6902 genes were regulated during transcription but dampened at translational level, 66 genes were regulated only at translational level and 73 showed anti-directional changes).
Figure 3.
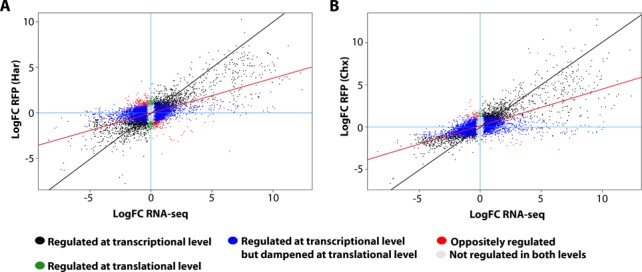
Changes in transcription and translation during myogenesis. Scatterplot showing differences in total RNA (x-axis) and ribosome-associated RNA (y-axis) from harringtonin (A) or cycloheximide (B) treated myoblasts and myotubes. Each data point represents the log-transformed fold change between myotubes and myoblasts. The red line indicates the slope, whereas the black line indicates the diagonal.
We next addressed the contribution of miRNAs on the regulation of gene expression at the level of translation. We found 105 miRNAs differentially expressed between myoblasts and myotubes (Supplementary Table S10) in our miRNAseq data, of which 66 were upregulated. We then focused on the effect of nine well-characterized myomiRs (mir-206, mir-1a, mir-22, mir-27b, mir-133a, mir-155, mir-29c, mir-675 and mir-181a-5p) and compared the calculated log fold changes of experimentally validated targets between ribosome-bound RNAs (cycloheximide treatment) and total RNA. For 8 out of 9 analyzed myomiRrs, the correlation in fold change of their targets was not significantly different from the general correlation (Supplementary Table S11, Figure S3). These data suggest that miRNA regulation does not contribute strongly to the observed translational regulation (Figure 3).
We continued our comparison of transcriptome and translatome by performing a pathway enrichment analysis (Supplementary Table S12) on the subsets of genes showing discordant regulation. mRNAs coding for ribosomal proteins displayed the highest enrichment in the subset of genes showing opposite regulation between transcription and translation (these genes were downregulated at translational level but upregulated at transcriptional level, P-value 2.2 × 10⁻⁷), and in the subset of genes downregulated only at translational level (P-value 3.7 × 10⁻¹³). mRNAs involved in the proteasome pathway showed a moderate enrichment in the subset of oppositely regulated genes (P-value 3.5 × 10⁻⁵), followed by mRNAs involved in focal adhesion (P-value 3.3 × 10⁻⁴), regulation of actin cytoskeleton (P-value 7.7 × 10⁻⁴) and calcium signaling (P-value 2 × 10⁻²). To determine whether the discordant regulation was affecting the full pathway or only a subset, we compared log fold changes of all genes belonging to each enriched pathway.
The correlation observed between RNAseq data and ribosome profiling data for all genes that are part of the calcium signaling pathway was high (r = 0.84 for both cycloheximide and harringtonin footprints, Pearson correlation), suggesting that only a subset of calcium signaling genes is differentially translated. Similar high correlations were observed for all the other pathways, except for ribosomal protein genes. A poor correlation was found between RNAseq data and ribosome profiling data for ribosomal genes, when comparing RNAseq and harringtonin footprints (r = 0.27, Pearson correlation, P-value = 0.0018) (Figure 4A). The comparison between RNAseq and cycloheximide footprints, however, showed a positive correlation (r = 0.79, Pearson correlation, P-value < 2.2e-16) (Figure 4B). The discrepancy between ribosome footprints of initiating and elongating ribosomes suggested that not all initiating ribosomes were leading to translation of the ORF and/or that ribosome stalling was affecting the counts for elongating ribosomes. We therefore focused on the characterization of translation initiation.
Figure 4.
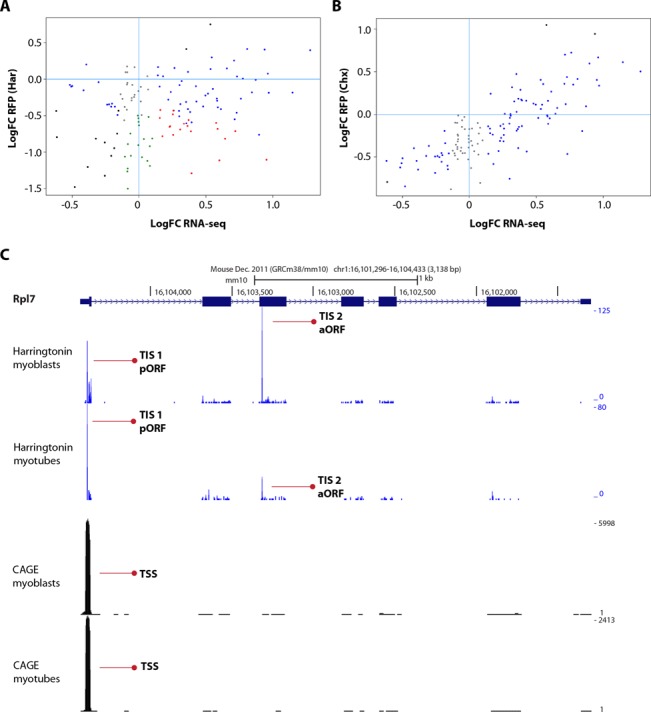
Translational regulation of ribosomal protein genes. Scatterplots show differences in levels of transcribed and translated ribosomal protein genes. Total RNA (x-axis) and ribosome-associated RNA (y-axis) from harringtonin (A) or cycloheximide (B) treated myoblasts and myotubes are shown for 145 genes belonging to the ribosome KEGG pathway. (C) A screenshot of UCSC Genome browser displaying alternative translation start sites (TISs, first and second traces) and transcription start sites (TSSs, third and fourth traces) in myoblasts and myotubes of the ribosomal protein gene Rpl7. TSSs and TISs leading to the translation of the pORF (TIS1) or predicted alternative open reading frame (TIS2) are indicated by red arrows.
Characterization of translation initiation in myogenesis
Data from harringtonin-treated cells were used to identify TISs used in myoblasts and myotubes.
After mapping and filtering procedures, and combining the reads from the triplicate experiments, 3,052,146 and 976,468 reads were used to assign TISs in myoblasts and myotubes, respectively. The above described dynamic local peak calling algorithm was used to discriminate between noise and genuine initiation sites in the surrounding region of each peak. We detected a total of 6823 TISs in myoblasts (Supplementary Table S13) and 2371 TISs in myotubes (Supplementary Table S14), corresponding to 4106 and 1561 coding genes, respectively. Our analysis showed that ∼45% of the detected genes in myoblasts had two or more TISs, whereas in myotubes the percentage was slightly lower (∼30%) (Figures 5A and 5B). The number of genes with more than six TISs was only ∼0.5 and 0.6% in myoblasts and myotubes, respectively.
Figure 5.
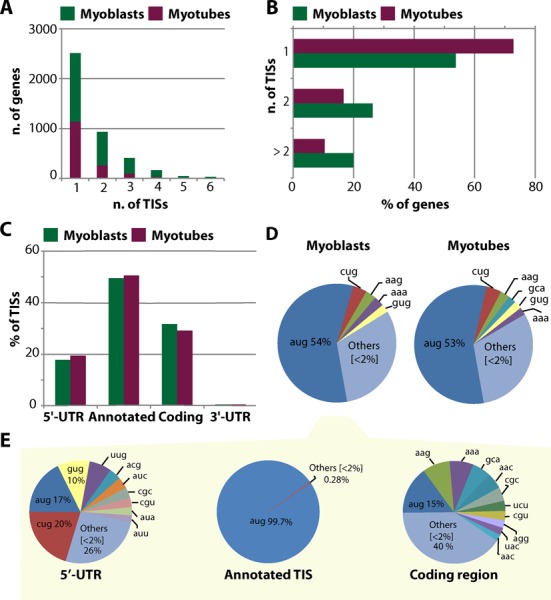
Alternative translation initiation sites used during myogenesis. Bar graph shows (A) the number of TISs per gene in myoblasts (green bars) and myotubes (purple bars), (B) the percentage of genes containing one, two or more than two TISs, (C) the percentage of TISs located in the 5′-UTRs, in the annotated start codons, in the coding regions or in the 3′-UTRs. Multiple indicates TISs mapping to more than one of the listed categories. (D) Pie chart shows the percentage of reads containing AUG and non-AUG codons at all detected TISs for myobalsts (left) and myotubes (right) treated with harringtonin. (E) Distribution of reads with AUG and non-AUG codons at detected TISs located in the 5′-UTRs, in the annotated start codons and in the coding regions. Distribution is shown only for myoblasts.
Approximately 50% of the footprints coincided with annotated start codons (Figure 5C), whereas ∼20% mapped in the 5′-UTRs (of which 6.5% in unannotated 5′-UTRs, <500 nt upstream of the annotated start codon). A considerable amount of footprints (∼30%) were found within coding regions, ∼5% of which led to in-frame ORFs, hinting at alternative start codons for protein isoforms with truncated N-termini for 107 genes in myoblasts and 50 genes in myotubes. No general shift in the localization of TISs was observed during myogenic differentiation (Figure 5C). Around 55% of the footprints in the detected TISs contained the canonical AUG codon (Figure 5D). Notably, footprints of TISs located in the 5′-UTRs were enriched for alternative codons, primarily CUG and GUG, in accordance with the notion that uORFs frequently use weaker, non-canonical start codons (Figure 5E) (24,26,28,60). Footprints of TISs located in the unannotated 5′-UTRs were also mainly mapping to the non-canonical codons CUG and GUG (Supplementary Tables S15 and S16), except in myoblasts where the percentage of footprints with a canonical AUG codon was higher (32 against 16% in myotubes). This discrepancy mainly originated from footprints mapping to two TISs, corresponding to the highly expressed splicing factor Sf3b6 and mitochondrial gene Prelid1 (Supplementary Figure S4). These two detected TISs were followed by a stop codon upstream of the pORFs, according to the genomic sequence, but no TISs were detected at the annotated start codons, which may be due to the sort distance between uORF and annotated TIS. Since the unannotated 5′-UTR sequence may contain intronic sequences, it is impossible to determine whether these TISs represent uORFs or genuine start codons from wrongly annotated genes.
To distinguish between uORFs and alternative extended N-termini, we focused on TISs located in the annotated 5′-UTRs, and we classified them based on their reading frame in relation to the pORF and the presence of stop codons. Sixty percent of the detected TISs located in the 5′-UTRs were leading to stop codons prior the start of the pORFs (corresponding to 1274 TISs and 380 TISs in myoblasts and myotubes, respectively) (Figure 6A). The length of these uORFs ranged from 1 to more 100 amino acids (Figure 6C), but the majority (∼85%) were between 1–30 amino acids (50% was shorter than 10 amino acids). The remaining 40% of the TISs located in 5′-UTRs were not leading to stop codons prior the start of the pORF, but ∼72% of these uORFs was in a different reading frame than the pORFs, leading to overlapping uORFs, whereas the remaining 28% was in-frame with the pORF, suggesting the presence of isoforms with extended N-termini (Figure 6B). The length of the overlapping uORFs was longer than the one of the non-overlapping uORFs, reaching up to 400 amino acids and with only ∼40% being shorter than 30 amino acids (Figure 6D). We then investigated whether the usage of TISs in the 5′-UTRs sequences was associated with the presence of known regulatory elements, such as Internal Ribosome Entry Sites (IRESs) and Terminal Oligopyrimidine Tracts (5′ TOP). A significant enrichment of predicted IRES was found in transcripts with TISs in the 5′-UTRs, compared to transcripts for which we detected TISs only in the annotated start codon and in the coding region. 36% of the transcripts containing TISs in the 5′-UTR had IRESs (Supplementary Table S17), whereas the percentage dropped to 24 for transcript without TISs in their 5′-UTRs in myoblasts (27 against 20% in myotubes, respectively). No significant enrichment was found for predicted 5′ TOPs (Supplementary Table S18), and overall the percentage of transcripts with a TIS in the 5′-UTR and the presence of a predicted 5′ TOP was lower compared to the percentage of transcripts containing predicted IRES (∼4% for both myoblasts and myotubes). These results suggest that for these genes uORFs do not play an important role in the regulation of mRNAs starting with a 5′ TOP in myogenesis, whereas they may favor the use of IRESs in a subset of genes.
Figure 6.
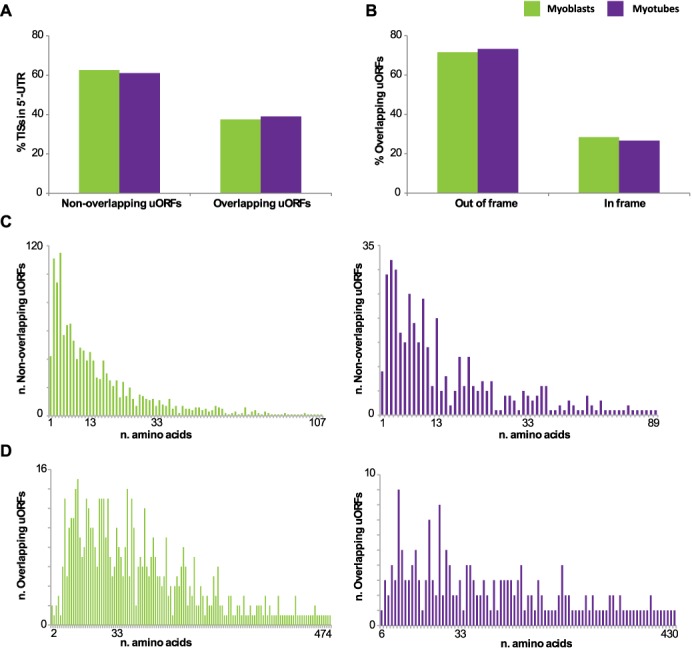
Potential uORFs used during myogenesis. (A) Percentage of TIS located in the 5′-UTRs leading to a stop codon before the annotated start codon of the pORF (non-overlapping uORFs) or overlapping the pORF. (B) Percentage of TISs in-frame and out-of-frame with the overlapped primary ORF. (C) Length distribution of non-overlapping and (D) overlapping uORFs in myoblasts (green) and myotubes (purple).
Alternative translation initiation independent of alternative promoter usage
Differences in TIS usage during skeletal muscle differentiation could derive from regulation at the transcriptional level, due to alternative promoter usage. Alternatively, a switch in TIS usage may occur in the same transcript and arise from regulation at the translational level, because of differential recognition of upstream or alternative ORFs due to altered activity of translation initiation factors or RNA binding proteins. Regulation at the translational level can also occur through different efficiency in the translation of transcript variants. An example of a gene with a combination of both scenarios is Tpm3, a cytoskeletal protein involved in the calcium dependent regulation of muscle contraction. Two different TISs were detected in Tpm3: one TIS arising from a shorter transcript was predominantly used in myoblasts, another TIS arising from a longer transcript with alternative first exons was predominantly used in myotubes (Figure 7A). This results in the formation of proteins with two distinct N-termini, a longer isoform of 285 aa (UniProt P21107–1, also known as skeletal muscle isoform) and a shorter isoform of 248 aa (P21107-2, also known as cytoskeletal isoform). In addition to the nature of the transcribed protein, the efficiency of translation seems to be tightly controlled. As a measure for translational efficiency and to assess the effects of changes in TSSs, we analysed DeepCAGE data to detect 5′-ends of transcripts. DeepCAGE data for the same gene in the same cells showed three different TSSs. The most distal (3′) TSS does not appear to code for a protein. The other two code for the short (cytoplasmic) and long (skeletal muscle) transcript variants and were transcribed at similar levels in myotubes (Figure 7B). However, the short variant was not translated in myotubes, but only in myoblasts (Figure 7A). Interestingly, tropomyosin proteins have already been shown to be regulated at translational level in slow-twitch and fast-twitch muscles (62).
Figure 7.
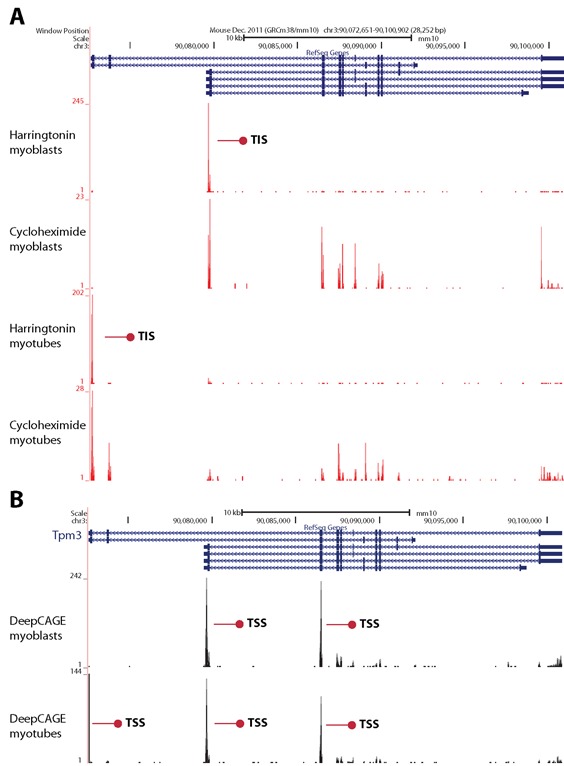
Alternative transcription and translation in Tpm3. On top of the coverage tracks, the six annotated transcripts are shown. (A) Two translation initiation sites (TISs, indicated by red arrows) arise from two transcript variants and are differentially used in myoblasts (first trace, harringtonin) and myotubes (third trace, harringtonin). Footprints in the complete open reading frame are shown for myoblasts (second trace, cycloheximide) and myotubes (fourth trace, cycloheximide). (B) Two TSSs (indicated by red arrows) are used in myoblasts (top trace) and three TSSs are used in myotubes (bottom trace).
To investigate the extent of translational regulation during myogenesis, we assessed the statistical significance of TIS switches for all genes with more than one TIS. From 4219 genes for which we could identify TISs, 1729 genes contained at least two TISs. Out of those, 312 genes (18%) (Supplementary Table S19) showed a significant difference (P-value < 0.05, after multiple testing correction) in alternative TIS usage between myoblasts and myotubes. To account for changes derived from regulation at transcriptional level, we performed the same analysis to detect changes in TSS usage as detected by DeepCAGE. Out of 6426 detected genes, 635 genes contained two or more TSSs, and 28% (180) of those showed a significant change (P-value < 0.05, after multiple testing correction) in TSS usage between myoblasts and myotubes (Supplementary Table S20). The overlap between genes with both changes in TISs and TSSs usage was small (Figure 8A), indicating that the majority of switches in TIS are occurring in transcripts with the same start site. Even transcripts with a switch in both TIS and TSS usage appeared to be at least partly regulated at the translational level. Cryab is an example of such a transcript. Two major TSSs were detected in myoblasts, whereas in myotubes only one of the two TSS was detected (Figure 8B). Ribosome footprints from myoblasts showed (i) a TIS in the 5′-UTR, which represents an uORF with an harringtonin peak corresponding to an AUG start codon in a Kozak consensus sequence, and cycloheximide footprints on the entire 35 amino acids uORF, in addition to (ii) a TIS representing the pORF (Figure 8C). In myotubes, however, only the TIS corresponding to the annotated start codon was detected. Ribosome profiling footprints of cycloheximide treated cells showed a significant upregulation of Cryab in myotubes compared to myoblasts (Supplementary Table S8). This indicates a negative effect of the uORF on translation in myoblasts. The short distance between the uORF and the pORF, plus the relatively long uORF (35 amino acids) suggest that translation re-initiation in myoblasts is impaired. In agreement with our finding, a previous study has shown upregulation of Cryab at protein level in myotubes (63).
Figure 8.
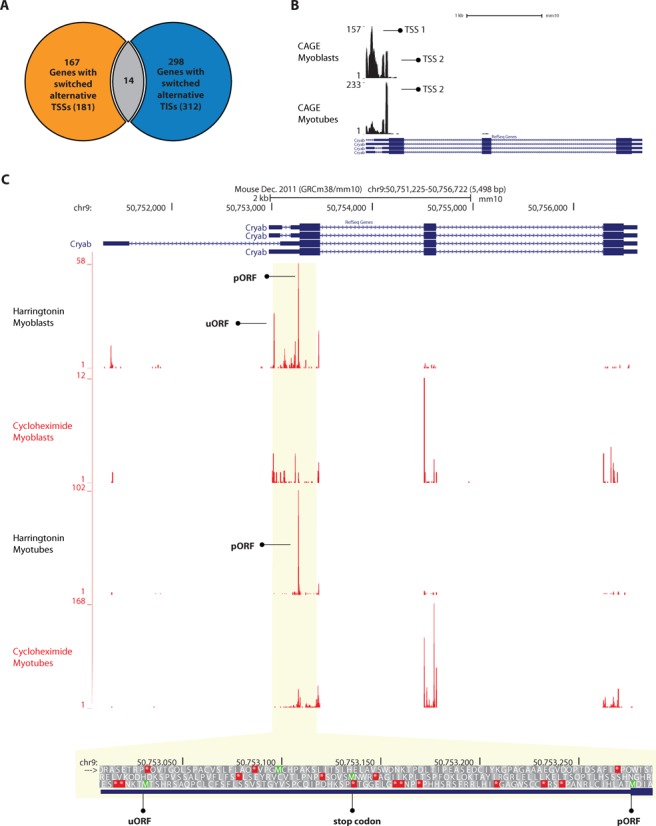
Switches in TISs usage during myogenesis. (A) Venn diagram showing the overlap between genes with significant switch in TSSs usage and genes with significant switch in TISs usage. The total number of genes with significant switches in TSS or TIS usage is reported between parentheses. (B) Coverage pattern and position of alternative TSSs used in Cryab gene, for myoblasts (top trace) and myotubes (bottom trace). TSSs are indicated with black arrows. (C) A screenshot of UCSC Genome browser displaying translation start sites (harringtonin, first and third traces) and ribosome footprints for the whole coding region (cycloheximide, second and fourth traces) in Cryab. TISs located in the annotated start codon (pORF) and in the 5′-UTR (uORF) are indicated with black arrows. Below the coverage tracks, the nucleotide sequence of the genomic region between the uORF and the pORF is shown. The stop codon in-frame with the uORF is indicated.
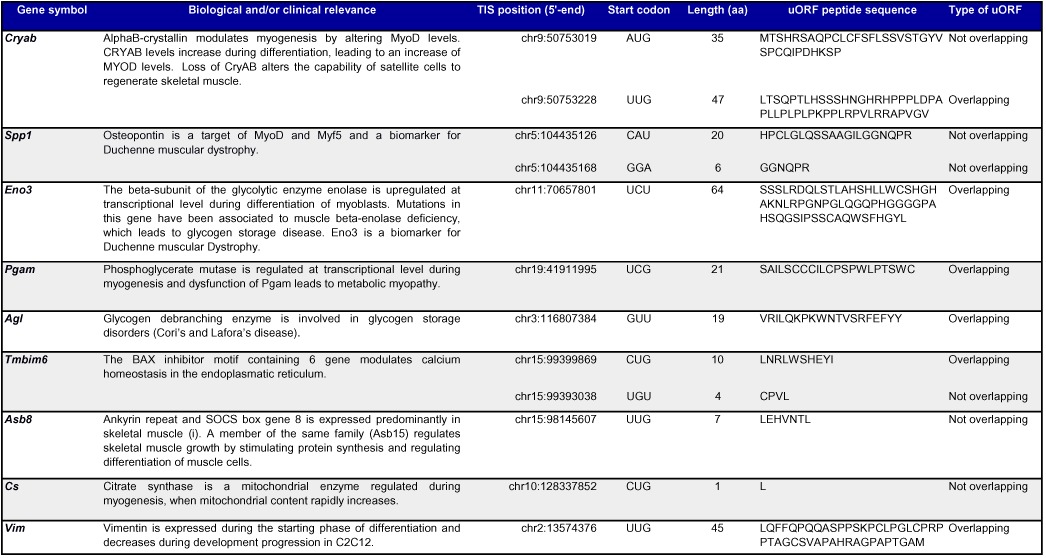
To identify which other genes are likely subjected to translational regulation by expression of uORFs, we selected genes with a significant switch between the annotated TIS and a TIS in the 5′-UTR region, as evident from the interaction P-value of relative TIS usage and differentiation status (Supplementary Table S21). This led to the identification of 27 genes containing uORFs regulated during differentiation. Many of these genes, including Cryab (63,64), Vim (65), Spp1 (66), Eno3 (67,68), Pgam (69), Agl (70), Tmbim6 (71), Asb8 (72) and Cs (73), are known to be involved in the development, regeneration and/or homeostasis of skeletal muscles in humans (Table 1). Moreover Eno3 (74,75) and Spp1 (76) have been recently reported as biomarkers for Duchenne muscular dystrophy, where their protein expression levels changes in Duchenne patients through molecular mechanisms not yet fully understood.
Table 1. Candidate uORFs differentially used during myogenesis, in genes with biological and/or clinical relevance in muscle biology.
KEGG pathway analysis on the complete set of genes with changes in alternative TIS usage showed moderate enrichment of only two pathways, ribosomal proteins genes and genes involved in the calcium signaling pathway (Supplementary Table S22), pathways that were also enriched in a comparison of transcriptome versus translatome (Supplementary Table S12). None of the 27 genes with switches involving uORFs was listed in the set of genes belonging to these two pathways, indicating that the observed switches identified in ribosomal protein genes and calcium signaling genes were mainly occurring between an annotated TIS and a TIS in the coding region, or between different TISs in the coding region. Another plausible explanation is the imperfect annotation of KEGG pathway, as seen for Tmbim6, a gene involved in calcium signaling (76) but not listed in the calcium signaling pathway (mmu4020).
Switches between alternative TISs which were observed in ribosomal genes were indeed mainly occurring between the annotated TISs and alternative TISs located downstream in the coding region. These switches were not due to alternative TSS usage as generally only one TSS was found. An example of such a ribosomal protein gene is Rpl7 (Figure 4C). The TIS detected in the coding region may lead to translation of a shorter novel protein, containing a methionine at its start codon and translated in a different frame compared to the pORF. This aORF may therefore represent a dual coding region. Rpl7 was downregulated at total RNA level, but the downregulation did not reach significanctly in both ribosome profiling datasets. We determined RPL7 protein level by western blot analysis, and detected similar protein expression levels between myoblasts and myotubes (Supplementary Figure S5), suggesting that the alternative out-of-frame TIS does not affect the translation of the pORF and that the downregulation observed at total RNA level is buffered during translation. Western blot was also performed for two other ribosomal proteins, RPL34 and RPS15, where the detected alternative TISs in the coding regions were in-frame with the pORFs. Rpl34 was shown to be significantly upregulated at total RNA level, whereas it was downregulated in harringtonin footprints (the downregulation did not reach significance in cycloheximide footprints). Rps15 was not differentially expressed at total RNA levels but, similarly to Rpl34, harringtonin footprints showed a downregulation in myotubes (which did not reach significance in cycloheximide footprints). For both RPL34 and RPS15 no significant change was detected at protein level with western blot analysis, neither the presence of truncated isoforms (Supplementary Figure S5). We attempted to validate the presence of dually decoded regions, N-terminally truncated or extended isoforms and small ORFs derived from uORFs, in a genome wide scale, by screening publicly available raw LC-MS/MS proteomic datasets, including two C2C12-specific datasets (77,78) and a HiRIEF LC-MS/MS deep proteome dataset from N2A mouse cell (79). None of the novel candidate peptides passed our stringent spectrum-level validation, consistent with an extremely low abundance of these peptides or detection of ribosome stalling (see ‘Discussion’ section).
DISCUSSION
Gene expression programs control tissue development and regeneration. Whereas regulation of gene expression at transcriptional level is extensively studied at genome-wide level, control of mRNA translation has mostly been studied on individual genes. Polyribosomal mRNAs profiling has been used in the past to obtain a global overview of translation efficiency. However, the novel approach of ribosome footprint profiling enables translatome analysis at the same level as transcriptome analysis. Nonetheless, the existing protocol for ribosome profiling is laborious and, to date, there are no dedicated pipelines for the analysis of the short ribosome footprints.
Here we describe a simplified protocol for ribosome profiling and a novel data analysis pipeline, which includes a combined mapping procedure for short reads, the analysis of the triplet periodicity and a dynamic peak calling algorithm to detect annotated and/or novel TISs, including aORFs and uORFs in frame or out-of-frame compared to the annotated ORF. We used our simplified protocol and custom pipeline to investigate the extent of translational control during the formation of mammalian skeletal muscles, based on the analysis of the translatome, promoterome and transcriptome of proliferating myoblasts and differentiated myotubes in the murine C2C12 cell model. We integrated ribosome profiling data, DeepCAGE data, RNAseq and miRNAseq data to assess the contribution of translational regulation to the changes in protein expression during myogenic differentiation.
Detection of TISs
To investigate the impact of alternative translation initiation, we used our custom dynamic peak calling algorithm to detect and quantify alternative TIS usage during differentiation in harringtonin treated myoblasts and myotubes. Our algorithm detected 5333 not yet annotated TISs, providing an extensive catalog of alternative TISs leading to uORFs, aORF and potentially dual coding regions, specifically used during myogenesis.
We report only a high confidence set of TISs. Not all peaks called from the harringtonin footprints may represent genuine TISs. False positive peaks may arise in the distal part of the coding regions, when the harringtonin treatment is too short for elongating ribosomes to finish the translation of the C-terminal part of the protein. For this reason we developed a dynamic peak calling algorithm which considers not only the triplet periodicity pattern, but also the coverage and the relative position of each candidate TIS. Alternative TISs detected in the 5′-UTRs (corresponding to ∼20% of mapped reads) showed a codon distribution similar to previously reported studies (24,25,55), with CUG and GUG codons being the most abundant non-AUG codons, whereas 50% of the footprints mapped to annotated start codons. Overall, these findings give confidence in our data.
Likely, many more TIS are used during myogenesis, but they were not abundant enough to be detected in our experiments. We detected a lower number of TISs in myotubes compared to myoblasts, which may relate to lower numbers of footprints prior to peak calling. Nevertheless, it does not exclude the possibility that the lower percentage of alternative TISs in myotubes reflects a true biological phenomenon, considering that differentiated cells become more specialized and therefore require a smaller protein repertoire. We may also have lost alternative TIS due to our stringent thresholds: alternative TIS were only called when their abundance was at least 10% of the full length isoform, where previous reports demonstrated that N-terminally truncated protein isoforms present at only 5% of the full length isoform can exert biologically significant effects (10,80). However, we preferred to not decrease this threshold and avoid false positives.
In our study ∼30% of the reads mapped within the coding regions of pORFs. Only ∼6% of the TISs located in coding regions were in-frame with their pORFs (∼4% in case of TISs detected in myotubes), representing potential protein isoforms with truncated N-termini. We were not able to confirm the presence of alternative truncated protein isoforms for RPL34 and RPS15 at western blot level. An explanation could be pausing of ribosomes during the harringtonine treatment, or leaky scanning of the pORF TIS that results in recognition of a downstream start codon yielding to an instable alternative isoforms. The primary ribosomal proteins are stable and accumulate in the cell, whereas the isoform does not accumulate. Regulation of protein stability is another control mechanisms determining protein abundance, which cannot be addressed by ribosome profiling. The remaining TIS located in the coding regions where out-of-frame TISs. A portion of it may represent potential dual coding regions. Previous studies have detected dual coding regions in genes involved in fundamental cellular processes (21), such as translation (Eif4a2), cell cycle (Cdkn2a) and protein degradation (Ube2e2). Many translation initiation factors, including Eif1, Eif4a2, Eif4e2, Eif4a1, Eif2s1 and Eif5 showed a switch in TIS usage during myoblasts differentiation. We did not observe dual coding in Eif4a2 in our data, but we did detect two TISs in Eif1, one representing the annotated start codon and the other representing an out-of-frame aORF with an AUG start. Nevertheless, for the majority of the alternative out-of-frame TISs, we currently lack further evidence. Our attempt to validate dual coding regions, in-frame aORF and small peptides derived from uORFs, based on publicly available mass spectrometry data, present several limitations, even if the proteomic data used is of high quality and acquired using state-of-the art instrumentation and methodology. An untargeted proteomic approach is not ideal due to dynamic range limitations and difficulties in detecting and quantifying low-abundant proteins among a diverse pool (81). A recent study showed that ribosome profiling data could be used to improve identification of novel N-termini isoforms and translated upstream ORF from proteomic data (82). However, only a small number of translated uORFs and N-terminal extensions was validated. We therefore conclude that the lack of consistency between ribosome profiling data and mass spectrometry data does not invalidate our findings, but positive validation of these translated uORFs and aORFs on protein level may require enrichment of peptides by anti-peptide antibodies raised against a number of predicted and synthesized peptides.
In this study we restricted the detection of TISs in coding transcripts. Nevertheless, a percentage of footprints derived from non-coding transcripts. LincRNAs bound to ribosomes have been observed in previous ribosome profiling (24) and polysome profiling studies (83). Whether they lead to active translation is still debated, with some studies showing no coding potential (84,85) and others suggesting that translation occurs in portions of lincRNAs (61). The fragment-size of the protected footprint is one of the parameters commonly used to distinguish true ribosome footprints from RNA fragments derived from transcripts protected by other complexes that may co-sediment with ribosomes or fragments derived from stable RNA secondary structure. Our read-length distribution analysis showed that lincRNAs did not always display a preference for one specific read-length, as protein coding genes did, and for those which showed a preferential peak surrounding 30 nt, we did not observe characteristic signatures of translation, not even restricted to portions of the lincRNAs.
Cellular processes controlled by selective mRNA translation in myogenesis
During differentiation of myoblasts into multinucleated myotubes, protein synthesis generally correlated with mRNA levels for the majority of the genes. Genes with lower correlations are likely regulated at the level of mRNA translation. The latter were strongly enriched for genes encoding for ribosomal proteins, whereas a modest enrichment for genes involved in protein degradation, focal adhesions, regulation of actin cytoskeleton and calcium signaling was also observed. The ribosomal protein genes and the calcium signaling pathway were also enriched in the set of genes showing alternative TIS usage, but the enriched genes were different, indicating that these pathways are mainly regulated at translational level not only by different translation initiation but also through other mechanisms.
A previous study showed that the production of three ribosomal proteins (S16, L18 and L32) is regulated both at the level of transcription and translation during myoblast differentiation (86). The authors showed a decrease in transcription and a decrease in translation efficiency by measuring mRNA bound to polysomes. In line with their study, S16, L18 and L32 showed a significantly lower number of harringtonin footprints in myotubes, whereas the decrease in cycloheximide footprints did not reach statistical significance. A general downregulation was observed for the majority of the ribosomal protein genes both at transcriptional and translational level. Despite a positive correlation between RNAseq and cycloheximide footprints (r = 0.79, Pearson correlation), we found a poor correlation between RNAseq data and harringtonin footprints (r = 0.27, Pearson correlation), much lower than the correlation for all genes (r = 0.65). This discrepancy observed may be explained in different ways, one of which could be ribosome stalling, a known limitation in ribosome profiling data (87). If elongating ribosomes are stalled, this may lead to accumulation of footprints, which might be detected as alternative TISs in harringtonin data. The same applies to cycloheximide footprints, where ribosomal pauses might interfere with a correct quantification of translation. However, even if the peaks and footprints do not always reflect the production of novel short peptides or protein isoforms, we observed significant changes in ribosome footprints at those sites during myogenesis. These changes are highly reproducible between replicates, they are cell specific and tightly controlled during differentiation and therefore they likely represent a regulatory mechanism with relevance for muscle differentiation.
The mechanisms regulating alternative TISs usage in myogenesis remain to be investigated. Previous studies have shown that proteins involved in the translation machinery are autoregulated (35) and their synthesis is mainly controlled at the level of translation (88). These mRNAs are mainly characterized by the presence of structural motifs, such as the 5′ TOP. The mTOR signaling pathway is known to regulate translation of TOP mRNAs. Serum removal could represent a downregulating stimulus for the mTOR pathway, possibly leading to mTOR-pathway inactivation and mTOR-dependent translation repression. The protocol for C2C12 differentiation is based on serum reduction (from 10 to 2% FBS) but our data does not show evidence of a major contribution of the mTOR signaling pathway toward the control of TOP mRNAs translation during myogenic differentiation, as we do not observe any enrichment of transcripts bearing a 5′ TOP and affected by a switch in TIS usage. Other studies have previously shown that the inhibition of mTOR can have different outcomes, from a major effect to little or no effect on TOP mRNA translation, depending on the cellular context (88). The ribosomal protein genes and translation factors which showed a switch in TIS usage did not contain a 5′ TOP, therefore we suggest that a different mechanism is used.
Next to genes involved in the translational apparatus, we found that many of the genes showing a switch in TIS usage are known to play a role in muscle development, maintenance and regeneration. Cryab (63,64), Spp1 (66), Tmbim6 (71) and Cs (73) have been previously shown to be regulated at transcriptional level during myogenic differentiation. Eno3 (67,68), Pgam (69) and Agl (70) have been related to metabolic myopathies, whereas Eno3 (74) and Spp1 (75) have been recently reported as biomarkers for muscular dystrophies. We showed that these genes are regulated at translational level by switches of alternative TIS usage between uORFs and pORFs during differentiation. Due to the many regulatory potential of uORFs, a full understanding of the translational control of these genes may be relevant for clinical purposes.
The contribution of mRNA translation in myogenesis
Even though we observed a general positive correlation between transcription and translation, suggesting that most of the regulation occurs at transcriptional level, we also observed a dampening effect of translational regulation. The causes of this dampening effect remain to be elucidated. Translation can be regulated by many different mechanisms. Here we specifically focused on the alternative use of start codons. Our study showed that 312 genes were subjected to switches in alternative TIS usage during differentiation. Although we showed that the presence of a myotube-specific promoter in Tpm3 resulted in an alternative TIS, we found that the majority of the switches detected at translational level was independent from transcription. Switches in TIS usage mostly occurred in genes with a single promoter, thus the transcription of genes from distinct promoters, and the translation initiation from distinct start codons, seem to be two complementary mechanisms to control gene and protein expression in myogenesis. Moreover, we showed that alternative promoters may also lead to recognition of regulatory uORFs located in the 5′-UTR, as shown for Cryab. Therefore, alternative TSS can be used to regulate protein levels. Nevertheless the detection of alternative TSSs may be challenging when TSSs are characterized by a broad peak (59). The DeepCAGE technology and the subsequent clustering procedure may not have the resolution to identify TSSs which are in close proximity, leading to the incorporation of alternative TSSs into one single TSS. Our analysis might therefore underestimate the number of alternative TSSs which are in very close proximity and therefore overestimate the number of switches in TIS usage exclusively dependent on the translational control. It remains to be investigated to which extent this phenomenon may alter our results.
A considerable amount of footprint mapped in the 5′-UTRs. Even though it is difficult to predict the effect of an uORF based on the length, many reports suggest that short uORFs are regulatory, whereas long uORFs and out-of-frame uORFs overlapping the pORF primarily inhibit protein synthesis (89,90). We showed that the majority of the non-overlapping uORFs were between 1–30 amino acids long, whereas the majority of the overlapping uORFs were longer than 30 amino acids, suggesting a likely stronger regulatory potential.
We further investigated the contribution of miRNAs in the regulation of translation, focusing on well-characterized myomiRs. For all experimentally validated targets we did not observe any major effect on translation inhibition. The amount of mRNAs targets present at transcriptome level and the amount of mRNAs targets translated reflected the general dampening effect observed for all other non-target genes, indicating that the myimiRs do not primarily affect the translational control of their target mRNAs.
In conclusion, our results demonstrate that translation initiation represent a layer of regulation of protein expression in myogenesis for specific subsets of functionally correlated genes.
ACCESSION NUMBER
European Nucleotide Archive PRJEB7207
SUPPLEMENTARY DATA
Supplementary Data are available at NAR Online.
Acknowledgments
We thank the Leiden Genome Technology Center (LGTC) for providing RNAseq libraries and sequencing, Henk Buermans for the quantitative analysis of the miRNAseq data using E-miR software, LUMC's Sequencing Analysis Support Core (SASC) for support on data submission to the European Nucleotide Archive (ENA), Martijn Vermaat and Jeroen Laros for support on Mutalyzer, Pietro Spitali for discussions on biomarkers for Duchenne muscular dystrophy.
FUNDING
Landsteiner Foundation for Blood Transfusion Research (LSBR) (in part). Funding for open access charge: LUMC.
Conflict of interest statement. None declared.
REFERENCES
- 1.Bentzinger C.F., Wang Y.X., Rudnicki M.A. Building muscle: molecular regulation of myogenesis. Cold Spring Harb. Perspect. Biol. 2012;4 doi: 10.1101/cshperspect.a008342. doi:10.1101/cshperspect.a008342. [DOI] [PMC free article] [PubMed] [Google Scholar]
- 2.Buckingham M., Rigby P.W. Gene regulatory networks and transcriptional mechanisms that control myogenesis. Dev. Cell. 2014;28:225–238. doi: 10.1016/j.devcel.2013.12.020. [DOI] [PubMed] [Google Scholar]
- 3.Moyes C.D., Mathieu-Costello O.A., Tsuchiya N., Filburn C., Hansford R.G. Mitochondrial biogenesis during cellular differentiation. Am. J. Physiol. 1997;272:C1345–C1351. doi: 10.1152/ajpcell.1997.272.4.C1345. [DOI] [PubMed] [Google Scholar]
- 4.David R. Small RNAs: miRNAs’ strict schedule. Nat. Rev. Genet. 2012;13:378. doi: 10.1038/nrg3251. [DOI] [PubMed] [Google Scholar]
- 5.Pimentel J., Boccaccio G.L. Translation and silencing in RNA granules: a tale of sand grains. Front. Mol. Neurosci. 2014;7:68. doi: 10.3389/fnmol.2014.00068. [DOI] [PMC free article] [PubMed] [Google Scholar]
- 6.Polesskaya A., Cuvellier S., Naguibneva I., Duquet A., Moss E.G., Harel-Bellan A. Lin-28 binds IGF-2 mRNA and participates in skeletal myogenesis by increasing translation efficiency. Genes Dev. 2007;21:1125–1138. doi: 10.1101/gad.415007. [DOI] [PMC free article] [PubMed] [Google Scholar]
- 7.Sterrenburg E., Turk R., ‘t Hoen P.A., van Deutekom J.C., Boer J.M., van Ommen G.J., Dunnen J.T. Large-scale gene expression analysis of human skeletal myoblast differentiation. Neuromuscul. Disord. 2004;14:507–518. doi: 10.1016/j.nmd.2004.03.008. [DOI] [PubMed] [Google Scholar]
- 8.Fritsch C., Herrmann A., Nothnagel M., Szafranski K., Huse K., Schumann F., Schreiber S., Platzer M., Krawczak M., Hampe J., et al. Genome-wide search for novel human uORFs and N-terminal protein extensions using ribosomal footprinting. Genome Res. 2012;22:2208–2218. doi: 10.1101/gr.139568.112. [DOI] [PMC free article] [PubMed] [Google Scholar]
- 9.Calkhoven C.F., Bouwman P.R., Snippe L., Ab G. Translation start site multiplicity of the CCAAT/enhancer binding protein alpha mRNA is dictated by a small 5′ open reading frame. Nucleic Acids Res. 1994;22:5540–5547. doi: 10.1093/nar/22.25.5540. [DOI] [PMC free article] [PubMed] [Google Scholar]
- 10.Calkhoven C.F., Muller C., Leutz A. Translational control of C/EBPalpha and C/EBPbeta isoform expression. Genes Dev. 2000;14:1920–1932. [PMC free article] [PubMed] [Google Scholar]
- 11.Cao J., Geballe A.P. Translational inhibition by a human cytomegalovirus upstream open reading frame despite inefficient utilization of its AUG codon. J. Virol. 1995;69:1030–1036. doi: 10.1128/jvi.69.2.1030-1036.1995. [DOI] [PMC free article] [PubMed] [Google Scholar]
- 12.Grant C.M., Hinnebusch A.G. Effect of sequence context at stop codons on efficiency of reinitiation in GCN4 translational control. Mol. Cell. Biol. 1994;14:606–618. doi: 10.1128/mcb.14.1.606. [DOI] [PMC free article] [PubMed] [Google Scholar]
- 13.Hill J.R., Morris D.R. Cell-specific translational regulation of S-adenosylmethionine decarboxylase mRNA. Dependence on translation and coding capacity of the cis-acting upstream open reading frame. J. Biol. Chem. 1993;268:726–731. [PubMed] [Google Scholar]
- 14.Landers J.E., Cassel S.L., George D.L. Translational enhancement of mdm2 oncogene expression in human tumor cells containing a stabilized wild-type p53 protein. Cancer Res. 1997;57:3562–3568. [PubMed] [Google Scholar]
- 15.Lincoln A.J., Monczak Y., Williams S.C., Johnson P.F. Inhibition of CCAAT/enhancer-binding protein alpha and beta translation by upstream open reading frames. J. Biol. Chem. 1998;273:9552–9560. doi: 10.1074/jbc.273.16.9552. [DOI] [PubMed] [Google Scholar]
- 16.Mize G.J., Ruan H., Low J.J., Morris D.R. The inhibitory upstream open reading frame from mammalian S-adenosylmethionine decarboxylase mRNA has a strict sequence specificity in critical positions. J. Biol. Chem. 1998;273:32500–32505. doi: 10.1074/jbc.273.49.32500. [DOI] [PubMed] [Google Scholar]
- 17.Raney A., Baron A.C., Mize G.J., Law G.L., Morris D.R. In vitro translation of the upstream open reading frame in the mammalian mRNA encoding S-adenosylmethionine decarboxylase. J. Biol. Chem. 2000;275:24444–24450. doi: 10.1074/jbc.M003364200. [DOI] [PubMed] [Google Scholar]
- 18.Ruan H., Shantz L.M., Pegg A.E., Morris D.R. The upstream open reading frame of the mRNA encoding S-adenosylmethionine decarboxylase is a polyamine-responsive translational control element. J. Biol. Chem. 1996;271:29576–29582. doi: 10.1074/jbc.271.47.29576. [DOI] [PubMed] [Google Scholar]
- 19.Schleiss M.R., Degnin C.R., Geballe A.P. Translational control of human cytomegalovirus gp48 expression. J. Virol. 1991;65:6782–6789. doi: 10.1128/jvi.65.12.6782-6789.1991. [DOI] [PMC free article] [PubMed] [Google Scholar]
- 20.Vanderperre B., Lucier J.F., Bissonnette C., Motard J., Tremblay G., Vanderperre S., Wisztorski M., Salzet M., Boisvert F.M., Roucou X. Direct detection of alternative open reading frames translation products in human significantly expands the proteome. PLoS One. 2013;8:e70698. doi: 10.1371/journal.pone.0070698. [DOI] [PMC free article] [PubMed] [Google Scholar]
- 21.Michel A.M., Choudhury K.R., Firth A.E., Ingolia N.T., Atkins J.F., Baranov P.V. Observation of dually decoded regions of the human genome using ribosome profiling data. Genome Res. 2012;22:2219–2229. doi: 10.1101/gr.133249.111. [DOI] [PMC free article] [PubMed] [Google Scholar]
- 22.Bazzini A.A., Lee M.T., Giraldez A.J. Ribosome profiling shows that miR-430 reduces translation before causing mRNA decay in zebrafish. Science. 2012;336:233–237. doi: 10.1126/science.1215704. [DOI] [PMC free article] [PubMed] [Google Scholar]
- 23.Hsieh A.C., Liu Y., Edlind M.P., Ingolia N.T., Janes M.R., Sher A., Shi E.Y., Stumpf C.R., Christensen C., Bonham M.J., et al. The translational landscape of mTOR signalling steers cancer initiation and metastasis. Nature. 2012;485:55–61. doi: 10.1038/nature10912. [DOI] [PMC free article] [PubMed] [Google Scholar]
- 24.Ingolia N.T., Lareau L.F., Weissman J.S. Ribosome profiling of mouse embryonic stem cells reveals the complexity and dynamics of mammalian proteomes. Cell. 2011;147:789–802. doi: 10.1016/j.cell.2011.10.002. [DOI] [PMC free article] [PubMed] [Google Scholar]
- 25.Ingolia N.T., Brar G.A., Rouskin S., McGeachy A.M., Weissman J.S. The ribosome profiling strategy for monitoring translation in vivo by deep sequencing of ribosome-protected mRNA fragments. Nat. Protoc. 2012;7:1534–1550. doi: 10.1038/nprot.2012.086. [DOI] [PMC free article] [PubMed] [Google Scholar]
- 26.Lee S., Liu B., Lee S., Huang S.X., Shen B., Qian S.B. Global mapping of translation initiation sites in mammalian cells at single-nucleotide resolution. Proc. Natl. Acad. Sci. U.S.A. 2012;109:E2424–E2432. doi: 10.1073/pnas.1207846109. [DOI] [PMC free article] [PubMed] [Google Scholar]
- 27.Uemura S., Aitken C.E., Korlach J., Flusberg B.A., Turner S.W., Puglisi J.D. Real-time tRNA transit on single translating ribosomes at codon resolution. Nature. 2010;464:1012–1017. doi: 10.1038/nature08925. [DOI] [PMC free article] [PubMed] [Google Scholar]
- 28.Ingolia N.T., Ghaemmaghami S., Newman J.R., Weissman J.S. Genome-wide analysis in vivo of translation with nucleotide resolution using ribosome profiling. Science. 2009;324:218–223. doi: 10.1126/science.1168978. [DOI] [PMC free article] [PubMed] [Google Scholar]
- 29.Lundberg E., Fagerberg L., Klevebring D., Matic I., Geiger T., Cox J., Algenas C., Lundeberg J., Mann M., Uhlen M. Defining the transcriptome and proteome in three functionally different human cell lines. Mol. Syst. Biol. 2010;6:450. doi: 10.1038/msb.2010.106. [DOI] [PMC free article] [PubMed] [Google Scholar]
- 30.Maier T., Guell M., Serrano L. Correlation of mRNA and protein in complex biological samples. FEBS Lett. 2009;583:3966–3973. doi: 10.1016/j.febslet.2009.10.036. [DOI] [PubMed] [Google Scholar]
- 31.Schwanhausser B., Busse D., Li N., Dittmar G., Schuchhardt J., Wolf J., Chen W., Selbach M. Global quantification of mammalian gene expression control. Nature. 2011;473:337–342. doi: 10.1038/nature10098. [DOI] [PubMed] [Google Scholar]
- 32.Tian Q., Stepaniants S.B., Mao M., Weng L., Feetham M.C., Doyle M.J., Yi E.C., Dai H., Thorsson V., Eng J., et al. Integrated genomic and proteomic analyses of gene expression in Mammalian cells. Mol. Cell. Proteomics. 2004;3:960–969. doi: 10.1074/mcp.M400055-MCP200. [DOI] [PubMed] [Google Scholar]
- 33.Vogel C., Abreu R.S., Ko D., Le S.Y., Shapiro B.A., Burns S.C., Sandhu D., Boutz D.R., Marcotte E.M., Penalva L.O. Sequence signatures and mRNA concentration can explain two-thirds of protein abundance variation in a human cell line. Mol. Syst. Biol. 2010;6:400. doi: 10.1038/msb.2010.59. [DOI] [PMC free article] [PubMed] [Google Scholar]
- 34.Li J.J., Bickel P.J., Biggin M.D. System wide analyses have underestimated protein abundances and the importance of transcription in mammals. PeerJ. 2014;2:e270. doi: 10.7717/peerj.270. [DOI] [PMC free article] [PubMed] [Google Scholar]
- 35.Tebaldi T., Re A., Viero G., Pegoretti I., Passerini A., Blanzieri E., Quattrone A. Widespread uncoupling between transcriptome and translatome variations after a stimulus in mammalian cells. BMC Genomics. 2012;13:220. doi: 10.1186/1471-2164-13-220. [DOI] [PMC free article] [PubMed] [Google Scholar]
- 36.Gonzalez C., Sims J.S., Hornstein N., Mela A., Garcia F., Lei L., Gass D.A., Amendolara B., Bruce J.N., Canoll P., et al. Ribosome profiling reveals a cell-type-specific translational landscape in brain tumors. J. Neurosci. 2014;34:10924–10936. doi: 10.1523/JNEUROSCI.0084-14.2014. [DOI] [PMC free article] [PubMed] [Google Scholar]
- 37.Oh E., Becker A.H., Sandikci A., Huber D., Chaba R., Gloge F., Nichols R.J., Typas A., Gross C.A., Kramer G., et al. Selective ribosome profiling reveals the cotranslational chaperone action of trigger factor in vivo. Cell. 2011;147:1295–1308. doi: 10.1016/j.cell.2011.10.044. [DOI] [PMC free article] [PubMed] [Google Scholar]
- 38.Hestand M.S., Klingenhoff A., Scherf M., Ariyurek Y., Ramos Y., van W.W., Suzuki M., Werner T., van Ommen G.J., den Dunnen J.T., et al. Tissue-specific transcript annotation and expression profiling with complementary next-generation sequencing technologies. Nucleic Acids Res. 2010;38:e165. doi: 10.1093/nar/gkq602. [DOI] [PMC free article] [PubMed] [Google Scholar]
- 39.Parkhomchuk D., Borodina T., Amstislavskiy V., Banaru M., Hallen L., Krobitsch S., Lehrach H., Soldatov A. Transcriptome analysis by strand-specific sequencing of complementary DNA. Nucleic Acids Res. 2009;37:e123. doi: 10.1093/nar/gkp596. [DOI] [PMC free article] [PubMed] [Google Scholar]
- 40.Buermans H.P., Ariyurek Y., van O.G., den Dunnen J.T., ‘t  Hoen P.A. New methods for next generation sequencing based microRNA expression profiling. BMC Genomics. 2010;11:716. doi: 10.1186/1471-2164-11-716. [DOI] [PMC free article] [PubMed] [Google Scholar]
- 41.Langmead B., Trapnell C., Pop M., Salzberg S.L. Ultrafast and memory-efficient alignment of short DNA sequences to the human genome. Genome Biol. 2009;10:R25. doi: 10.1186/gb-2009-10-3-r25. [DOI] [PMC free article] [PubMed] [Google Scholar]
- 42.Langmead B. Aligning short sequencing reads with Bowtie. Curr. Protoc. Bioinformatics. 2010 doi: 10.1002/0471250953.bi1107s32. doi:10.1002/0471250953.bi1107s32. [DOI] [PMC free article] [PubMed] [Google Scholar]
- 43.Wu T.D., Watanabe C.K. GMAP: a genomic mapping and alignment program for mRNA and EST sequences. Bioinformatics. 2005;21:1859–1875. doi: 10.1093/bioinformatics/bti310. [DOI] [PubMed] [Google Scholar]
- 44.Hashimoto T., de Hoon M.J., Grimmond S.M., Daub C.O., Hayashizaki Y., Faulkner G.J. Probabilistic resolution of multi-mapping reads in massively parallel sequencing data using MuMRescueLite. Bioinformatics. 2009;25:2613–2614. doi: 10.1093/bioinformatics/btp438. [DOI] [PubMed] [Google Scholar]
- 45.Langmead B., Salzberg S.L. Fast gapped-read alignment with Bowtie 2. Nat. Methods. 2012;9:357–359. doi: 10.1038/nmeth.1923. [DOI] [PMC free article] [PubMed] [Google Scholar]
- 46.Wildeman M., van O.E., den Dunnen J.T., Taschner P.E. Improving sequence variant descriptions in mutation databases and literature using the Mutalyzer sequence variation nomenclature checker. Hum. Mutat. 2008;29:6–13. doi: 10.1002/humu.20654. [DOI] [PubMed] [Google Scholar]
- 47.Quinlan A.R., Hall I.M. BEDTools: a flexible suite of utilities for comparing genomic features. Bioinformatics. 2010;26:841–842. doi: 10.1093/bioinformatics/btq033. [DOI] [PMC free article] [PubMed] [Google Scholar]
- 48.Robinson M.D., McCarthy D.J., Smyth G.K. edgeR: a Bioconductor package for differential expression analysis of digital gene expression data. Bioinformatics. 2010;26:139–140. doi: 10.1093/bioinformatics/btp616. [DOI] [PMC free article] [PubMed] [Google Scholar]
- 49.Benjamini Y., Hochberg Y. Controlling the false discovery rate: a practical and powerful approach to multiple testing. J. R. Stat. Soc. B. 1995;57:289–300. [Google Scholar]
- 50.Huang d.W., Sherman B.T., Lempicki R.A. Systematic and integrative analysis of large gene lists using DAVID bioinformatics resources. Nat. Protoc. 2009;4:44–57. doi: 10.1038/nprot.2008.211. [DOI] [PubMed] [Google Scholar]
- 51.de Klerk E., Venema A., Anvar S.Y., Goeman J.J., Hu O., den Dunnen J.T., van der Maarel S.M., Raz V., ‘t Hoen P.A. Poly(A) binding protein nuclear 1 levels affect alternative polyadenylation. Nucleic Acids Res. 2012;40:9089–9101. doi: 10.1093/nar/gks655. [DOI] [PMC free article] [PubMed] [Google Scholar]
- 52.Grillo G., Turi A., Licciulli F., Mignone F., Liuni S., Banfi S., Gennarino V.A., Horner D.S., Pavesi G., Picardi E., et al. UTRdb and UTRsite (RELEASE 2010): a collection of sequences and regulatory motifs of the untranslated regions of eukaryotic mRNAs. Nucleic Acids Res. 2010;38:D75–D80. doi: 10.1093/nar/gkp902. [DOI] [PMC free article] [PubMed] [Google Scholar]
- 53.Deutsch E.W., Mendoza L., Shteynberg D., Farrah T., Lam H., Tasman N., Sun Z., Nilsson E., Pratt B., Prazen B., et al. A guided tour of the Trans-Proteomic Pipeline. Proteomics. 2010;10:1150–1159. doi: 10.1002/pmic.200900375. [DOI] [PMC free article] [PubMed] [Google Scholar]
- 54.Guo H., Ingolia N.T., Weissman J.S., Bartel D.P. Mammalian microRNAs predominantly act to decrease target mRNA levels. Nature. 2010;466:835–840. doi: 10.1038/nature09267. [DOI] [PMC free article] [PubMed] [Google Scholar]
- 55.Ingolia N.T. Genome-wide translational profiling by ribosome footprinting. Methods Enzymol. 2010;470:119–142. doi: 10.1016/S0076-6879(10)70006-9. [DOI] [PubMed] [Google Scholar]
- 56.Trapnell C., Pachter L., Salzberg S.L. TopHat: discovering splice junctions with RNA-Seq. Bioinformatics. 2009;25:1105–1111. doi: 10.1093/bioinformatics/btp120. [DOI] [PMC free article] [PubMed] [Google Scholar]
- 57.Olshen A.B., Hsieh A.C., Stumpf C.R., Olshen R.A., Ruggero D., Taylor B.S. Assessing gene-level translational control from ribosome profiling. Bioinformatics. 2013;29:2995–3002. doi: 10.1093/bioinformatics/btt533. [DOI] [PMC free article] [PubMed] [Google Scholar]
- 58.Kim D., Pertea G., Trapnell C., Pimentel H., Kelley R., Salzberg S.L. TopHat2: accurate alignment of transcriptomes in the presence of insertions, deletions and gene fusions. Genome Biol. 2013;14:R36. doi: 10.1186/gb-2013-14-4-r36. [DOI] [PMC free article] [PubMed] [Google Scholar]
- 59.The FANTOM Consortium and the RIKEN PMI and CLST (DGT) A promoter-level mammalian expression atlas. Nature. 2014;507:462–470. doi: 10.1038/nature13182. [DOI] [PMC free article] [PubMed] [Google Scholar]
- 60.Puri P.L., Wu Z., Zhang P., Wood L.D., Bhakta K.S., Han J., Feramisco J.R., Karin M., Wang J.Y. Induction of terminal differentiation by constitutive activation of p38 MAP kinase in human rhabdomyosarcoma cells. Genes Dev. 2000;14:574–584. [PMC free article] [PubMed] [Google Scholar]
- 61.Ingolia N.T., Brar G.A., Stern-Ginossar N., Harris M.S., Talhouarne G.J., Jackson S.E., Wills M.R., Weissman J.S. Ribosome profiling reveals pervasive translation outside of annotated protein-coding genes. Cell Rep. 2014;8:1365–1379. doi: 10.1016/j.celrep.2014.07.045. [DOI] [PMC free article] [PubMed] [Google Scholar]
- 62.Pieples K., Wieczorek D.F. Tropomyosin 3 increases striated muscle isoform diversity. Biochemistry. 2000;39:8291–8297. doi: 10.1021/bi000047x. [DOI] [PubMed] [Google Scholar]
- 63.Singh B.N., Rao K.S., Rao C. Ubiquitin-proteasome-mediated degradation and synthesis of MyoD is modulated by alphaB-crystallin, a small heat shock protein, during muscle differentiation. Biochim. Biophys. Acta. 2010;1803:288–299. doi: 10.1016/j.bbamcr.2009.11.009. [DOI] [PubMed] [Google Scholar]
- 64.Neppl R.L., Kataoka M., Wang D.Z. Crystallin-alphaB regulates skeletal muscle homeostasis via modulation of argonaute2 activity. J. Biol. Chem. 2014;289:17240–17248. doi: 10.1074/jbc.M114.549584. [DOI] [PMC free article] [PubMed] [Google Scholar]
- 65.Casadei L., Vallorani L., Gioacchini A.M., Guescini M., Burattini S., D'Emilio A., Biagiotti L., Falcieri E., Stocchi V. Proteomics-based investigation in C2C12 myoblast differentiation. Eur. J. Histochem. 2009;53:261–268. doi: 10.4081/ejh.2009.e31. [DOI] [PMC free article] [PubMed] [Google Scholar]
- 66.Ishibashi J., Perry R.L., Asakura A., Rudnicki M.A. MyoD induces myogenic differentiation through cooperation of its NH2- and COOH-terminal regions. J. Cell Biol. 2005;171:471–482. doi: 10.1083/jcb.200502101. [DOI] [PMC free article] [PubMed] [Google Scholar]
- 67.Comi G.P., Fortunato F., Lucchiari S., Bordoni A., Prelle A., Jann S., Keller A., Ciscato P., Galbiati S., Chiveri L., et al. Beta-enolase deficiency, a new metabolic myopathy of distal glycolysis. Ann. Neurol. 2001;50:202–207. doi: 10.1002/ana.1095. [DOI] [PubMed] [Google Scholar]
- 68.Lamande N., Brosset S., Lucas M., Keller A., Rouzeau J.D., Johnson T.R., Gros F., Ilan J., Lazar M. Transcriptional up-regulation of the mouse gene for the muscle-specific subunit of enolase during terminal differentiation of myogenic cells. Mol. Reprod. Dev. 1995;41:306–313. doi: 10.1002/mrd.1080410305. [DOI] [PubMed] [Google Scholar]
- 69.Castella-Escola J., Urena J., Alterio J., Carreras J., Martelly I., Climent F. Expression of phosphoglycerate mutase mRNA in differentiating rat satellite cell cultures. FEBS Lett. 1990;268:24–26. doi: 10.1016/0014-5793(90)80963-j. [DOI] [PubMed] [Google Scholar]
- 70.Cheng A., Zhang M., Gentry M.S., Worby C.A., Dixon J.E., Saltiel A.R. A role for AGL ubiquitination in the glycogen storage disorders of Lafora and Cori's disease. Genes Dev. 2007;21:2399–2409. doi: 10.1101/gad.1553207. [DOI] [PMC free article] [PubMed] [Google Scholar]
- 71.Bultynck G., Kiviluoto S., Henke N., Ivanova H., Schneider L., Rybalchenko V., Luyten T., Nuyts K., De B.W., Bezprozvanny I., et al. The C terminus of Bax inhibitor-1 forms a Ca2+-permeable channel pore. J. Biol. Chem. 2012;287:2544–2557. doi: 10.1074/jbc.M111.275354. [DOI] [PMC free article] [PubMed] [Google Scholar]
- 72.Liu Y., Li J., Zhang F., Qin W., Yao G., He X., Xue P., Ge C., Wan D., Gu J. Molecular cloning and characterization of the human ASB-8 gene encoding a novel member of ankyrin repeat and SOCS box containing protein family. Biochem. Biophys. Res. Commun. 2003;300:972–979. doi: 10.1016/s0006-291x(02)02971-6. [DOI] [PubMed] [Google Scholar]
- 73.Kraft C.S., LeMoine C.M., Lyons C.N., Michaud D., Mueller C.R., Moyes C.D. Control of mitochondrial biogenesis during myogenesis. Am. J. Physiol. Cell Physiol. 2006;290:C1119–C1127. doi: 10.1152/ajpcell.00463.2005. [DOI] [PubMed] [Google Scholar]
- 74.Ayoglu B., Chaouch A., Lochmuller H., Politano L., Bertini E., Spitali P., Hiller M., Niks E.H., Gualandi F., Ponten F., et al. Affinity proteomics within rare diseases: a BIO-NMD study for blood biomarkers of muscular dystrophies. EMBO Mol. Med. 2014;6:918–936. doi: 10.15252/emmm.201303724. [DOI] [PMC free article] [PubMed] [Google Scholar]
- 75.Piva L., Gavassini B.F., Bello L., Fanin M., Soraru G., Barp A., Ermani M., Angelini C., Hoffman E.P., Pegoraro E. TGFBR2 but not SPP1 genotype modulates osteopontin expression in Duchenne muscular dystrophy muscle. J. Pathol. 2012;228:251–259. doi: 10.1002/path.4026. [DOI] [PMC free article] [PubMed] [Google Scholar]
- 76.Xu C., Xu W., Palmer A.E., Reed J.C. BI-1 regulates endoplasmic reticulum Ca2+ homeostasis downstream of Bcl-2 family proteins. J. Biol. Chem. 2008;283:11477–11484. doi: 10.1074/jbc.M708385200. [DOI] [PMC free article] [PubMed] [Google Scholar]
- 77.Forterre A., Jalabert A., Berger E., Baudet M., Chikh K., Errazuriz E., De L.J., Chanon S., Weiss-Gayet M., Hesse A.M., et al. Proteomic analysis of C2C12 myoblast and myotube exosome-like vesicles: a new paradigm for myoblast-myotube cross talk. PLoS One. 2014;9:e84153. doi: 10.1371/journal.pone.0084153. [DOI] [PMC free article] [PubMed] [Google Scholar]
- 78.Kristensen A.R., Gsponer J., Foster L.J. Protein synthesis rate is the predominant regulator of protein expression during differentiation. Mol. Syst. Biol. 2013;9:689. doi: 10.1038/msb.2013.47. [DOI] [PMC free article] [PubMed] [Google Scholar]
- 79.Branca R.M., Orre L.M., Johansson H.J., Granholm V., Huss M., Perez-Bercoff A., Forshed J., Kall L., Lehtio J. HiRIEF LC-MS enables deep proteome coverage and unbiased proteogenomics. Nat. Methods. 2014;11:59–62. doi: 10.1038/nmeth.2732. [DOI] [PubMed] [Google Scholar]
- 80.Wethmar K., Begay V., Smink J.J., Zaragoza K., Wiesenthal V., Dorken B., Calkhoven C.F., Leutz A. C/EBPbetaDeltauORF mice–a genetic model for uORF-mediated translational control in mammals. Genes Dev. 2010;24:15–20. doi: 10.1101/gad.557910. [DOI] [PMC free article] [PubMed] [Google Scholar]
- 81.Wasinger V.C., Zeng M., Yau Y. Current status and advances in quantitative proteomic mass spectrometry. Int. J. Proteomics. 2013;2013:180605. doi: 10.1155/2013/180605. [DOI] [PMC free article] [PubMed] [Google Scholar]
- 82.Menschaert G., Van C.W., Notelaers T., Koch A., Crappe J., Gevaert K., Van D.P. Deep proteome coverage based on ribosome profiling aids mass spectrometry-based protein and peptide discovery and provides evidence of alternative translation products and near-cognate translation initiation events. Mol. Cell Proteomics. 2013;12:1780–1790. doi: 10.1074/mcp.M113.027540. [DOI] [PMC free article] [PubMed] [Google Scholar]
- 83.van H.S., van I.M., Jacobi J., Boymans S., Essers P.B., de B.E., Hao W., MacInnes A.W., Cuppen E., Simonis M. Extensive localization of long noncoding RNAs to the cytosol and mono- and polyribosomal complexes. Genome Biol. 2014;15:R6. doi: 10.1186/gb-2014-15-1-r6. [DOI] [PMC free article] [PubMed] [Google Scholar]
- 84.Banfai B., Jia H., Khatun J., Wood E., Risk B., Gundling W.E., Jr, Kundaje A., Gunawardena H.P., Yu Y., Xie L., et al. Long noncoding RNAs are rarely translated in two human cell lines. Genome Res. 2012;22:1646–1657. doi: 10.1101/gr.134767.111. [DOI] [PMC free article] [PubMed] [Google Scholar]
- 85.Guttman M., Russell P., Ingolia N.T., Weissman J.S., Lander E.S. Ribosome profiling provides evidence that large noncoding RNAs do not encode proteins. Cell. 2013;154:240–251. doi: 10.1016/j.cell.2013.06.009. [DOI] [PMC free article] [PubMed] [Google Scholar]
- 86.Agrawal M.G., Bowman L.H. Transcriptional and translational regulation of ribosomal protein formation during mouse myoblast differentiation. J. Biol. Chem. 1987;262:4868–4875. [PubMed] [Google Scholar]
- 87.Ingolia N.T. Ribosome profiling: new views of translation, from single codons to genome scale. Nat. Rev. Genet. 2014;15:205–213. doi: 10.1038/nrg3645. [DOI] [PubMed] [Google Scholar]
- 88.Meyuhas O. Synthesis of the translational apparatus is regulated at the translational level. Eur. J. Biochem. 2000;267:6321–6330. doi: 10.1046/j.1432-1327.2000.01719.x. [DOI] [PubMed] [Google Scholar]
- 89.Kozak M. Constraints on reinitiation of translation in mammals. Nucleic Acids Res. 2001;29:5226–5232. doi: 10.1093/nar/29.24.5226. [DOI] [PMC free article] [PubMed] [Google Scholar]
- 90.Somers J., Poyry T., Willis A.E. A perspective on mammalian upstream open reading frame function. Int. J. Biochem. Cell Biol. 2013;45:1690–1700. doi: 10.1016/j.biocel.2013.04.020. [DOI] [PMC free article] [PubMed] [Google Scholar]
Associated Data
This section collects any data citations, data availability statements, or supplementary materials included in this article.