


Abstract
Mutations in the RecQ DNA helicase gene BLM give rise to Bloom's syndrome, which is a rare autosomal recessive disorder characterized by genetic instability and cancer predisposition. BLM helicase is highly active in binding and unwinding G-quadruplexes (G4s), which are physiological targets for BLM, as revealed by genome-wide characterizations of gene expression of cells from BS patients. With smFRET assays, we studied the molecular mechanism of BLM-catalyzed G4 unfolding and showed that ATP is required for G4 unfolding. Surprisingly, depending on the molecular environments of G4, BLM unfolds G4 through different mechanisms: unfolding G4 harboring a 3′-ssDNA tail in three discrete steps with unidirectional translocation, and unfolding G4 connected to dsDNA by ssDNA in a repetitive manner in which BLM remains anchored at the ss/dsDNA junction, and G4 was unfolded by reeling in ssDNA. This indicates that one BLM molecule may unfold G4s in different molecular environments through different mechanisms.
INTRODUCTION
Helicases are molecular motors that track along DNA and unwind duplex nucleic acids in an adenosine triphosphate (ATP) hydrolysis-dependent manner. These enzymes are involved in many of the processes of DNA metabolism, including recombination, replication, repair and telomere maintenance (1). RecQ DNA helicases constitute a ubiquitous family of helicases playing essential roles in maintaining genome stability in a wide range of organisms, from bacteria to higher eukaryotes (2). Human have five RecQ family members and deficiencies in three of them, BLM, WRN and RTS, cause Bloom (3), Werner (4) and Rothmund–Thomson syndromes (5), respectively (6–8).
Bloom syndrome (BS) is a rare human autosomal recessive disorder associated with dwarfism, immunodeficiency, reduced fertility and elevated levels of many types of cancer commonly affecting general population (3,9). The cells from patients with BS displayed chromosomal instability characterized by elevated rates of chromatid gaps, breaks, sister chromatid exchanges and quadriradials (10,11). As an ATP-dependent helicase, BLM protein, in addition to unwinding the canonical Watson–Crick duplex and alternative DNA structures including Holliday junction and double Holliday junction (12), is particularly active in vitro in unwinding G-quadruplex (G4) DNAs (13), a family of DNA structures comprising stacked arrangements of planar G-quartets that comprise four Hoogsteen-bonded guanines (14).
G4s have been shown to be implicated in several critical cellular processes including genomic DNA recombination, replication and telomere maintenance (15). Genome-wide bioinformatics analyses show that G4 sequence motifs are particularly clustered in the human genome and are enriched in telomeres, the ribosomal DNA, certain minisatellites, immunoglobulin heavy chain gene switch regions and gene regulatory regions (16,17). Molecular genetic manipulation has shown that mutation or deletion of the gene encoding Saccharomyces cerevisiae Pif1 helicase, which possesses G4 unfolding activity and suppresses genome instability at G4 motifs, obstructs replication fork movement and increases frequencies of chromosomal rearrangements in yeast strain (18,19). Furthermore, by ChIP-Seq analysis of human cells, Gray et al. have shown that 40% of Xeroderma pigmentosum complementation group B/D (XPB and XPD) binding sites overlap with G4 motifs, suggesting that G4s may form in human promoter regions and function as targets of transcriptional regulation (20). Consistent with the above observations, there is a significant difference in expression profiles between cultured normal fibroblasts and BLM gene depleted cell or/and cell lines derived from human patients suffering from Werner and BSs (21,22). The altered expressions of mRNAs are connected with the gene implicated in cell proliferation, survival, immune function and molecular mechanism of cancer (21). More interestingly, the altered gene expression in BS patient cells occurs specifically at loci containing G4s that are strongly enriched in transcriptional start sites and especially within the first intron of genes (21). While it is well established that BLM plays a wide range of roles through regulating G4 structures in cells, the fine mechanism by which BLM unfolds G4 structures is not fully understood. Therefore, understanding how different G4 structures are regulated by BLM both in vivo and in vitro is fundamentally and medically important.
Two recent studies have suggested that BLM-catalyzed G4 unwinding may be ATP-independent at high enough concentrations of the protein (23,24). In this study, we characterized ATP-dependent G4 unfolding by BLM at the single-molecule level and found that G4 unfolding was strongly influenced by the structural environments in which G4 is connected by ss- single-stranded or/and ds- double-stranded DNA (ss/dsDNA) in different ways. Depending on the particular G4 structure that BLM encounters, it may actively translocate along ssDNA to unfold G4 or remain anchored at the ss/dsDNA junction to reel in ssDNA and unfold the G4 structure repetitively. These findings that BLM uses different mechanisms to unfold intra-stranded G4s having different structural environments in cells may shed new light on the molecular mechanism of BLM-catalyzed G4 unfolding.
MATERIALS AND METHODS
Buffers
BLM reaction buffer contains 5 mM MgCl2, 100 mM KCl in 20 mM Tris-HCl, pH 8.0 with 10 μM DTT. For single-molecule measurements, 0.8% D-glucose, 1 mg/ml glucose oxidase (266 600 units/g; Sigma), 0.4 mg/ml catalase (2000–5000 units/mg; Sigma) and 1 mM Trolox were added to the reaction buffer (25).
DNA preparations
All oligonucleotides required to make the DNA substrates were purchased from Sangon Biotech (Shanghai, China). In single-molecule experiments, DNA constructs were composed of a G4 (or an ssDNA) strand and a complementary stem strand. In binding measurements, the substrate was an ssDNA, duplex DNA or G4. Sequences of all the oligonucleotides are listed in Supplementary Table S1. DNA used in single-molecule measurements was annealed with 1:3 mixture of the stem and G4 strands by incubating the mixture at 95°C for 5 min, then slowly cooling down to room temperature in about 7 h. The strand without biotin was used in excess to reduce the possibility of having non-annealed strand anchored at the coverslip surface. The concentration of stem strand was 2.5 μM and all annealing was carried out in 100 mM KCl, 20 mM Tris-HCl, pH 8.0.
BLM expression and purification
Truncated BLM642–1290 (core-BLM) was expressed and purified as previously descried (13). Structural study showed that the full-length BLM assembles into a ring structure (26), and the oligomerization domain has been mapped to the N-terminal tail. Due to the lack of oligomerization domain, core-BLM642–1290 should be in a monomeric form (27). For simplicity, we used the name BLM to represent core-BLM in this work, unless otherwise specified.
Fluorescence Resonance Energy Transfer (FRET) data acquisition
All smFRET experiments were carried out with a home-built objective-type total-internal-reflection microscopy at a constant temperature of 22°C. The coverslips (Fisher Scientific) and slides were cleaned thoroughly by a mixture of sulfuric acid and hydrogen peroxide, acetone and sodium ethoxide, then the surfaces of coverslips were coated with a mixture of 99% monomethoxy-polyethylene glycol (m-PEG-5000, Laysan Bio, Inc.) and 1% of biotin-PEG (biotin-PEG-5000, Laysan Bio, Inc.). Streptavidin (10 μg/ml) in buffer containing 100 mM KCl, 20 mM Tris-HCl, pH 8.0 was added to the microfluidic chamber made of the PEG-coated coverslip and was incubated for 10 min. After washing, 50 pM DNA were added to the chamber and allowed to be immobilized for 10 min. Then free DNA was removed by washing with the reaction buffer. After that, chamber was filled with reaction buffer with oxygen scavenging system (0.8% D-glucose, 1 mg/ml glucose oxidase, 0.4 mg/ml catalase and 1 mM Trolox). Imaging was initiated before BLM and ATP were flowed into the chamber. We used an exposure time of 33–100 ms for single-molecule measurements.
FRET data analyses
The FRET efficiency was calculated using IA/(ID + IA), where ID and IA represent the intensity of donor and acceptor, respectively. The FRET value above 1 is due to background subtraction from very low intensity in the donor channel, giving rise to negative donor intensity. Basic data analysis was carried out by scripts written in Matlab, and all data fitting was generated by Origin 8.0. Single-molecule FRET histograms were generated by picking the initial ∼20 frames of each trace from ∼300 molecules. An automated step-finding method (from http://bio.physics.illinois.edu/HaMMy.asp) was employed to characterize the stepwise patterns observed in G4 unfolding, and the average EFRET value and dwell time for each step were determined accordingly. The resulting histograms of FRET values and dwell time from ∼100 molecules were fitted with multi-peak Gaussian distribution, γ distribution or single-exponential decay, respectively.
Equilibrium DNA binding assay
Binding of BLM to DNA was analyzed by fluorescence polarization assay using Infinite F200 PRO (TECAN) (28). DNA (ssDNA, duplex or G4) labeled with fluorescein was used in this study. Varying amounts of protein were added to a 150 μl aliquot of binding buffer (20 mM Tris-HCl, pH 8.0, 100 mM KCl, 1 mM magnesium acetate, 1 mM DTT) containing 2 nM DNA. Each sample was allowed to equilibrate in solution for 5 min, and then fluorescence polarization value was measured. The equilibrium dissociation constant was determined by fitting the data to the standard hyperbolic equation using KaleidaGraph (Synergy Software).
RESULTS
BLM-catalyzed G4 unfolding is ATP dependent
BLM was well recognized as an ATP hydrolysis-driven helicase (13,28). To characterize ATP-dependent BLM-catalyzed G4 unwinding by using the smFRET assay, we prepared the fluorescently labeled G4 substrate as described in the ‘Materials and Methods’ section. A three-layered G4 was linked with a 29-bp duplex DNA at its 5′ end and a 12-nt ssDNA at its 3′ end (Figure 1A). The G4-containing ssDNA was labeled with a donor fluorophore (Cy3) at the junction between the G4 motif and 3′ tail. Its 5′ tail was hybridized with a complementary stem strand that was modified at the 3′ end by biotin for immobilization and labeled with an acceptor fluorophore (Cy5) at the sixth nucleotide from the 5′ end (this G4 substrate was refereed to as dG4s).
Figure 1.
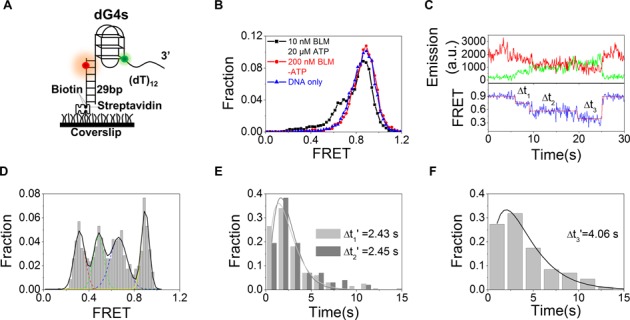
BLM-catalyzed G4 unfolding is ATP dependent and has three discrete steps. (A) Schematic diagram of Cy3 (green)- and Cy5 (red)-labeled DNA construct (dG4s) with G4 having three G-quartet planes. The G4 strand and the complementary stem strand are annealed to form a duplex stem. Biotin is used to immobilize the DNA to a streptavidin-coated coverslip surface. (B) FRET histograms for dG4s alone, in the presence of 200 nM BLM and of 10 nM BLM with 20 μM ATP. (C) Representative time traces of fluorescence emission intensities of Cy3 and Cy5 (upper panel) and FRET trace (lower panel) with 10 nM BLM and 1 μM ATP. Individual steps were determined by an automated step-finding algorithm (red). Δt1−3 denotes the dwell times for the three FRET states. (D) Distribution of the average EFRET collected from ∼100 molecules. Multi-peak Gaussian fitting gives four peaks at 0.90, 0.66, 0.48 and 0.32, respectively. (E,F) Histograms of dwell times for the unfolding steps. The lines are γ-distribution fitting according to equation: Fraction = (Δt)N−1exp(−kΔt), with k being the rate of stepping and N the number of steps. Then N/k is calculated as the time constant or average dwell time (Δt1−3′) as given in the figures.
The stability and homogeneity of the G4 structure depends on the concentration and type of cation (29,30). To characterize the BLM-catalyzed G4 unfolding by smFRET assay under appropriate experimental conditions in which G4 conformation is well defined and stable, we first analyzed smFRET spectrum of dG4s folded in 20 mM Tris-HCl buffer and in the presence of different concentrations of KCl and MgCl2 (Supplementary Figure S1). We found that in the presence of 100 mM K+ and 5 mM Mg2+, the FRET distributions of dG4s are composed of a major Gaussian peak around 0.89 and a minor peak around 0.72 (Supplementary Figure S1D), corresponding to well-folded anti-parallel and parallel G4 structures, respectively (29,31). This buffer condition was then used for further BLM-catalyzed G4-unfolding experiments.
A previous smFRET study has shown that co-incubation of G4 with varying BLM concentration (100 nM−2 μM) for 15 min leads to 16–45% unfolding of G4 in the absence of ATP or in the presence of the non-hydrolysable ATP analog ATP-γ-S (23). To observe ATP-regulated G4 unfolding under single-molecule experimental conditions, we varied the protein concentration to determine the lowest protein level at which FRET traces of BLM-catalyzed unfolding of G4 can be recorded. We pre-incubated 10–200 nM BLM with dG4s for 2 min and then recorded directly the FRET traces. In the absence of ATP, no significant FRET signal change can be observed even when the protein concentration was as high as 200 nM (Figure 1B). However, in the presence of 20 μM ATP, the high-FRET population (EFRET ∼ 0.9) decreases, accompanied by an increasing of the low-FRET population (EFRET ∼ 0.7) (Figure 1B), even though the BLM concentration was as low as 10 nM. These results indicate that BLM-catalyzed G4 unfolding is ATP dependent, consistent with previous bulk observations (13). It is noteworthy that this result is also consistent with a recent smFRET study showing that, for a G4 DNA resembling our dG4s, BLM failed to unfold it in the absence of ATP (24).
BLM unfolds dG4s in a stepwise manner
We recorded a series of FRET signals at varying protein and ATP concentrations with dG4s substrate. We have observed significant FRET changes with protein and ATP concentrations as low as 10 nM and 1 μM, respectively (Figure 1C and Supplementary Figure S2A). Before unfolding initiation, the FRET signal for the well-folded dG4s is high due to the proximity of the two fluorescent dyes. After addition of ATP and BLM, the FRET signal decreases in three discrete steps. By determining the FRET value of each step using the step-finding algorithm, four different peaks that correspond to four different conformational states of the dG4s DNA are clearly seen in the FRET histogram (Figure 1D). The lowest (EFRET = 0.32) and highest (EFRET = 0.90) states could be attributed to the unfolded and well-folded G4 conformations, respectively. According to our previous study and other reports (30–32), the two additional peaks (EFRET = 0.48 or 0.66) probably represent the G-hairpin and G-triplex conformations, respectively. Note that G4 in Figure 1C adopts an anti-parallel conformation, according to the initial FRET value (∼0.9). Supplementary Figure S2B shows that parallel G4 (initial FRET value ∼0.7) was also unfolded by BLM in a stepwise manner.
From analyzing the dwell time distributions of the different conformational states (Figure 1E and F), we found that while Δt1′ and Δt2′ are essentially the same (2.43 versus 2.45 s), Δt3′ is about 2-fold higher than Δt1′ and Δt2′, similar to the result for Pif1-catalyzed G4 unfolding (33). Based on our above assignments of the four states, Δt1 should correspond to the time-interval taken by BLM to translocate to and unfold the G-triplex (to hairpin), Δt2 should correspond to the time-interval taken by BLM to translocate to and unfold the hairpin. The result indicates that the two unfolding processes are similar. Δt3 corresponds to the time taken by BLM to dissociate, allowing the unfolded DNA to refold back to G4 structures again.
In addition to the 3-step G4 unfolding, we have also observed 2-step unfolding occasionally (Supplementary Figure S2C). In these cases, the FRET distribution has three peaks at 0.46, 0.67 and 0.91, respectively (Supplementary Figure S2D). These three positions are quite similar to the three high FRET peaks (0.48, 0.66 and 0.90) observed in the case of 3-step unfolding (Figure 1D), but the peak with the lowest FRET value (EFRET = 0.32) is absent. This suggests that, in some cases, BLM may just unfold G4 structure partially into G-hairpin and then dissociate from the substrate.
BLM unfolds G4 rapidly and then unwinds the duplex repetitively at higher ATP concentration
As the ATP concentration was increased to 20 μM, the G4 unfolding became more rapid and the above observed unfolding steps were no longer obvious because of the limited time resolution (Figure 2A). This was expected, but what was surprising is that, the rapid G4 unfolding was followed by a continuous oscillation of the FRET signal between ∼0.3 and ∼0.65, with a time duration (t1) averaged at 7.83 s (Figure 2B, left panel). Finally, the FRET signal would return back to the highest value that corresponded to well-folded G4 after BLM dissociation. Then another G4 unfolding and FRET oscillation event restarted after a waiting time (t2) averaged at 6.69 s (Figure 2B, left panel), which should be the average time taken by BLM to rebind the DNA substrate. With the increase of BLM concentration, the average waiting time t2′ decreases, indicating higher probability for BLM to rebind the DNA substrate, while the average oscillation time t1′ remains constant, suggesting the FRET oscillation is induced by a BLM monomer and independent of BLM concentration (Figure 2B, right panel).
Figure 2.
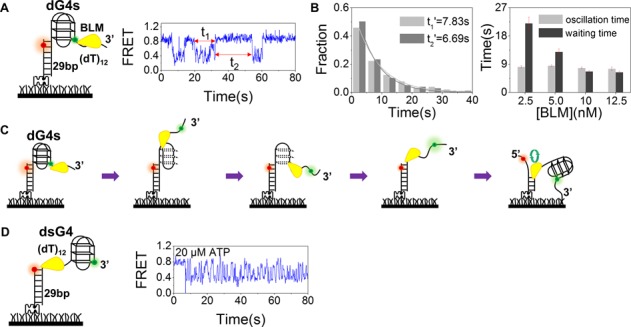
BLM unfolds dG4s at 20 μM ATP. (A) A representative FRET time trace showing G4 unfolding by 10 nM BLM with 20 μM ATP. After rapid G4 unfolding, the FRET signal oscillates between 0.3 and 0.7 with a time duration of t1 then returns back to the original value after a waiting time of t2. (B) Histograms of the oscillation time t1 and waiting time t2 in the case of 10 nM BLM with the time constants t1′ and t2′ being obtained from single-exponential fittings (left panel), and the dependences of t1′ and t2′on BLM concentration (right panel). (C) A schematic representation of our proposed model showing that after G4 unfolding, BLM switches strands and unwinds the DNA duplex repetitively. (D) When G4 is separated from the duplex DNA by a 12-nt ssDNA linker, repetitive fluctuations remain, indicating that BLM directly binds to ssDNA and then unwinds the duplex region repetitively.
A reasonable interpretation for the observed FRET oscillation is that after G4 unfolding, BLM starts to unwind the duplex DNA while leaving the refolded G4 structure intact. The observed oscillation should correspond to the repetitive unwinding of the duplex DNA through continuous strand-switching (Figure 2C), as observed previously by Yodh et al. (34). The repetitive unwinding of the duplex DNA would continue until BLM dissociates. If this explanation is correct, it is expected that (i) the repetitive duplex unwinding must be G4-unfolding dependent, because only G4 unfolding provides the opportunity for BLM to bind and unwind the duplex (Supplementary Figure S3); (ii) if the duplex and the G4 motif are separated by a fragment of ssDNA long enough for BLM binding, FRET oscillations would still occur even without G4 unfolding; and (iii) shortening the duplex length would allow BLM to completely unwind the dsDNA and lead to the escape of the Cy3-labeled DNA strand from the surface, thus abolishing the oscillation phenomenon.
We therefore performed three additional experiments. Firstly, we studied BLM-catalyzed unfolding with three types of DNA substrates: (i) there is no ssDNA tail at the 3′ end of the G4 motif (Supplementary Figure S3A); (ii) a tailless G4 motif with its 3′ end connecting to the DNA duplex (Supplementary Figure S3B) or (iii) the G4 motif has an ssDNA tail at its 5′ end (Supplementary Figure S3C). For these substrates, no FRET signal change has been observed in the presence of 10 nM BLM and 20 μM ATP (Supplementary Figure S3A−C), showing that a 3′ tail is absolutely required for BLM to bind and unfold G4 and BLM-catalyzed G4 unfolding obeys strictly the 3′-5′ directionality (13). This is also consistent with our binding affinity measurements performed with different DNA structures, showing that BLM binds preferentially to ssDNA other than dsDNA or G4 (Supplementary Figure S3D−F). As a consequence, no strand switching occurs due to the fact that no ssDNA is available or the available ssDNA at its 5′ end violates its directionality. Secondly, we performed G4 unfolding assay with a DNA substrate (dsG4) in which a tailless G4 motif and the 29-bp duplex DNA were linked by 12-nt ssDNA (Figure 2D). We noted that the introduction of 12-nt ssDNA resulted in a decrease of the high FRET value from 0.9 to 0.8 (compare Figure 2A with Figure 2D). Upon addition of BLM and ATP, the FRET signal oscillates between ∼0.4 and ∼0.8 (Figure 2D). The fact that no further decrease of FRET value in dsG4 substrate was observed in the unfolding reaction with dsG4 (the lowest FRET value ∼ 0.4) indicated that BLM unwound the duplex stem directly while leaving the G4 structure intact. This is consistent with the above observations that BLM unfolds G4 in a strict 3′-5′ directionality and needs a 3′-tail. Thirdly, we performed FRET assay using a substrate the same as the previous dsG4, except that the duplex was truncated from 29 to 16 bp. As expected, upon addition of 10 nM BLM and 20 μM ATP, the percentage of complete duplex DNA unwinding was increased from 9.3 to 87.3% within 2 min, as judged from the fraction of remaining Cy5 spots (33). Altogether, the above experiments confirmed that in the presence of high ATP concentration, after G4 unfolding, BLM may initiate duplex unwinding in a repetitive manner. The mechanism for this repetitive unwinding will be further discussed later.
As our previous experiments showed that the 3-layered G4 structure in the dG4s substrate is readily unfolded by BLM, we were wondering whether a G4 structure with four tetrad layers can be equally well unfolded. Unexpectedly, we found that BLM failed to unfold the 4-layered G4 at various ATP concentrations (up to 500 μM) (Supplementary Figure S4A). The inability of BLM to unfold 4-layered G4 is not sequence- and lateral loop-specific, since the G4 prepared with insulin linked polymorphism sequence cannot be unfolded as well (Supplementary Figure S4B). These results suggested that when BLM binds to dG4s type substrate, it cannot convert chemical energy into enough mechanical force to overcome the energy barriers of 4-layered G4 for unfolding it. Previously, it was reported that G4 is less stable in Na+ buffer (35), we thus performed the unfolding experiments in Na+ buffer. Under the same experimental conditions, while 4-layered G4 could not be unfolded by BLM in the K+ buffer, it could be unfolded significantly in Na+ buffer (Supplementary Figure S4C), consistent with the above interpretation. Taken together, those results indicate that BLM unwinding activity is highly sensitive to the substrate stability and further confirm the observations at the single-molecule level of Liu et al. that G4 hindered the translocation of BLM helicase on DNA, and the unwinding efficiency varied significantly among G4 structures, which correlated with the stability of those structures (36).
Folding conformations and stability of G4 at the 5′ end of a partial duplex DNA (G4sd)
In addition to the previous studies with the dG4s substrate, we next studied BLM-catalyzed G4 unfolding with another substrate, G4sd, in which the G4 motif and dsDNA was separated by a 12-nt ssDNA (Figure 3A). Such a G4 structure may be formed in the lagging strand during DNA replication and RNA transcription (37). Before unfolding studies, we first analyzed the possible conformations and stability of G4sd under different ion conditions by inspecting the FRET traces. Histograms of FRET efficiencies for G4sd in different concentrations of K+ and Mg2+ showed that both ions influence significantly the G4 conformations (Figure 3B and Supplementary Figure S5). At 100 mM K+ and 5 mM Mg2+, the FRET histogram displays two peaks at 0.56 and 0.76, respectively (Figure 3C). According to previous studies (29,31) the two peaks are assigned to parallel (EFRET = 0.57) and anti-parallel (EFRET = 0.76) conformations of G4. As only one G4 conformation (i.e. parallel) is dominating (82.3%), this ion condition was further used in the following unfolding experiments.
Figure 3.
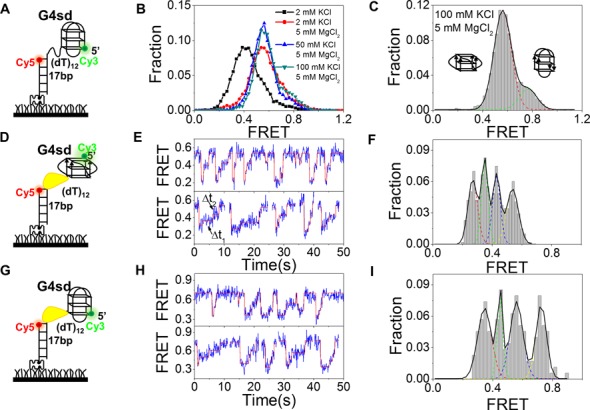
BLM unfolds G4sd. (A) Schematic diagram of the Cy3- and Cy5-labeled DNA construct G4sd where the G4 motif and 17-bp dsDNA are separated by a 12-nt ssDNA. (B) FRET histograms of the G4sd structure at different concentrations of KCl and MgCl2. (C) FRET histogram of G4sd in 100 mM KCl and 5 mM MgCl2. The histogram can be well fitted with two Gaussian peaks at 0.76 and 0.56, indicating the coexistence of the anti-parallel and parallel G4 structures in the solution. (D,E) Schematic diagram of G4sd with parallel G4 structure (left panel) and representative FRET time traces with 10 nM BLM and 1 μM ATP. The automated step-finding algorithm was used to identify the individual steps (red line) during G4 unfolding and refolding. (F) FRET distribution collected from ∼100 molecules. Multi-peak Gaussian fitting gives four peaks at 0.54, 0.43, 0.35 and 0.27, respectively. (G,H) Schematic diagram of G4sd with anti-parallel G4 structure (left panel) and representative FRET time traces with 10 nM BLM with 1 μM ATP. (I) FRET distribution collected from ∼100 molecules. Multi-peak Gaussian fitting gives four peaks at 0.73, 0.56, 0.45 and 0.35, respectively.
BLM-catalyzed G4sd unwinding displays an unusual unfolding and refolding behavior
To compare with the previous unfolding results obtained with dG4s, we studied the BLM-catalyzed unfolding of G4sd at the same BLM and ATP concentrations (10 nM BLM and 1 μM ATP) as before. From the FRET traces (Figure 3E and H), it can be noticed that BLM-catalyzed G4sd unfolding displays two striking features. (i) Whether the initial FRET signal of G4sd is at ∼0.56 or ∼0.76 that corresponds to the two above-mentioned G4 conformations in the absence of BLM and ATP (Figure 3C), upon addition of BLM and ATP, FRET signal starts to oscillate (Figure 3E and H). If the FRET signal is initially at ∼0.56, it will then oscillate between ∼0.56 and ∼0.2 (Figure 3E). In the other case, the FRET signal will oscillate between ∼0.76 and ∼0.3 (Figure 3H). These indicate that each form of G4 undergoes BLM-catalyzed unfolding and refolding repetitively. Note that at the same BLM and ATP concentrations (10 nM BLM and 1 μM ATP), there is no repetitive unfolding–refolding behavior with the dG4s DNA (Figure 1C and Supplementary Figure S2A). (ii) In each cycle, the decrease of FRET is rapid and in a single step, then the FRET recovery usually takes three steps for both G4 conformations (Figure 3E and H). Distributions of the FRET signals during the rising processes have four peaks (Figure 3F and I), further confirming that the FRET signal returns to its initial value through three steps.
The observed one-step decrease in FRET value results from BLM binding, but not G4 unfolding
At a first glance, the above FRET traces can be easily interpreted as that the G4 unwinding process is extremely rapid in a single step and then the unfolded G4 refolds slowly to its native state through three discrete steps. The two processes occur repetitively, resulting to the observed oscillation phenomenon. However, if we assume that BLM unfolds G4 very rapidly without intermediates, it means that the G4sd substrate is unfolded through a new mechanism by which the three layers of G4 are simultaneously disrupted upon BLM and ATP addition. Furthermore, refolding of the unfolded G4 in distinct steps in smFRET experiments has never been observed and reported previously. In contrast, an unfolded G4 DNA has been observed to refold immediately (∼0.2 s) (32,33).
To further study the observed phenomena, we performed the following additional experiments. We noted that whether the initial FRET value was EFRET ≈ 0.53 or 0.73, after addition of 10 nM BLM and 1 μM ATP, it dropped abruptly to low values (0.26 or 0.35; Figure 3E and H). We wondered whether the abrupt drop in FRET is ATP dependent. We then recorded the FRET traces in the presence of 10 nM BLM alone. Surprisingly, the FRET drop traces (Figure 4A) were almost identical to what we observed before when both BLM and ATP were present (Figure 3E and H), except that the low-FRET state may last as long as 30−50 s and then returns to the initial high-FRET state abruptly without discrete steps (Figure 4A). Furthermore, the BLM binding-induced FRET drop was not influenced by addition of 1 μM AMPPNP (Supplementary Figure S6A). We think that the above phenomena can be explained as follows. The initial FRET signal is high because the highly flexible 12-nt ssDNA may allow the two fluorophores to be in close proximity as previously reported (33). Upon addition of BLM, the FRET signal suddenly drops because the protein binding stretches the ssDNA (33,38,39). If this is true, we should observe the same phenomenon with a substrate in which the G4 motif is replaced by an ssDNA labeled with Cy3 at the 5′ end. Indeed, BLM binding stretched the 20-nt ssDNA and then reduced abruptly the FRET signal in the absence of ATP (Supplementary Figure S6B), exactly as we observed with the G4sd substrate.
Figure 4.
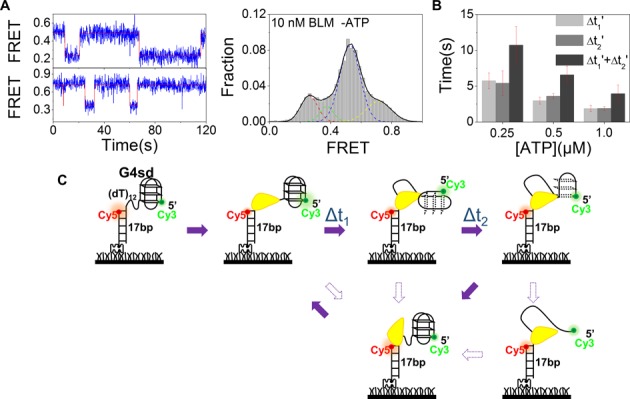
Abrupt decrease of FRET signal and its recovery in a stepwise manner are related to BLM binding and G4 unfolding. (A) FRET traces (left panel) of G4sd in parallel (upper) and anti-parallel (lower) conformations recorded in the presence of 10 nM BLM alone. The FRET histogram (right panel) from over 300 molecules confirms that the BLM binding alone is able to induce FRET decrease from 0.53 to 0.26 for parallel G4 and from 0.71 to 0.37 for anti-parallel G4. (B) The determined average dwell times from G4sd unfolding (Figure 3E) as a function of ATP concentration. Error bars represent the standard deviation (s.d.) from three or more experiments. (C) Schematic diagram of our proposed model to explain how BLM unfolds G4sd repetitively. More details are described in the text.
We then analyzed the dwell times in the FRET increase processes at different ATP concentrations. We found that the both average dwell times Δt1′ and Δt2′ decreased as ATP concentration increased (Figure 4B), suggesting that high ATP concentrations accelerate the FRET increase processes. The fact that the recovery of FRET signal is ATP dependent implies that the FRET increase processes are related to G4 unfolding, but not G4 refolding, because G4 refolding should not be ATP dependent.
Based on the above experiments, we proposed the following model to interpret the BLM-catalyzed G4sd unfolding processes (Figure 4C). BLM binding stretches the ssDNA, resulting in an abrupt FRET signal decrease. Then, ATP hydrolysis initiates the BLM-catalyzed G4 unfolding through a mechanism by which BLM remains bound to the ss/dsDNA junction during G4 unfolding. In this case, BLM does not translocate along DNA, but it ‘sits’ on the junction, reels in the ssDNA and extrudes an ssDNA loop while unfolding G4. Thus the unfolding process leads to the observed FRET signal increase in three discrete steps, but not FRET decrease as in the case of G4 unfolding with dG4s (Figure 1C). After the unfolded DNA is released and rapidly refolds to G4, BLM repeats the G4 unfolding process again.
BLM reels in ssDNA repetitively
In the above model, we assumed that BLM remained anchored at the 3′ ss/dsDNA junction and reeled in ssDNA by its 3′-5′ translocation activity. To confirm this and probe the ssDNA extruding processes, we then modified the G4sd substrate by removing the G4 motif and thus performed FRET assay simply using a duplex DNA with a 5′ overhang. Cy3 and Cy5 were labeled at the two ends of the 40-nt overhang and the FRET signal was initially low (Figure 5A). Upon addition of BLM and ATP, the FRET traces showed a periodic oscillation resembling that we observed with the G4sd substrate (Figure 5A). We also pre-incubated BLM with the above substrate (dT)40 for 5 min and then washed the free protein out with the imaging buffer containing only ATP. A similar repetitive phenomenon was still observed (Supplementary Figure S7), indicating that the FRET oscillation was induced by the same BLM monomer, rather than the binding and release of different proteins. Exchange of the labeling positions of the two fluorescent dyes did not change the oscillation phenomenon (Figure 5B), indicating that it is not an artifact due to fluorophore labeling.
Figure 5.
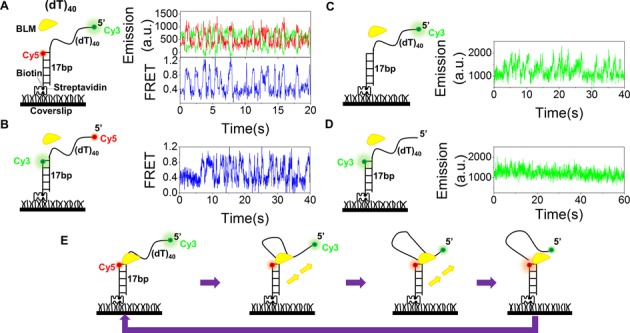
BLM reels in ssDNA periodically. (A,B) Single-molecule fluorescence emission and FRET traces show repetitive translocation of BLM on (dT)40 with different labeling positions of Cy3 and Cy5. Experiments were performed under the same experimental conditions (10 nM BLM, 20 μM ATP and 50 pM DNA). (C,D) Emissions were recorded with 10 nM BLM and 50 pM 40-nt partial duplex DNA labeled with Cy3 at the 5′ end (C) and at the ss/dsDNA junction (D). Emission traces show repetitive enhancement of Cy3 emission by BLM only when Cy3 is labeled at the 5′ end. (E) Schematic diagram of a proposed model for the repetitive ssDNA looping.
Next, we further used the PIFE (Protein Induced Fluorescence Enhancement) assay to study the phenomenon (40). PIFE signal does not provide absolute distance information, but it may vary with the binding position of the protein relative to the Cy3 donor. Protein binding near Cy3 would increase its fluorescence emission. While the emission traces of the DNA substrate labeled with Cy3 at the 5′ end of the ssDNA display an oscillation (Figure 5C), that labeled at the ss/dsDNA junction is stable over 1 min (Figure 5D). The latter clearly indicates that BLM remains at the ss/dsDNA junction during its translocation. Altogether, these results have further confirmed our proposal that, with the G4sd substrate or 5′-tailled duplex DNA without G4, the BLM helicase remains anchored at the ss/dsDNA junction and reels in the ssDNA repetitively (Figure 5E), just as observed previously for PcrA and Pif1 (33,38). In this model, while BLM remains anchored to the ss/dsDNA junction, the ssDNA is extruded from its 3′ end by the translocase activity of BLM and its 5′ end is transported to the junction, forming an ssDNA loop. Then, BLM releases the 5′ end and another cycle begins. This model is consistent with the recent published three-dimensional BLM structure, in which ssDNA and dsDNA are bound by two distinct domains (41). In addition, a similar repetitive phenomenon has been observed when the assay was performed with a partial duplex DNA possessing 20-nt overhang at its 5′ end. Similarly, FRET value first decreases to ∼0.5 due to the binding of BLM to ssDNA then increases to ∼0.9 due to the formation of an ssDNA loop, further confirming the above proposed model (Supplementary Figure S6C).
Repetitive looping properties
The kinetic smFRET traces of BLM-catalyzed translocation are characterized by a waiting time (Δt1) and a translocation time (Δt2) (Figure 6B). While the histogram of Δt1 can be described by a single-exponential decay, that of Δt2 is best fitted by a γ distribution, indicating that BLM translocates through multiple steps (Figure 6C and D). Furthermore, the average values of both Δt1 and Δt2 decrease with increasing ATP concentration (Figure 6E). 1/Δt2′ as a function of ATP concentration was best fitted by the Michaelis–Menten equation with KM = 15.6 ± 1.7 μM (Figure 6F). BLM is a low processive helicase for duplex DNA unwinding (42). To study its processivity in translocation along ssDNA, the above experiments were performed by increasing the overhang lengths from 30 to 70 nt (Figure 7A). From the FRET trajectories obtained with the different substrates, the FRET histograms were constructed (Figure 7B). Each histogram was characterized by three peaks. The low-FRET peak (P1) should be related to the ssDNA overhang length and, as expected, its position shifted regularly to lower FRET values as the overhang length was increased. The high-FRET peak (P3) was assigned to ssDNA looping state in which the 5′ end was reeled in and was near the ss/dsDNA junction. The population of this state decreased with the increasing overhang length (Figure 7C), suggesting that the probability for the 5′ end to be reeled in near the ss/dsDNA junction became lower and lower as the overhang length was increased. This means that BLM catalyzed ssDNA looping with a limited processivity. Therefore, the medium-FRET peak (P2) can be assigned as an abortion population during ssDNA looping due to the low BLM processivity. From the above results, we estimated that the translocation processivity of BLM is around ∼45 nt (Figure 7C), which is consistent with previous studies (43). The average waiting time (Δt1′) has also been determined and was independent of the ssDNA length (Figure 7D). This is reasonable because it corresponds to the time taken by BLM at the ss/dsDNA junction to initiate the reeling in ssDNA.
Figure 6.
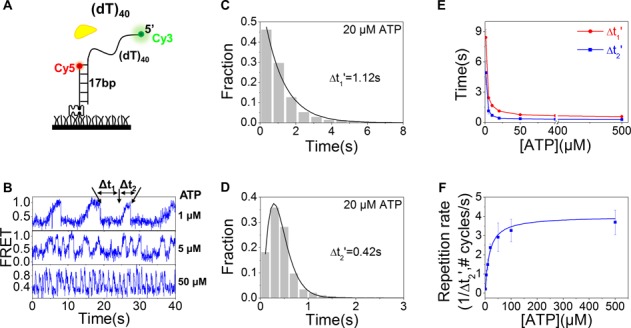
Properties of BLM-mediated ssDNA looping. (A,B) FRET time traces of 40-nt partial duplex DNA were recorded with 10 nM BLM and different concentrations of ATP. The waiting time Δt1 and translocation time Δt2 are used to characterize the two phases. (C,D) At 20 μM ATP, the histogram of Δt1 follows an exponential decay with a time constant of 1.12 s, while that of Δt2 can be well fitted by a γ-distribution with a time constant of 0.42 s. (E) With increasing ATP concentration, both Δt1′ and Δt2′ decrease significantly. (F) Michaelis–Menten fit of 1/Δt2′ as a function of ATP concentration. Error bars denote s.d.
Figure 7.
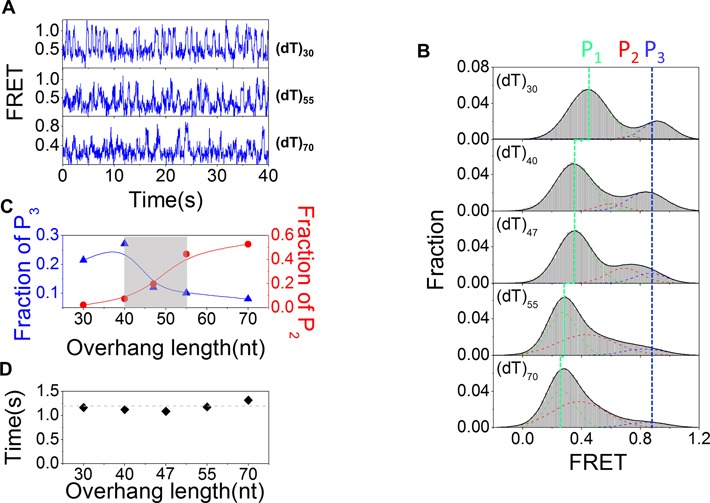
BLM displays a low translocation processivity. (A) FRET time traces showing repetitive looping of ssDNA of different lengths in the presence of 10 nM BLM and 20 μM ATP. (B) FRET histograms for different lengths of ssDNA undergoing periodical looping. Approximately 100 traces were used in each case. Each histogram can be fitted by a 3-peak Gaussian distribution. The low-FRET peak (P1) corresponds to free ssDNA without looping. The high-FRET peak (P3) corresponds to that when the 5′ end of ssDNA was close to the ss/dsDNA junction. The middle peak (P2) should correspond to the position where the transported ssDNA was released due to the limited processivity of BLM. (C) The relative populations of P2 and P3 as a function of the ssDNA length. (D) The average waiting time Δt1′ as a function of ssDNA length.
Revisiting the previously reported BLM-mediated strand-switching
From the above studies with G4sd substrates, we found that BLM is anchored at the ss/dsDNA junction and reels in ssDNA repetitively. In the previous study of repetitive duplex unwinding phenomena of BLM, it was suggested that BLM switches strand and translocates on the opposite strand after unwinding a certain duplex length (34). In that study, Cy3 was labeled at the ss/dsDNA junction and Cy5 was labeled at the opposite ssDNA (5′ tail), 7 nt away from Cy3 (34). In light of our present study, it is possible that BLM actually remains anchored at ss/dsDNA junction rather than making strand switching for the observed repetitive phenomenon. To verify this proposal, we designed a DNA substrate which is basically the same as that used by Yodh et al. (34), except that the two fluorophores were separated by 30-nt (Figure 8A) rather than 7-nt ssDNA. With this substrate (30 nt), the initial FRET value (∼0.38) is not as high as that reported previously (∼0.78). After unwinding initiation and the unwinding of certain base pairs, there should be two possible different scenarios according to the different mechanisms. (i) BLM switches strand and translocates on the opposite strand. In this case, the FRET signal would never be higher than its initial value (∼0.38). (ii) BLM remains anchored at ss/dsDNA junction, then reels in the opposite 5′ ssDNA and brings the two fluorophores closer. In this second case, the FRET signal would increase and become higher than the initial value. Our experimental results show that FRET signal oscillates between its initial value ∼0.38 and ∼0.87 (Figure 8B). This suggests strongly that our proposed mechanism is more relevant for our above observed repetitive unwinding phenomenon in which the protein remains anchored at ss/dsDNA junction, but not translocates and switches strands (Figure 8C).
Figure 8.
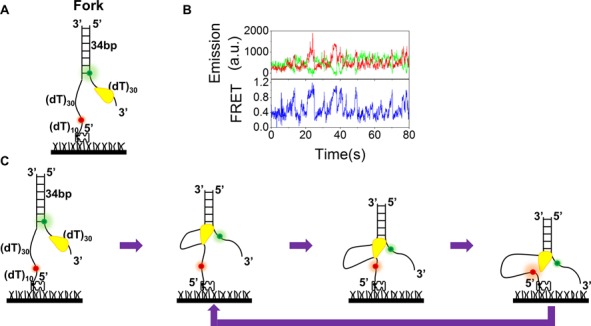
The observed BLM-catalyzed repetitive unwinding of a forked DNA may be interpreted by a novel model. (A) A forked DNA contains 34 bp dsDNA with a 30-nt 3′ ssDNA tail labeled with Cy3 at the ss/ds junction. The opposite ssDNA was labeled with Cy5 at a position 30 nt away from the ss/dsDNA junction. (B) Representative single-molecule time traces of Cy3 (green) and Cy5 (red) emissions (upper panel) and the corresponding FRET time trace (lower panel) in the presence of 10 nM BLM and 5 μM ATP. (C) Proposed ssDNA looping model for repetitive FRET oscillation; see the text for more details.
DISCUSSION
In this study, we used the single-molecule FRET method to characterize BLM-catalyzed G4 DNA unfolding with the different G4 substrates that BLM may encounter in the biological context. Our aim was to identify G4 unfolding intermediates associated with the distinctly structured DNA, then revealing and comparing the molecular mechanisms that control these processes.
BLM-mediated G4 unfolding may be ATP dependent both in vivo and in vitro
Although the isolated G4 has been recognized and studied in vitro by different biochemical and biophysical methods for more than three decades, the convincing evidences regarding G4 formation and regulation in cell by proteins have been recently confirmed by molecular probes and molecular genetic manipulations (18,19). The existence of G4 structures in living cells was recently observed using an antibody that can recognize G4 structure with high affinity and specificity (44). More importantly, many evidences show that G4 structure in cell was regulated by specialized helicases through their ATP-dependent helicase activity. The roles of Pif1 helicase in maintenance of genome stability were revealed by characterizing S. cerevisiae Pif1 derivative in which a conserved lysine residue (K264) implicated in ATP hydrolysis was mutated (18), indicating that ATPase/helicase activity of Pif1 is required to resolve G4 structures. Similarly, a lysine-to-arginine mutation in the Walker A box ATPase active site of transcriptional helicase XPB abolishes its G4 binding (20). Furthermore, characterizations of disease-causing missense mutations in BS protein revealed that more than 90% missense-mutant are defective in ATP hydrolysis activity (28,45). Altogether, these studies have shown that G4 unfolding is driven by ATP hydrolysis in cells. Consistent with the above observations, we found that BLM-catalyzed-G4 unfolding can be only observed in the presence of ATP. In the absence of ATP or in the presence of non-hydrolysable ATP analogs or with a BLM deficient in ATPase activity, G4 unfolding cannot be detected by FRET. Taken together, these experiments show that, different from human Replication Protein A (RPA)-mediated G4 unfolding (46), BLM-catalyzed G4 unwinding is absolutely ATP dependent.
However, previous elegant works have shown that BLM-mediated G4 unfolding may be ATP independent (23). The observed differences on BLM-mediated G4 unfolding may result from the different experimental conditions used. We noted that while we used 10 nM BLM for real-time observation, Budhathoki et al. performed their experiments under conditions in which G4 DNA was incubated for a long time (15 min) with high-concentration BLM (100–2000 nM) before recording FRET signals (23). It is possible that G4 may spontaneously undergoes unfolding–refolding conformational changes in this period due to the thermodynamic fluctuations and then BLM traps the unfolded G4 due to its higher binding affinity for ssDNA than G4 (Supplementary Figure S3D and F). Furthermore, a previous study has suggested that G4 unfolding is mediated by the cooperative binding of RQC and HRDC domains, where the interaction of RQC with G4 is stabilized by HRDC binding to the ssDNA segment (24). Although the authors suggest the translocase or helicase activity may not be required for G4 unfolding in specific DNA substrates that are different from that in our study, they also found that in the absence of ATP, G4 cannot be unfolded when an external ssDNA is at the 3′ end of a G4 structure proximal to duplex without separation (24). These results are consistent with the requirement of ATP in dG4s unfolding in our study (Figure 1B). In addition, we reported that with G4sd, BLM anchors at the ss/dsDNA junction, reels in the ssDNA and unfolds G4 by translocation in an ATP-dependent manner.
BLM unfolds G4s in different structural environments through different mechanisms
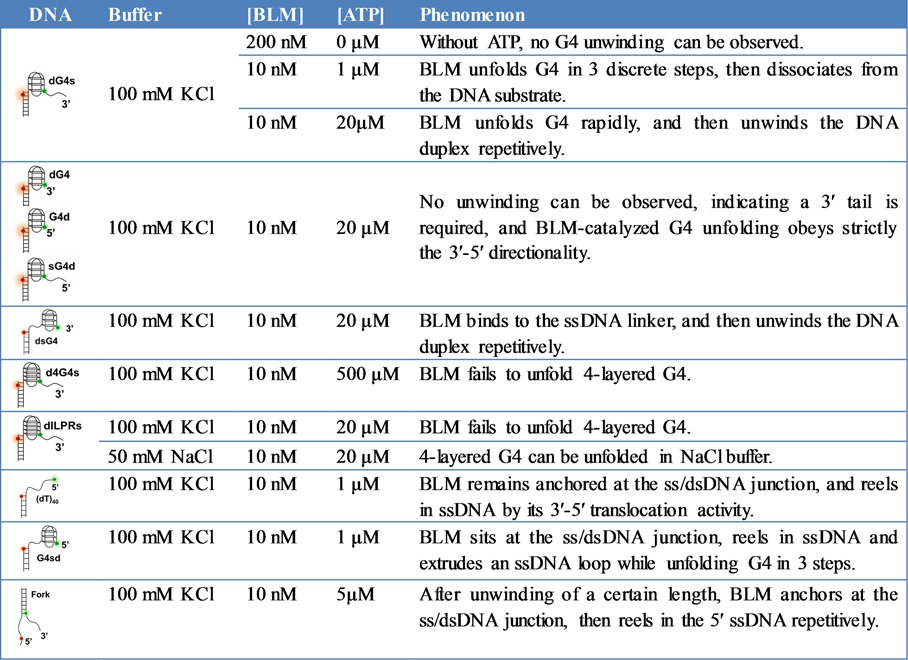
More interestingly, BLM unfolds distinct G4s in different spatial environments though different mechanisms. The main features of these properties are summarized in Table 1. The dG4s substrate may represent a DNA structure formed from a double-strand DNA break or telomere in which an ssDNA is available for BLM loading to its 3′ end. Recently, Zimmerman et al. reported that the shelterin component TRF1 recruits BLM to load onto lagging strand template. BLM was proposed to facilitate lagging-strand telomeric DNA synthesis by unwinding G4 or other secondary G-G base-paired structures formed in the TTAGGG repeat templates (47). We show that BLM unfolds such a G4 in three discrete steps with low processivity or/and low activity since it cannot unfold 4-layered G4. For G4sd substrate that resembles an R-loop in rich G-cluster (cotranscriptional RNA–DNA hybrid), G4 DNA was unfolded by a complete different mechanism. While dG4s DNA was unfolded through a mechanism in which BLM translocates ‘actively’ along ssDNA, G4sd was unfolded by BLM through a mechanism in which BLM does not move toward the 5′ end according to its 3′-5′ polarity during G4 unfolding, but remains anchored at the ss/dsDNA junction and reels in the 3′ overhang, extruding an ssDNA loop, then followed by the release of the unwound ssDNA and its immediate refolding into G4. The above processes continue repetitively and depend on both ATPase and translocase activities of BLM. Thus the interaction between BLM and G4 is highly selective by the DNA substrate conformations, i.e. the specific DNA environment plays an important role in the modulation of BLM behavior. In consequence, the proximal DNA sequences may provide an additional level of regulation in G4 unfolding and further influence the relevant biological processes such as DNA transcription and replication.
Table 1. The G4 unfolding and/or duplex unwinding behaviors of BLM with different DNA substrates.
Differences in properties and mechanisms of BLM and Pif1 helicases-mediated G4 unfolding
Recently, we reported the characterizations of a 5′-3′ helicase, Pif1-catalyzed unfolding of G4 by using comparable G4-containing DNA structures as used in this study (32). With a DNA substrate the same as dG4s but with a 5′ tail, Pif1 unfolds G4 in two large steps and then halts at the ss/dsDNA junction, followed by rapid refolding of G4 and re-initiation of repetitive unfolding by the same monomer (32). This repetitive unfolding is mediated by G-triplex, which is a unique property of Pif1, but not observed for BLM-catalyzed G4 unfolding. However, BLM unfolds G4 in three discrete steps, with both G-triplex and G-hairpin as intermediates, but without repetitive unfolding phenomenon. The difference might reflect the intrinsic enzymatic properties or/and may be due to the different experimental conditions. In the Pif1 study, 50 mM NaCl was used as the unfolding buffer, whereas 100 mM KCl was used in the BLM study. In the latter case, G-hairpin may be more stable and thus was detected as an intermediate. With G4sd-type substrates (i.e. G4 is connected to a DNA duplex via an ssDNA linker), both BLM- and Pif1-catalyzed unfoldings of G4 display a common character: the helicase anchors at the ss/dsDNA junction, reels in the 5′ (in the case of BLM) or 3′ (in the case of Pif1) overhang and unwinds the G4 structure repetitively by periodic patrolling (33). Studies of helicase-mediated G4 unfolding are just at the beginning. Whether the observed BLM- or Pif1-mediated G4-unfolding properties are common characters of 3′-5′ or 5′-3′ G4-unfolding helicases remains to be determined through studying more helicases.
The G-clusters in genome are very abundant and can adopt diverse conformations with subtle differences in parallel or anti-parallel orientations of the strands, the length of G runs and the loops of non-Gs between G runs (48). Recent advances in characterization of several G4 helicases lead to the view that distinct G4 structures in cell can be recognized and unfolded by different G4 helicases to regulate gene functions (14,20). In this study, we provide novel evidence that even for the same G4 structure, which is in different structural and spatial environments, it can be unfolded by BLM through different modes or different mechanisms. It remains to clarify whether other RecQ family helicases or other G4-unfolding helicases similarly have such a character in unfolding G4. Finally, it is noteworthy that the results obtained in this and previous works come from the studies of the truncated BLM helicase core, instead of a full-length BLM (23,24,34,36). Although we and others have found that both the truncated and full-length BLM display similar enzymatic activities, additional studies of G4 unfolding by the full-length BLM in the future may be necessary to determine whether the regions outside of the helicase core domain influence the G4-unfolding properties.
SUPPLEMENTARY DATA
Supplementary Data are available at NAR Online.
Acknowledgments
We thank Xi's laboratory members for insightful discussions.
Disclaimer: The Research was conducted within the context of the International Associated Laboratory ‘Helicase-mediated G-quadruplex DNA unwinding and Genome Stability’.
FUNDING
The National Natural Science Foundation of China [31370798, 11304252 and 31301632]; Northwest A&F University Startup Funding [Z101021102 to X.-G.X.; Z111021205 to X.-M.H.]. Funding for open access charge: National Natural Science Foundation of China [31370798].
Conflict of interest statement. None declared.
REFERENCES
- 1.Lohman T.M., Bjornson K.P. Mechanisms of helicase-catalyzed DNA unwinding. Annu. Rev. Biochem. 1996;65:169–214. doi: 10.1146/annurev.bi.65.070196.001125. [DOI] [PubMed] [Google Scholar]
- 2.Croteau D.L., Popuri V., Opresko P.L., Bohr V.A. Human RecQ helicases in DNA repair, recombination, and replication. Annu. Rev. Biochem. 2014;83:519–552. doi: 10.1146/annurev-biochem-060713-035428. [DOI] [PMC free article] [PubMed] [Google Scholar]
- 3.Cheok C., Bachrati C., Chan K., Ralf C., Wu L., Hickson I. Roles of the Bloom's syndrome helicase in the maintenance of genome stability. Biochem. Soc. Trans. 2005;33:1456–1459. doi: 10.1042/BST0331456. [DOI] [PubMed] [Google Scholar]
- 4.Goto M. Werner's syndrome: from clinics to genetics. Clin. Exp. Rheumatol. 2000;18:760–766. [PubMed] [Google Scholar]
- 5.Lindor N.M., Furuichi Y., Kitao S., Shimamoto A., Arndt C., Jalal S. Rothmund-Thomson syndrome due to RECQ4 helicase mutations: report and clinical and molecular comparisons with Bloom syndrome and Werner syndrome. Am. J. Med. Genet. 2000;90:223–228. doi: 10.1002/(sici)1096-8628(20000131)90:3<223::aid-ajmg7>3.0.co;2-z. [DOI] [PubMed] [Google Scholar]
- 6.Bachrati C.Z., Hickson I.D. RecQ helicases: suppressors of tumorigenesis and premature aging. Biochem. J. 2003;374:577–606. doi: 10.1042/BJ20030491. [DOI] [PMC free article] [PubMed] [Google Scholar]
- 7.Chu W.K., Hickson I.D. RecQ helicases: multifunctional genome caretakers. Nat. Rev. Cancer. 2009;9:644–654. doi: 10.1038/nrc2682. [DOI] [PubMed] [Google Scholar]
- 8.Karow J.K., Wu L., Hickson I.D. RecQ family helicases: roles in cancer and aging. Curr. Opin. Genet. Dev. 2000;10:32–38. doi: 10.1016/s0959-437x(99)00039-8. [DOI] [PubMed] [Google Scholar]
- 9.Xi X.G. Mutational analysis of Bloom helicase. In: Abdelhaleem MM, editor. Helicases: Methods and Protocols. Vol. 587. NY: Humana Press; 2010. pp. 173–184. [DOI] [PubMed] [Google Scholar]
- 10.German J., Sanz M.M., Ciocci S., Ye T.Z., Ellis N.A. Syndrome-causing mutations of the BLM gene in persons in the Bloom's Syndrome Registry. Hum. Mutat. 2007;28:743–753. doi: 10.1002/humu.20501. [DOI] [PubMed] [Google Scholar]
- 11.Ellis N.A., Groden J., Ye T.-Z., Straughen J., Lennon D.J., Ciocci S., Proytcheva M., German J. The Bloom's syndrome gene product is homologous to RecQ helicases. Cell. 1995;83:655–666. doi: 10.1016/0092-8674(95)90105-1. [DOI] [PubMed] [Google Scholar]
- 12.Wu L., Hickson I.D. The Bloom's syndrome helicase suppresses crossing over during homologous recombination. Nature. 2003;426:870–874. doi: 10.1038/nature02253. [DOI] [PubMed] [Google Scholar]
- 13.Sun H., Karow J.K., Hickson I.D., Maizels N. The Bloom's syndrome helicase unwinds G4 DNA. J. Biol. Chem. 1998;273:27587–27592. doi: 10.1074/jbc.273.42.27587. [DOI] [PubMed] [Google Scholar]
- 14.Bochman M.L., Paeschke K., Zakian V.A. DNA secondary structures: stability and function of G-quadruplex structures. Nat. Rev. Genet. 2012;13:770–780. doi: 10.1038/nrg3296. [DOI] [PMC free article] [PubMed] [Google Scholar]
- 15.Balasubramanian S., Neidle S. G-quadruplex nucleic acids as therapeutic targets. Curr. Opin. Chem. Biol. 2009;13:345–353. doi: 10.1016/j.cbpa.2009.04.637. [DOI] [PMC free article] [PubMed] [Google Scholar]
- 16.Huppert J.L., Balasubramanian S. Prevalence of quadruplexes in the human genome. Nucleic Acids Res. 2005;33:2908–2916. doi: 10.1093/nar/gki609. [DOI] [PMC free article] [PubMed] [Google Scholar]
- 17.Todd A.K., Johnston M., Neidle S. Highly prevalent putative quadruplex sequence motifs in human DNA. Nucleic Acids Res. 2005;33:2901–2907. doi: 10.1093/nar/gki553. [DOI] [PMC free article] [PubMed] [Google Scholar]
- 18.Paeschke K., Capra J.A., Zakian V.A. DNA replication through G-quadruplex motifs is promoted by the Saccharomyces cerevisiae Pif1 DNA helicase. Cell. 2011;145:678–691. doi: 10.1016/j.cell.2011.04.015. [DOI] [PMC free article] [PubMed] [Google Scholar]
- 19.Paeschke K., Bochman M.L., Garcia P.D., Cejka P., Friedman K.L., Kowalczykowski S.C., Zakian V.A. Pif1 family helicases suppress genome instability at G-quadruplex motifs. Nature. 2013;497:458–462. doi: 10.1038/nature12149. [DOI] [PMC free article] [PubMed] [Google Scholar]
- 20.Gray L.T., Vallur A.C., Eddy J., Maizels N. G quadruplexes are genomewide targets of transcriptional helicases XPB and XPD. Nat. Chem. Biol. 2014;10:313–318. doi: 10.1038/nchembio.1475. [DOI] [PMC free article] [PubMed] [Google Scholar]
- 21.Giang Huong N., Tang W., Robles A.I., Beyer R.P., Gray L.T., Welsh J.A., Schetter A.J., Kumamoto K., Wang X.W., Hickson I.D., et al. Regulation of gene expression by the BLM helicase correlates with the presence of G-quadruplex DNA motifs. Proc. Natl. Acad. Sci. U.S.A. 2014;111:9905–9910. doi: 10.1073/pnas.1404807111. [DOI] [PMC free article] [PubMed] [Google Scholar]
- 22.Johnson J.E., Cao K., Ryvkin P., Wang L.-S., Johnson F.B. Altered gene expression in the Werner and Bloom syndromes is associated with sequences having G-quadruplex forming potential. Nucleic Acids Res. 2010;38:1114–1122. doi: 10.1093/nar/gkp1103. [DOI] [PMC free article] [PubMed] [Google Scholar]
- 23.Budhathoki J.B., Ray S., Urban V., Janscak P., Yodh J.G., Balci H. RecQ-core of BLM unfolds telomeric G-quadruplex in the absence of ATP. Nucleic Acids Res. 2014;42:11528–11545. doi: 10.1093/nar/gku856. [DOI] [PMC free article] [PubMed] [Google Scholar]
- 24.Chatterjee S., Zagelbaum J., Savitsky P., Sturzenegger A., Huttner D., Janscak P., Hickson I.D., Gileadi O., Rothenberg E. Mechanistic insight into the interaction of BLM helicase with intra-strand G-quadruplex structures. Nat. Commun. 2014;5 doi: 10.1038/ncomms6556. doi:10.1038/ncomms6556. [DOI] [PMC free article] [PubMed] [Google Scholar]
- 25.Roy R., Hohng S., Ha T. A practical guide to single-molecule FRET. Nat. Methods. 2008;5:507–516. doi: 10.1038/nmeth.1208. [DOI] [PMC free article] [PubMed] [Google Scholar]
- 26.Karow J.K., Newman R.H., Freemont P.S., Hickson I.D. Oligomeric ring structure of the Bloom's syndrome helicase. Curr. Biol. 1999;9:597–600. doi: 10.1016/s0960-9822(99)80264-4. [DOI] [PubMed] [Google Scholar]
- 27.Beresten S.F., Stan R., van Brabant A.J., Ye T., Naureckiene S., Ellis N.A. Purification of overexpressed hexahistidine-tagged BLM N431 as oligomeric complexes. Protein Expr. Purif. 1999;17:239–248. doi: 10.1006/prep.1999.1135. [DOI] [PubMed] [Google Scholar]
- 28.Guo R.-B., Rigolet P., Ren H., Zhang B., Zhang X.-D., Dou S.-X., Wang P.-Y., Amor-Gueret M., Xi X.G. Structural and functional analyses of disease-causing missense mutations in Bloom syndrome protein. Nucleic Acids Res. 2007;35:6297–6310. doi: 10.1093/nar/gkm536. [DOI] [PMC free article] [PubMed] [Google Scholar]
- 29.Lee J., Okumus B., Kim D., Ha T. Extreme conformational diversity in human telomeric DNA. Proc. Natl. Acad. Sci. U.S.A. 2005;102:18938–18943. doi: 10.1073/pnas.0506144102. [DOI] [PMC free article] [PubMed] [Google Scholar]
- 30.Ying L., Green J.J., Li H., Klenerman D., Balasubramanian S. Studies on the structure and dynamics of the human telomeric G quadruplex by single-molecule fluorescence resonance energy transfer. Proc. Natl. Acad. Sci. U.S.A. 2003;100:14629–14634. doi: 10.1073/pnas.2433350100. [DOI] [PMC free article] [PubMed] [Google Scholar]
- 31.Tippana R., Xiao W., Myong S. G-quadruplex conformation and dynamics are determined by loop length and sequence. Nucleic Acids Res. 2014;42:8106–8114. doi: 10.1093/nar/gku464. [DOI] [PMC free article] [PubMed] [Google Scholar]
- 32.Hou X.-M., Wu W.-Q., Duan X.-L., Liu N.-N., Li H.-H., Fu J., Dou S.-X., Li M., Xi X.-G. Molecular mechanism of G-quadruplex unwinding helicase: sequential and repetitive unfolding of G-quadruplex by Pif1 helicase. Biochem. J. 2015;466:189–199. doi: 10.1042/BJ20140997. [DOI] [PubMed] [Google Scholar]
- 33.Zhou R., Zhang J., Bochman M.L., Zakian V.A., Ha T. Periodic DNA patrolling underlies diverse functions of Pif1 on R-loops and G-rich DNA. eLife. 2014;3:e02190. doi: 10.7554/eLife.02190. [DOI] [PMC free article] [PubMed] [Google Scholar]
- 34.Yodh J.G., Stevens B.C., Kanagaraj R., Janscak P., Ha T. BLM helicase measures DNA unwound before switching strands and hRPA promotes unwinding reinitiation. EMBO J. 2009;28:405–416. doi: 10.1038/emboj.2008.298. [DOI] [PMC free article] [PubMed] [Google Scholar]
- 35.Guédin A., Gros J., Alberti P., Mergny J.-L. How long is too long? Effects of loop size on G-quadruplex stability. Nucleic Acids Res. 2010;38:7858–7868. doi: 10.1093/nar/gkq639. [DOI] [PMC free article] [PubMed] [Google Scholar]
- 36.Liu J.-q., Chen C.-y., Xue Y., Hao Y.-h., Tan Z. G-quadruplex hinders translocation of BLM helicase on DNA: a real-time fluorescence spectroscopic unwinding study and comparison with duplex substrates. J. Am. Chem. Soc. 2010;132:10521–10527. doi: 10.1021/ja1038165. [DOI] [PubMed] [Google Scholar]
- 37.Maizels N. Dynamic roles for G4 DNA in the biology of eukaryotic cells. Nat. Struct. Mol. Biol. 2006;13:1055–1059. doi: 10.1038/nsmb1171. [DOI] [PubMed] [Google Scholar]
- 38.Park J., Myong S., Niedziela-Majka A., Lee K.S., Yu J., Lohman T.M., Ha T. PcrA helicase dismantles RecA filaments by reeling in DNA in uniform steps. Cell. 2010;142:544–555. doi: 10.1016/j.cell.2010.07.016. [DOI] [PMC free article] [PubMed] [Google Scholar]
- 39.Qiu Y., Antony E., Doganay S., Koh H.R., Lohman T.M., Myong S. Srs2 prevents Rad51 filament formation by repetitive motion on DNA. Nat. Commun. 2013;4 doi: 10.1038/ncomms3281. doi:10.1038/ncomms3281. [DOI] [PMC free article] [PubMed] [Google Scholar]
- 40.Hwang H., Kim H., Myong S. Protein induced fluorescence enhancement as a single molecule assay with short distance sensitivity. Proc. Natl. Acad. Sci. U.S.A. 2011;108:7414–7418. doi: 10.1073/pnas.1017672108. [DOI] [PMC free article] [PubMed] [Google Scholar]
- 41.Swan M.K., Legris V., Tanner A., Reaper P.M., Vial S., Bordas R., Pollard J.R., Charlton P.A., Golec J.M.C., Bertrand J.A. Structure of human Bloom's syndrome helicase in complex with ADP and duplex DNA. Acta Crystallogr. D Biol. Crystallogr. 2014;70:1465–1475. doi: 10.1107/S139900471400501X. [DOI] [PubMed] [Google Scholar]
- 42.Yang Y., Dou S.-X., Xu Y.-N., Bazeille N., Wang P.-Y., Rigolet P., Xu H.-Q., Xi X.G. Kinetic mechanism of DNA unwinding by the BLM helicase core and molecular basis for its low processivity. Biochemistry. 2009;49:656–668. doi: 10.1021/bi901459c. [DOI] [PubMed] [Google Scholar]
- 43.Gyimesi M., Sarlós K., Kovács M. Processive translocation mechanism of the human Bloom's syndrome helicase along single-stranded DNA. Nucleic Acids Res. 2010;38:4404–4414. doi: 10.1093/nar/gkq145. [DOI] [PMC free article] [PubMed] [Google Scholar]
- 44.Biffi G., Tannahill D., McCafferty J., Balasubramanian S. Quantitative visualization of DNA G-quadruplex structures in human cells. Nat. Chem. 2013;5:182–186. doi: 10.1038/nchem.1548. [DOI] [PMC free article] [PubMed] [Google Scholar]
- 45.Bernstein D.A., Zittel M.C., Keck J.L. High-resolution structure of the E.coli RecQ helicase catalytic core. EMBO J. 2003;22:4910–4921. doi: 10.1093/emboj/cdg500. [DOI] [PMC free article] [PubMed] [Google Scholar]
- 46.Qureshi M.H., Ray S., Sewell A.L., Basu S., Balci H. Replication protein A unfolds G-quadruplex structures with varying degrees of efficiency. J. Phys. Chem. B. 2012;116:5588–5594. doi: 10.1021/jp300546u. [DOI] [PMC free article] [PubMed] [Google Scholar]
- 47.Zimmermann M., Kibe T., Kabir S., de lange T. TRF1 negotiates TTAGGG repeat-associated replication problems by recruiting the BLM helicase and the TPP1/POT1 repressor of ATR signaling. Genes Dev. 2014;28:2477–2491. doi: 10.1101/gad.251611.114. [DOI] [PMC free article] [PubMed] [Google Scholar]
- 48.Phan A.T., Kuryavyi V., Patel D.J. DNA architecture: from G to Z. Curr. Opin. Struct. Biol. 2006;16:288–298. doi: 10.1016/j.sbi.2006.05.011. [DOI] [PMC free article] [PubMed] [Google Scholar]
Associated Data
This section collects any data citations, data availability statements, or supplementary materials included in this article.