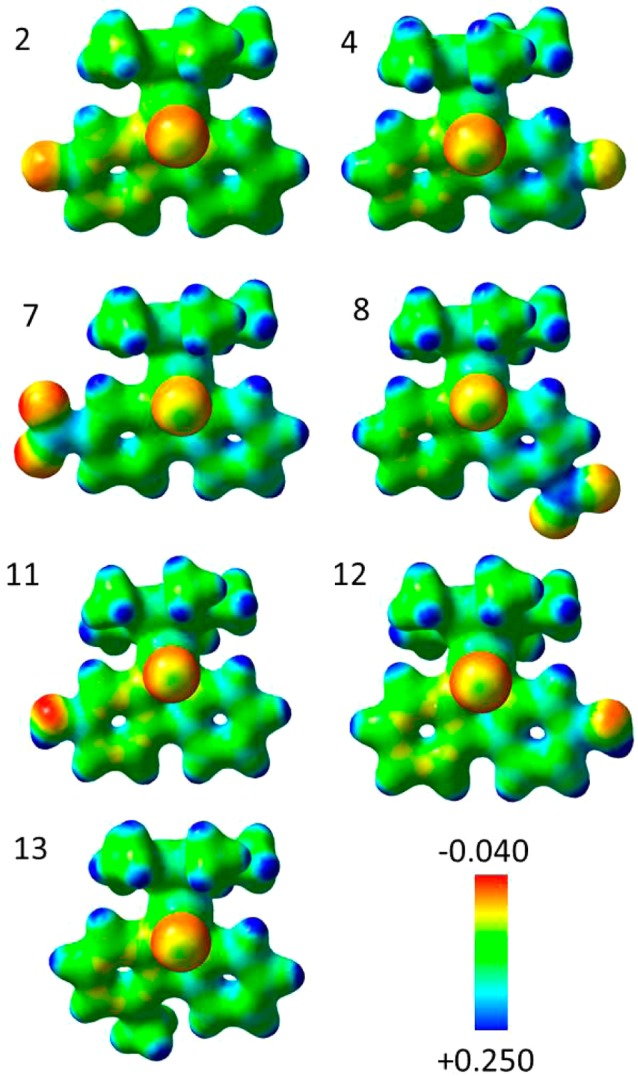
Figure 2.

Electrostatic potential surfaces for complexes 2, 4, 7, 8, and 11–13 (calculated at the PBE0/Lanl2DZ/6-31+G** level), where the EPSs are shown both in space (with positive and negative regions in blue and red, respectively) and mapped on electron density (isovalue 0.04) of the molecules. The electrostatic potential is represented with a color scale ranging from red (−0.040 au) to blue (+0.250 au). Note the more negative charge distribution on the phenyl ring of the 2-PhPy chelating ligand compared with the pyridyl ring. The substituents affect markedly only the electronic charge density on the chelating ligand, leaving the iridium center, Cp*, and chlorido ligands relatively unaffected.
