Abstract
Adult stem cells (SCs) reside in niches which balance self-renewal with lineage selection and progression during tissue homeostasis. Following injury, culture or transplantation, SCs outside their niche often display fate flexibility1-4. Here we show that super-enhancers5 underlie the identity, lineage commitment and plasticity of adult SCs in vivo. Using hair follicle (HF) as model, we map the global chromatin domains of HFSCs and their committed progenitors in their native microenvironments. We show that super-enhancers and their dense clusters (‘epicenters’) of transcription factor (TF) binding sites change upon lineage progression. New fate is acquired by decommissioning old and establishing new super-enhancers and/or epicenters, an auto-regulatory process that abates one master regulator subset while enhancing another. We further show that when outside their niche, either in vitro or in wound-repair, HFSCs dynamically remodel super-enhancers in response to changes in their microenvironment. Intriguingly, some key super-enhancers shift epicenters, enabling them to remain active and maintain a transitional state in an ever-changing transcriptional landscape. Finally, we identify SOX9 as a crucial chromatin rheostat of HFSC super-enhancers, and provide functional evidence that super-enhancers are dynamic, dense TF-binding platforms which are acutely sensitive to pioneer master regulators whose levels define not only spatial and temporal features of lineage-status, but also stemness, plasticity in transitional states and differentiation.
HFSCs fuel cyclical bouts of HF regeneration and hair growth and also repair damaged epidermis6. HF lineage progression is governed in part by dynamic regulation of Polycomb (PcG)-mediated repression/de-repression typified by a trimethylation mark on lysine 27 of histone H3 (H3K27me3)7-8. However, HFSC identity and function are mainly independent of PcG-regulated genes, indicating that additional epigenetic mechanisms underlie the governance of critical cell identity genes.
Recent in vitro studies suggest that genes controlling unique cellular identities are driven by so-called ‘super-enhancers’5,9,10. Representing a small fraction of total enhancers, super-enhancers encompass large chromatin domains bountiful in cell-type specific TF binding motifs that enable TFs to bind cooperatively. Their richness in H3K27 acetylation renders super-enhancers mutually exclusive for H3K27me3 repression5,11-13, while their H3K4me1 and Mediator complex alliances facilitate interactions with promoters to initiate transcription14.
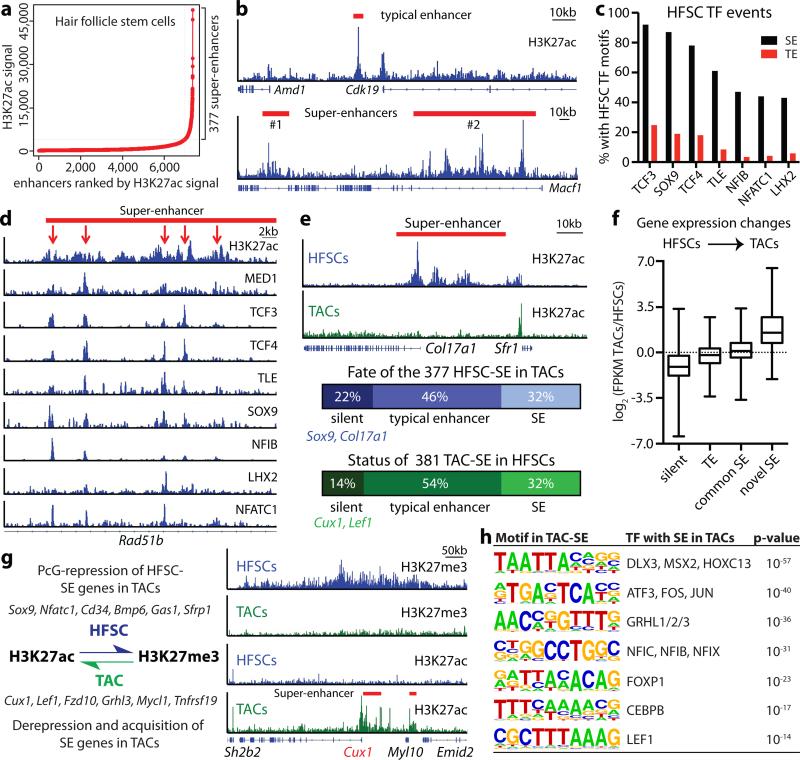
To explore the in vivo importance of super-enhancers in SCs, we first conducted chromatin immunoprecipitation followed by next-generation sequencing (ChIP-seq) on HFSCs purified directly from skin (Extended Data Fig. 1). H3K27ac, Mediator subunit MED1 and H3K4me1 peaks resided within promoters (±2 kb of annotated genes) (40%) and distal elements, considered enhancers (60%) of HFSC chromatin. 377 super-enhancers were identified by size (>28kb) and elevated H3K27ac occupancy5 with ≥5 H3K27ac-enriched clusters (Fig. 1a,b; Extended Data Fig. 2a-f).
Figure 1. Dynamic super-enhancer remodeling facilitates lineage progression.
a, Identification of H3K27ac super-enhancers in HFSCs. b, H3K27ac-marked enhancers at Cdk19 and Macf1 loci in HFSCs. c, Occupancy of HFSC-TFs within enhancers. d, Clustering of HFSC-TFs occurs in epicenters (red arrows) within super-enhancers. e, Dynamic remodeling of super-enhancers during lineage progression. f, Enhancer remodeling correlates with gene expression changes. g, Cell fate determinants switch between SE-activation and PcG-repression, typified by a swap in H3K27 modifications. Representative example (Cux1) shows this switch upon HFSC→TAC fate commitment. h, Motif analysis of TAC super-enhancers for putative TF binding sites. SE, super-enhancer; TE, typical enhancer.
>80% accuracy in super-enhancer gene assignments can be achieved by applying optimized RNA-seq and proximity algorithms14. Most remaining ambiguities arise from multiple expressed genes in close proximity of a super-enhancer.14 We resolved these by requiring that HFSC super-enhancer genes must a) exhibit H3K4me3/H3K79me2-activating and lack H3K27me3-repressive modifications8; and b) maintain strict correlation between super-enhancer and candidate expression in three different states: HFSCs, their committed progenitors in vivo, and HFSCs in vitro (Supplementary Table 1; see below).
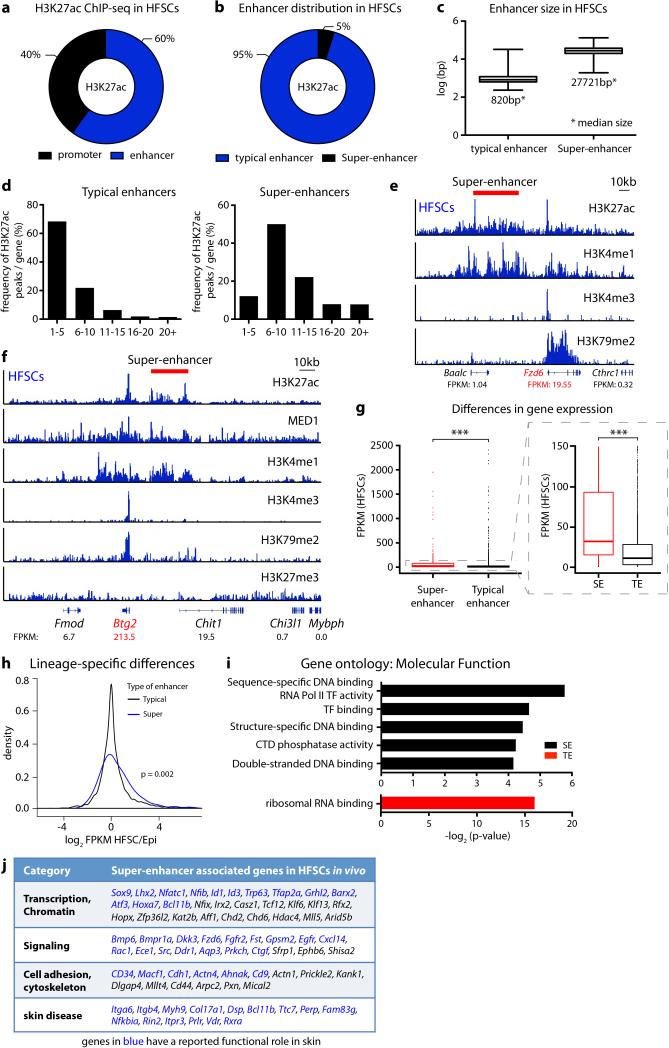
Whereas typical-enhancers (1-2kb) governed >90% of HFSC genes, super-enhancers marked genes transcribed selectively in HFSCs (Extended Data Fig. 2g,h). Unbiased gene ontology (GO) analysis further distinguished super-enhancer regulated genes by a preponderance of transcriptional regulators, including Sox9, Lhx2, Nfatc1 and Nfib, important for stemness, quiescence and/or crosstalk within the HFSC niche15-18 (Extended Data Fig. 2i,j). Their encoded TFs, in particular SOX9, bound at high frequency (87%) to super-enhancers, including their own, indicative of auto-regulation (Fig. 1c). Essential HFSC WNT-effector TCF319 also bound within these super-enhancers, although the Tcf7l1 enhancer fell just below our assignment cut-off.
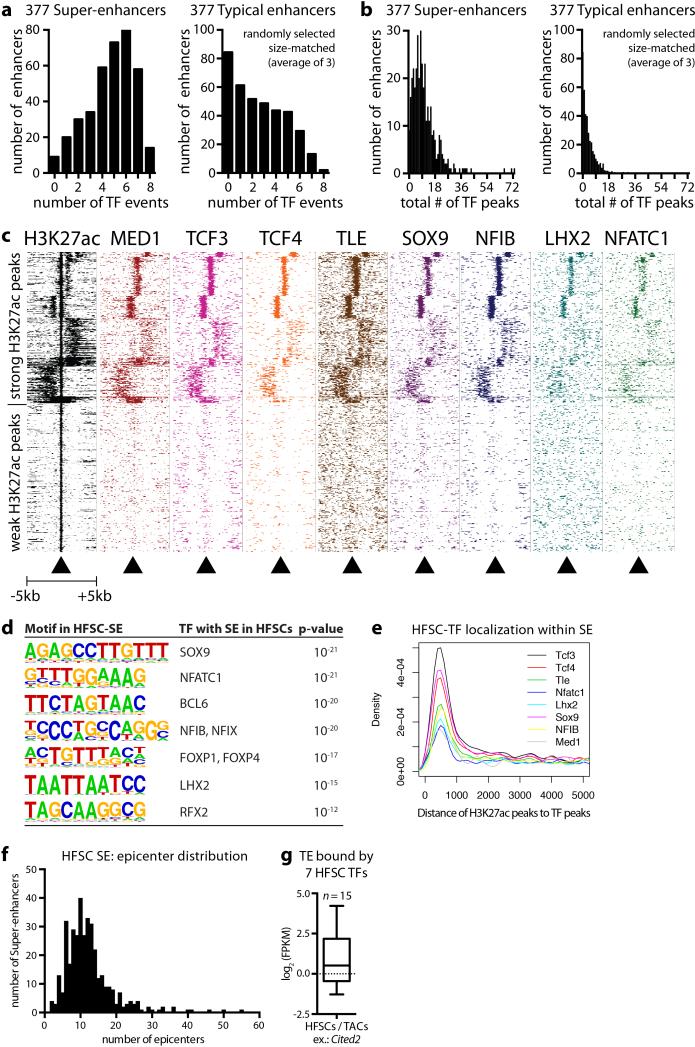
Notably, >60% of super-enhancers were occupied by ≥5 different HFSC-TFs. HFSC-TF binding was not similarly distributed within open chromatin of comparable cohorts of typical-enhancers, even when flanking sequences were included to normalize for their smaller size (Extended Data Fig. 3a,b). Thus, binding of HFSC-specific TFs was not dictated by open chromatin per se, but rather by super-enhancers, which controlled critical cell identity genes, including themselves, in this adult SC niche.
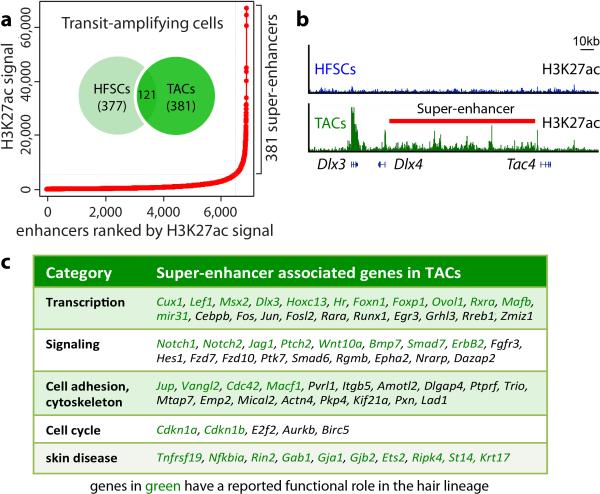
Scattered across each super-enhancer were smaller (1-2kb) regions densely packed with HFSC-TF consensus binding motifs and which bound the cohort of HFSC-TFs (Fig. 1d). These epicenters resembled recently described ‘hotspots’ within super-enhancers of cultured adipocytes20. Notably, <1% of typical-enhancers had even one such cluster of HFSC-TF motifs, where most HFSC super-enhancers had ten (Extended Data Fig. 3). An auto-regulatory and cooperative mechanism5 predicts that super-enhancer remodeling must occur to progress along a lineage typified by environmentally-induced changes in TF landscape. We tested this hypothesis by characterizing the super-enhancers of short-lived HFSC progeny (transit-amplifying cells, TACs) that progress to make hair (Extended Data Fig. 1). The 381 super-enhancer-marked TAC genes diverged considerably from those of HFSCs (Fig. 1e). Notably, HFSC-TF genes lost their super-enhancers in TACs, while TAC-TF genes gained super-enhancers. Thus, our findings broadened the concept of super-enhancer dynamics observed in macrophages isolated from different tissues11,12, and supported the notion that enhancers are activated or silenced in lineage-specific fashion8,21. However, they contrasted with prior in vivo studies suggesting that chromatin remains broadly permissive as intestinal SCs progress through a lineage22.
Like HFSCs, TAC super-enhancers controlled TF, BMP and WNT signaling genes, but the presence of cell-cycle related and NOTCH pathway super-enhancer-marked genes appeared unique to features of TACs (Extended Data Fig. 4). Interestingly, only 32% of HFSC super-enhancers persisted in TACs. Half were reduced to typical-enhancers, suggestive of more subordinate roles. Analogously, 54% of genes that gained a super-enhancer in TACs were driven by typical-enhancers in HFSCs (Fig. 1e). Typical-enhancer to super-enhancer shifts correlated with increased transcription and appeared to provide an epigenetic readout to gauge transcriptional levels during lineage progression (Fig. 1f).
Most super-enhancer genes involved in dictating HFSC fate were decommissioned in TACs. For this cohort, H3K27ac loss was accompanied by H3K27me3 gain8, suggestive of “super-silencing” (Fig. 1g). Conversely, specific TAC fate determinants became de-repressed by losing PcG-catalyzed H3K27me3 marks while simultaneously gaining H3K27ac to expose a new super-enhancer. An unbiased analysis revealed that TAC super-enhancers were enriched for the binding motifs of many TAC-TFs (Fig. 1h).
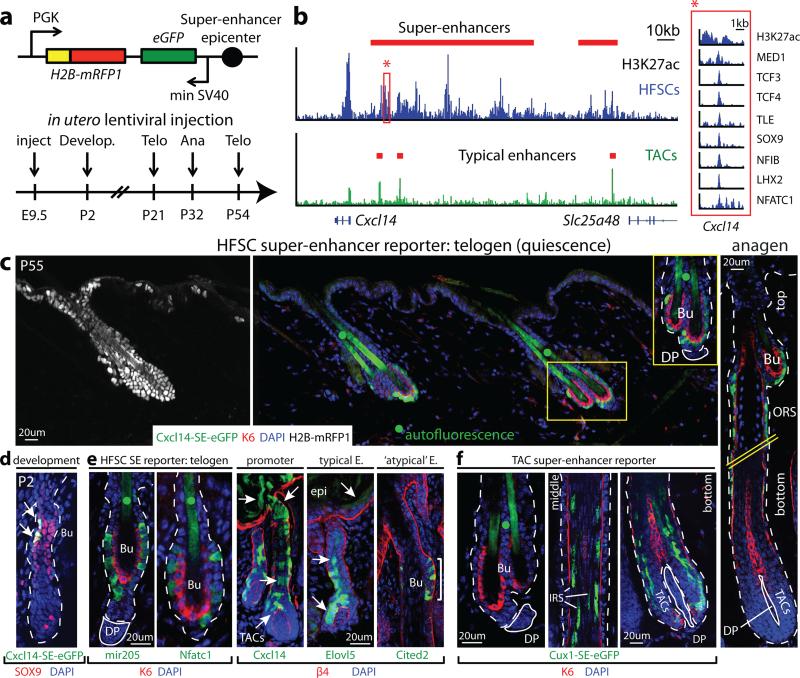
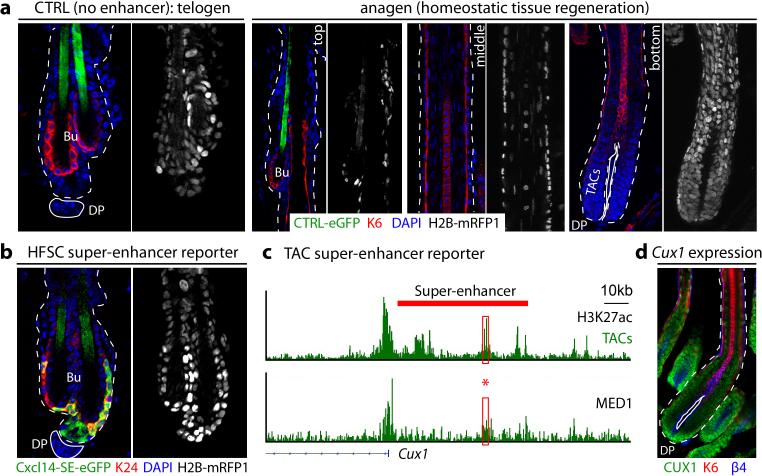
To address functionality, we tested the ability of super-enhancer epicenters to drive reporter gene expression in vivo. A 1.2kb epicenter within the Cxcl14 super-enhancer was used to generate high-titer lentivirus harboring Cxcl14-SE-eGFP and Pgk-H2B-mRFP1 and injected into the amniotic sacs of living E9.5 embryos (Fig. 2a,b). This results in random transgene integration into skin progenitor chromatin23.
Figure 2. Super-enhancer epicenters confer tissue, lineage and temporal specificity.
a, Lentiviral super-enhancer reporter and analysis scheme. Telo: Telogen (quiescent HFSCs; no TACs, no hair growth); Ana: anagen (active TACs, hair growth). b, H3K27ac occupancy at the Cxcl14 locus. Red box highlights the Cxcl14-SE epicenter (bound by MED1 and 7 HFSC-TFs; absent in TACs) cloned for reporter assays. c, Cxcl14-SE-eGFP expression in H2B-mRFP+ epidermis is limited to HFSCs and early HFSC progeny along upper ORS in anagen (right). Hatched lines denote spliced out middle-region of HF. d, Temporal activation of Cxcl14-SE-eGFP in SOX9+ cells, concomitant with HFSC niche establishment at P2. e, HFSC-specific targeting by mir205- and Nfatc1-SE-epicenters, whereas Cxcl14-promoter and Elovl5-TE display broader activity. Atypical Cited2-TE binds all 7 HFSC-TFs and drives HFSC-specific targeting. f, Cux1-SE-eGFP is silent in HFSCs, but activated during the hair cycle in TACs and differentiating IRS progeny. Dotted lines denote epidermal-dermal border; solid lines delineate DP (dermal papilla). Bu, bulge (HFSC niche). • denotes hair shaft autofluorescence.
By adult, H2B-mRFP1 was expressed throughout skin epithelium. Notably however, eGFP was confined to HFSCs that reside in the outer layer of the resting (telogen) phase “bulge” niche (Fig. 2c, Extended Data Fig. 5). As a new hair cycle began, Cxcl14-SE-eGFP activity persisted in HFSCs and early transitory progeny within the upper outer root sheath (ORS) of regenerating HFs. By contrast, the reporter was silenced in committed TACs, which lack HFSC-TFs altogether. Cxcl14-SE-eGFP's specificity extended to development, where it became faithfully activated coincident with HFSC-TF and niche establishment24 (Fig. 2d).
Similar eGFP patterns were observed when HFSC super-enhancer epicenters from Nfatc1 and miR205 were used as drivers. However, in contrast to its super-enhancer, Cxcl14's promoter drove broad skin epithelial expression, as did Elovl5's typical-enhancer. Despite some tissue-specific elements, these regions lacked clustered HFSC-TF binding sites. By contrast, Cited2's typical-enhancer uncharacteristically contained all HFSC-TF motifs and correspondingly exhibited HFSC-specificity. Summarized in Fig. 2e, these results provide compelling evidence that concentration of binding sites for a diverse array of HFSC-TFs is what confers lineage and stage-restricted specificity, whose activity is largely refractory to integration site.
Prior knowledge of master regulators was not necessary to tease apart these specialized regulatory elements from those driving broader expression. Thus, by identifying a MED1-bound, H3K27ac-intense epicenter of the TAC super-enhancer-controlled Cux1 gene25, we could generate a reporter with activity restricted to the HF channel (IRS) TACs (Fig. 2f; Extended Data Fig. 5). These findings illustrate the power of super-enhancers and their epicenters for developing genetic tools with unprecedented cell-type, temporal, lineage and stage specificity.
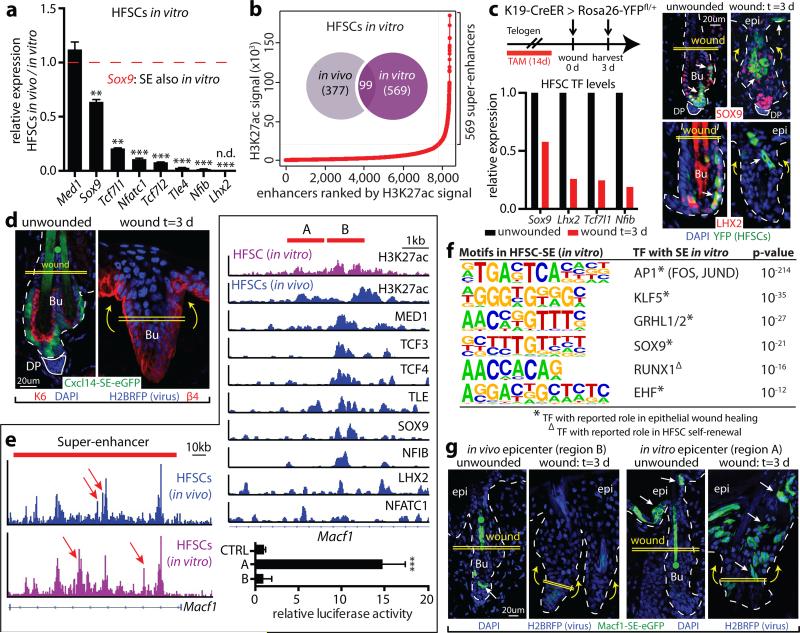
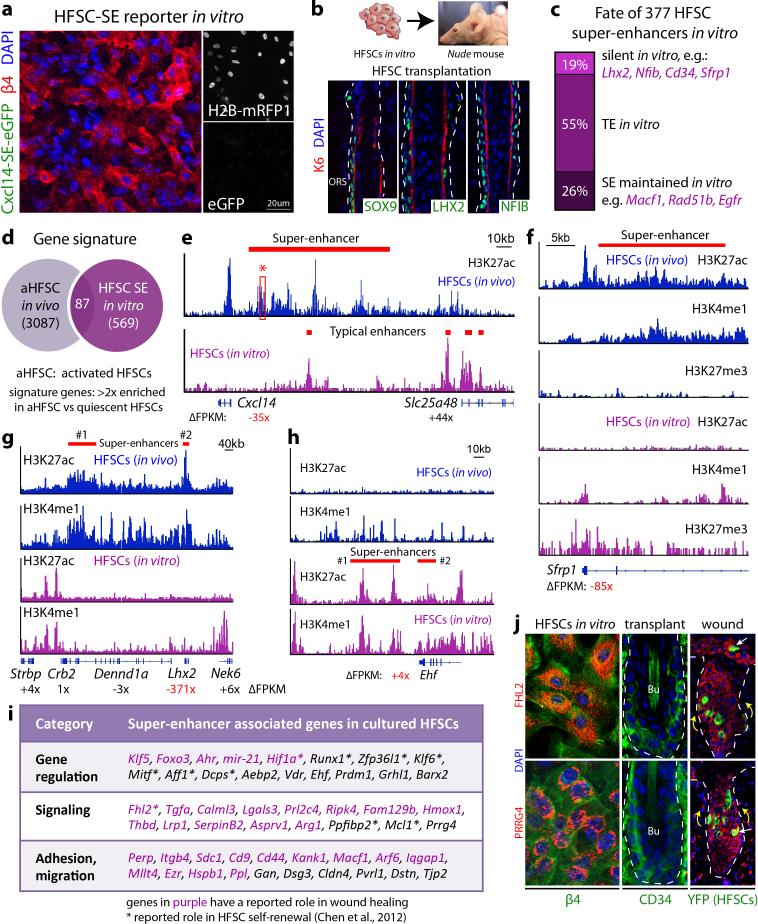
Intriguingly, Cxcl14-SE-eGFP activity was silent in cultured HFSCs, consistent with the complete decommissioning of HFSC niche super-enhancers in vitro (Extended Data Fig. 6). Super-enhancer-associated HFSC-TF genes were also repressed in vitro, but upon engraftment26, were faithfully restored. This behavior suggested that super-enhancer epicenters are reversibly sensitive to their microenvironment. Additionally, although new super-enhancers were acquired in vitro, few corresponded to “signature genes” of HFSCs proliferating in vivo6, suggesting environmental adaptation more than proliferative status (Fig. 3a,b; Extended Data Fig. 6).
Figure 3. The sensitivity of super-enhancers to environmental changes allows HFSC adaptation and plasticity.
a, Repression of HFSC-TF genes in vitro. Mean and standard deviation are shown (n = 3). P-values from t-test: **P<0.01; ***P<0.001; n.d., not detected. b, Super-enhancers in HFSCs show little overlap in vivo and in vitro. c, Down-regulation of HFSC-TFs during wound-repair in K19-CreER(HFSC-specific)/R26YFP mice. SOX9 is present in migrating HFSCs at reduced levels. d, Cxcl14-SE-eGFP reporter is repressed in wound-induced HFSCs. e, In vivo versus in vitro HFSC differences in H3K27ac peak (epicenter) distributions (arrows) of Macf1's super-enhancer. One epicenter shift is magnified at right. Region B represents an epicenter active in vivo, richly bound by HFSC-TFs; adjacent region A is an epicenter active in vitro. Mean and standard deviation of relative luciferase activities are shown below (n = 3). P-value from t-test: ***P<0.001. f, Motif analysis for TF binding sites of in vitro HFSC-SEs. g, Functional validation of epicenter shifts in mice transduced with Macf1-SE-eGFP reporters. Note dynamic changes in reporter activity upon wounding.
Curiously, some genes acquiring super-enhancers in vitro were epidermal genes, while others have been implicated in wound-repair. If these dynamics reflect a transitional state analogous to early stages of wound-repair, super-enhancer regulated genes should change quickly once HFSCs exit their niche and migrate into a wound bed. To test this possibility, we fluorescently tagged niche HFSCs, introduced a shallow wound, and monitored them for proteins whose genes had changed super-enhancer status in vitro. Shortly after epidermal injury, YFP-marked HFSCs down-regulated both super-enhancer-regulated TF genes and LV-transduced Cxcl14-SE-eGFP (Fig. 3c,d). Conversely, wound-activated HFSC progeny induced Fhl2 and Prrg4, which in culture, displayed super-enhancer-mediated activity. Moreover upon transplantation, these in vitro-induced genes were silenced concomitant with HF regeneration (Extended Data Fig. 6j). Together, these findings underscore the sensitivity of super-enhancers to their microenvironment11,12, and directly link the relevance of culture-induced super-enhancer dynamics to wound-repair and fate plasticity.
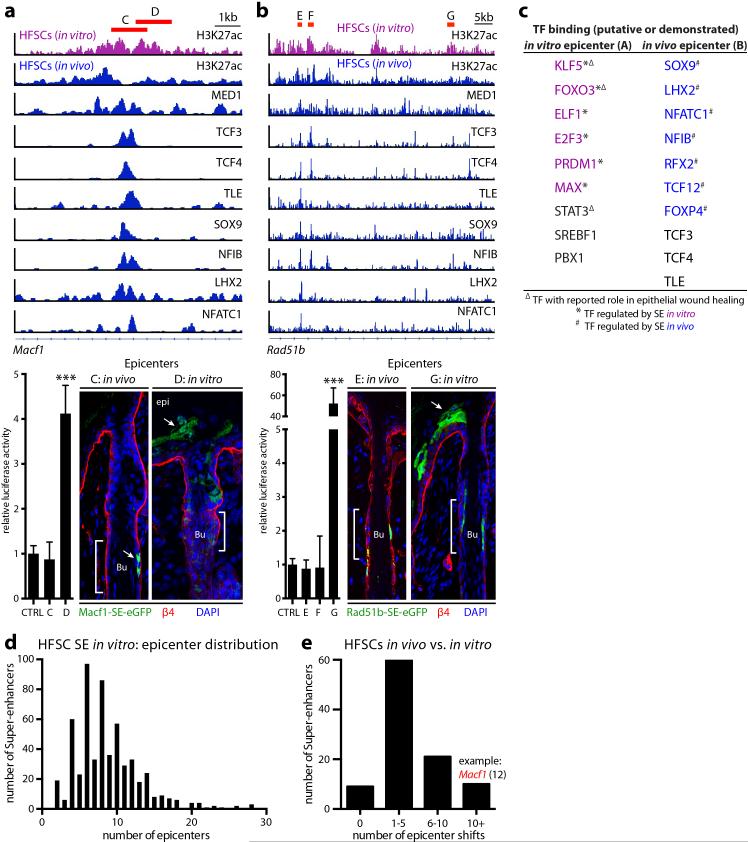
A small cohort of genes maintained super-enhancers in vitro, including those from a recent HFSC self-renewal screen27 and genes like Macf1 that function in wound-repair28. Seeking how these super-enhancers remain active in the face of down-regulated HFSC-TFs, we noticed that their epicenters had shifted in culture (Fig. 3e). Upon analyzing several of these shifts, we learned that instead of HFSC-TF-motifs, in vitro epicenters were enriched for epidermal/wound-related motifs. These included AP1, KLF, grainyhead-like and FOX families, many of whose genes displayed in vitro-specific super-enhancers (Fig. 3f; Extended Data Fig. 7a-c).
Using reporter assays, we tested functionality of 7 different epicenter shifts. In vitro, physiological HFSC epicenters exhibited no luciferase activity, while culture-based epicenters were robustly active. Conversely, when tested in vivo, in vitro epicenters were only active in epidermis while physiological HFSC epicenters restricted expression to the HF niche. However following injury, in vitro epicenters were induced in activated HF cells undergoing epidermal repair, while epicenters of quiescent HFSCs became repressed (Fig. 3g).
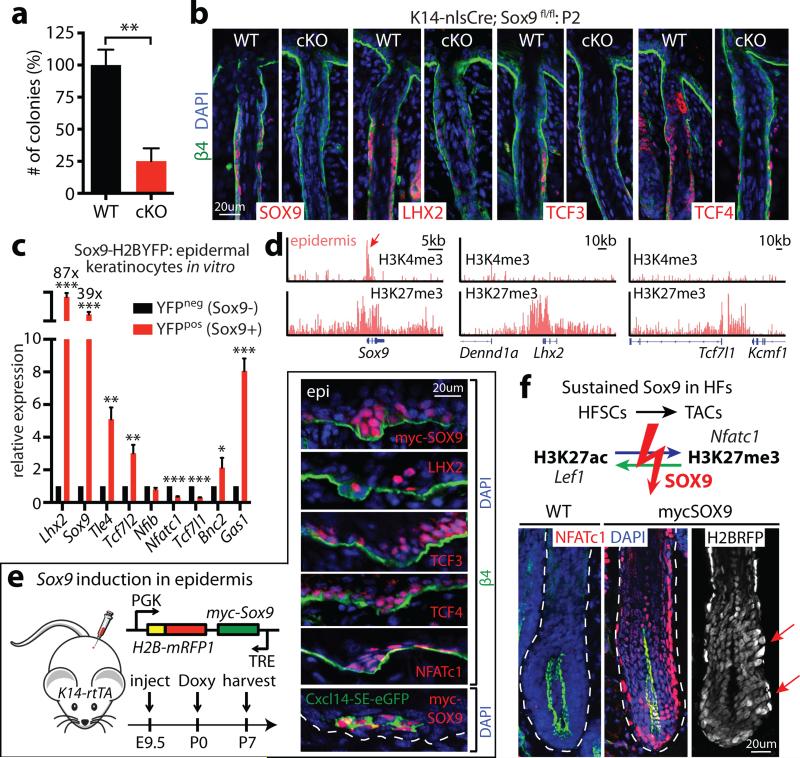
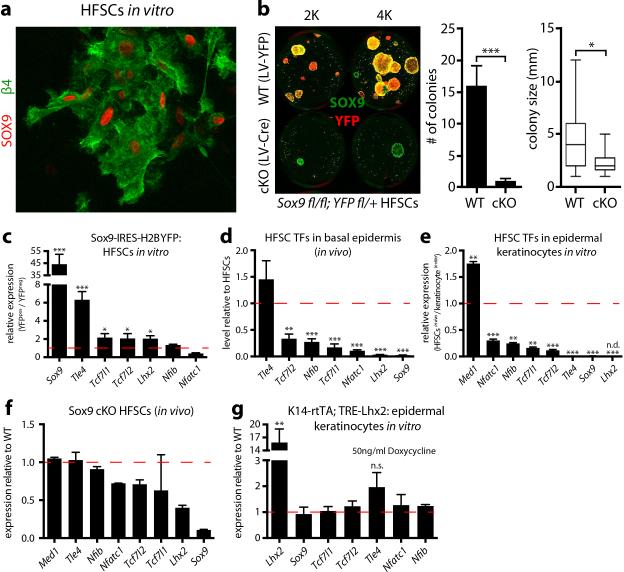
How might HFSCs exploit super-enhancer dynamics to elicit the plasticity to regenerate HFs during homeostasis, repair damaged epidermis following injury and adapt to culture? We were drawn to SOX9, since Sox9 was the only HFSC-TF gene that maintained a super-enhancer in vitro, where it was expressed at lower levels (Fig. 3a, Extended Data Fig. 8). It was also maintained at reduced levels in wound-activated HFSCs, suggesting a role for SOX9 in transitional states (Fig. 3c). Curiously, quantitative Sox9 ablation in adult HFSCs16 plummeted colony-forming efficiency in vitro, and Sox9 ablation during skin embryogenesis blocked LHX2, TCF3 and TCF4 expression and formation of functional HFSCs (Fig. 4a,b).
Figure 4. SOX9 is a pioneer factor governing HFSC fate and plasticity.
a, Colony formation assays on WT and Sox9-cKO HFSCs. Mean and standard deviation are shown (n = 3). P-value from t-test: **P<0.01. b, HFSC-specification fails in Sox9-cKO mice. c, Ectopic Sox9 in epidermal keratinocytes induces HFSC-SE genes. Mean and standard deviation are shown (n = 3). P-values from t-test: *P<0.05; **P<0.01; ***P<0.001. d, HFSC-TF genes Lhx2 and Tcf7l1 are PcG-repressed in epidermis, while Sox9 is poised. e, Forced in vivo expression of Sox9 in epidermal progenitors activates HFSC-TF genes. Note induction of HFSC-SE regulated Cxcl14-SE-eGFP. f, Sustained SOX9 during HF regeneration. Note prevention of swap in H3K27 modifications of key SEs upon TAC fate commitment. NFATc1 atypically persists in lower ORS and TACs, and minibulge-like structures occur along ORS (arrows).
Conversely, ectopic SOX9 in cultured HFSCs induced Lhx2, Tcf7l1 and Tcf7l2 transcription. Even more impressive were SOX9's effects on epidermal keratinocytes, which in vitro as in vivo, did not express HFSCTFs. Lhx2 showed >80X elevation upon SOX9 induction in epidermal cultures and repression shortly after Sox9-ablation in HFSCs. Neither Sox9, Tcf7l1 nor Tcf7l2 showed such sensitivity to LHX2, indicating a special importance for SOX9 in regulating HFSC super-enhancer activity (Fig. 4c, Extended Data Fig. 8g).
If SOX9 is a true pioneer factor whose levels dictate whether super-enhancers will be epigenetically active or silenced, then inducing SOX9 in skin epidermis should activate genes such as Tcf7l1 and Lhx2 whose super-enhancers are PcG-silenced (Fig 4d). We tested this possibility with a doxycycline-inducible SOX9 lentivirus transduced in utero into K14-rtTA animals and activated at P0 or P21. Notably, SOX9 expression in epidermis activated other super-enhancer controlled HFSC-TF genes. SOX9's ability to initiate H3K27 acetylation was exemplified by its activation of normally PcG-silenced Lhx2 in epidermis. The activation of Cxcl14-SE-eGFP in SOX9-expressing epidermis explicitly traced the phenomenon to super-enhancers (Fig. 4e).
Finally, prolonging SOX9 in the HF lineage generated equally striking perturbations. Lower ORS was riddled with minibulge-like structures concomitantly with persistent LHX2, TCF3/4 and SOX9 in this transitory zone. NFATc1 was atypically sustained in lower ORS and TACs, while the switch to TAC super-enhancers was impaired (Fig. 4f, Extended Data Fig. 9). The failure of Nfatc1 to become PcG-silenced in SOX9+ TACs shows that SOX9 protects against H3K27me3 silencing at super-enhancer regulated genes. In summary, by coupling a pioneer factor, SOX9, which senses local changes in microenvironment, to chromatin platforms optimized for sensing TF concentration, super-enhancers orchestrate the chromatin dynamics required for skin SCs to pursue distinct lineages, repair wounds and exhibit plasticity in transitional states.
Methods
Mouse lines
Female CD1 mice (8 weeks old, Charles River) were used for the purification of HFSCs. Female CD-1 mice transgenic for Krt14-H2B-GFP29 (30-32 days old) were used for the purification of TACs. Krt15-CrePGR; Sox9fl/fl; R26YFPfl/+ mice have been described16. Krt19-CreER mice have been described30. CreER was activated by intraperitoneal injection of mice with 20mg ml-1 tamoxifen (Sigma) in corn oil (Sigma) to specifically label HFSCs. For the generation of K14-H2B-iRFP mice, iRFP was first amplified from pShuttle-CMV-iRFP (Addgene plasmid 31856) and fused with H2B, before the H2B-iRFP construct was assembled with the Krt14 promoter, β-globin intron and poly(A) sequences31. Transgenic mice were generated with standard pronuclear injections. For lentiviral injections, transduced mice were confirmed by genotyping with RFP primers: forward 5′-ATCCTGTCCCCTCAGTTCCAGTAC-3′, reverse 5′-TCCACGATGGTGTAGTCCTCGTTG-3. For TRE-mycSox9 transduced mice, positive mice were fed with doxycycline-containing chow, starting either at P0 (newborn) or at P21 (adult). No formal randomization was performed, and studies were not blinded. Mice were maintained in the Association for Assessment and Accreditation of Laboratory Animal Care-accredited animal facility of The Rockefeller University (RU), and procedures were performed with Institutional Animal Care and Use Committee (IACUC)-approved protocols.
Flow cytometry
Preparation of adult mice back skins for isolation of HFSCs and TACs were done as previously described8,32. Briefly, for telogen skin, subcutaneous fat was removed with a scalpel, and skins were placed dermis side down on trypsin (Gibco) at 37°C for 35 min. Single-cell suspensions were obtained by scraping the skin gently. Anagen skin was treated with collagenase at 37 °C for 30 minutes to dissociate dermal cells and then incubated with trypsin at 37 °C for 15 minutes to detach and generate single cell suspensions of the epidermal and HF cells. Cells were then washed with PBS containing 5% of fetal bovine serum (FBS), then filtered through 70μm and 40μm cell strainers. Cell suspensions were incubated with the appropriate antibodies for 30 min on ice. The following antibodies were used for FACS: α6-PE (1:100, eBiosciences), CD34-eFluoro660 (1:100, eBiosciences) and Sca-1-PerCP-Cy5.5 (1:1000, eBiosciences). DAPI was used to exclude dead cells. Cell isolations were performed on FACSAria sorters running FACSDiva software (BD Biosciences).
ChIP-seq
Immunoprecipitations were performed on FACS-sorted populations from female mice or on cultured HFSCs8. For each ChIP-seq run, 7 × 10⁶ to 2 × 10⁷ cells were used. Antibodies used for ChIP-seq were anti-H3K27ac (abcam, ab4729), anti-H3K4me1 (abcam, ab8895), anti-Crsp1/Trap220 (Med1, Bethyl Laboratories, A300-793A) and anti-H3K27me3 (Millipore, 07-449). Briefly, cells were cross-linked in 1% (wt/vol) formaldehyde solution, resuspended, and lysed. To solubilize and shear cross-linked DNAs, lysates were subjected to a Bioruptor Sonicator (Diagenode, UCD-200) according to a 30x regimen of 30s sonication followed by 60s rest. The resulting whole-cell extract was incubated overnight at 4°C with 10 μL of Dynabeads Protein G magnetic beads (Life Technologies) which had been pre-incubated with 5μg of the appropriate Ab. After ChIP, samples were washed, and bound complexes were eluted and reverse–cross-linked. ChIP DNA was prepared for sequencing by repairing sheared DNA and adding Adaptor Oligo Mix (Illumina) in the ligation step. A subsequent PCR step with 25 amplification cycles added the additional Solexa linker sequence to the fragments to prepare them for annealing to the Genome Analyzer flow cell. After amplification, a range of fragment sizes between 150–300 bp was selected and the DNA was gel-purified and diluted to 10 nM for loading on the flow cell. Sequencing was performed on the Illumina HiSEq 2500 Sequencer following manufacturer protocols. ChIP-seq reads were aligned to the mouse genome (mm9, build 37) using Bowtie aligner33. ChIP-Seq signal tracks were presented by Integrative Genomics Viewer (IGV) software.
Bioinformatics analysis
H3K27ac peaks were called by the program MACS34 (v 1.4.2, default parameters) from the ChIP-seq data with the input as controls. The peaks were associated to genes using the mouse RefSeq annotations; those located within 2kb of transcription start sites were called as “promoter” peaks and the rest were “enhancer” peaks. The H3K27ac enhancer peaks were used for the identification of super-enhancers, using the algorithm described previously, wherein enhancer peaks were stitched together if they are located within 12.5kb of each other and if they don't have multiple active promoters in between. Enhancers were then ranked according to increasing H3K27ac signal intensity5. Enhancer-gene assignments were performed using the following criteria to make gene assignments: (1) proximity of genes to the SE of stem cells; (2) high transcriptional activity in stem cells (by RNA-seq and by ChIP-seq for presence of H3K4me3/H3K79me2 marks and no H3K27me3 marks in the promoter/typical enhancer and/or gene body; (3) correlation between loss of the SE (or shift in its epicenter peaks), loss of gene transcription and loss of H3K79me2 mark ± H3K27me3 mark in proliferative short-lived progenitors; (4) correlation between loss of the SE (or shift in its epicenter), loss of gene transcription and loss of H3K79me2 mark ± H3K27me3 mark in proliferative cultured stem cells. The overlap of super-enhancers with ChIP-seq peaks for MED1 and other TFs was defined by >= 1 base overlap. For TF enrichment analysis at super-enhancers, H3K27ac peaks not located at super-enhancers (i.e., typical enhancers) were randomly picked, extended to match the sizes of super-enhancers and used as background controls. GO function enrichment analyses were carried out by the software GREAT35 using the list of super-enhancer coordinates and the default setting. For motif analysis of enhancers located in superenhancers, 1-kb sequences under the H3K27ac peaks were searched for enriched motifs using the software HOMER (v4.6) with the default setting (PMID 20513432). Epicenters were defined as 1kb-regions flanking either side of the H3K27ac peaks. 1-kb was chosen based on our analysis of the distances of H3K27ac peaks to their nearest transcription factor ChIP-seq peaks in HFSCs in vivo (distance of the two peak centers, Extended Data Fig. 3e), which showed an enrichment of TF binding within 1-kb regions of H3K27ac peaks. Overlapping epicenters were merged during this analysis. To analyze epicenter shifting, for each of the overlapping super-enhancers between HFSCs in vivo and in vitro, we determined the number of epicenters that were not overlapping in the two samples and considered them as shifting epicenters. To generate the heatmap (Extended Data Fig. 3c), the program seqMiner36 was used to calculate the ChIP-seq read densities, which were the maximal numbers of overlapping ChIP-seq reads in 50-bp bins from -5 kb to +5 kb of the H3K27ac peak summits. The density matrix was clustered based on the H3K27ac ChIP-signal and then used to generate a heatmap.
Antibodies
The following antibodies and dilutions were used: SOX9 (rabbit, 1:1000, Millipore), NFIB (rabbit, 1:1000, Active Motif), LHX2 (rabbit, 1:2000, Fuchs lab), K6 (guinea pig, 1:5000, Fuchs Lab), K24 (rabbit, 1:5000, Fuchs lab), CD34 (rat, 1:100, BD-Pharmingen), LEF1 (rabbit, 1:100, Fuchs lab), NFATc1 (mouse, 1:100, Santa Cruz), TCF3 (guinea pig, 1:200; Fuchs laboratory), TCF4 (rabbit, 1:300; Cell Signaling Technology), FHL2 (rabbit, 1:100, abcam), PRRG4 (rabbit, 1:100, abcam), CUX1 (rabbit, 1:200, Santa Cruz), β4-Integrin (rat, 1:100, BD-Pharmingen), GFP (chicken, 1:2000, Abcam), RFP (rabbit, 1:5000, MBL; or guinea pig, 1:3000, Fuchs lab). Secondary Abs coupled to Alexa488, RRX, or Alexa647 were from Life Technologies. Nuclei were stained using 4’6’-diamidino-2-phenylindole (DAPI).
Histology, Immunofluorescence and Imaging
Back skins from mice were embedded in OCT (Tissue Tek), frozen, cryosectioned (10-20 μm) and fixed for 10 min in 4% paraformaldehyde (PFA) in phosphate buffered saline (PBS). For lentivirally transduced mice, head and backskins were pre-fixed in 4% PFA for 4h at 4 degrees, followed by washes in PBS and incubation in 30% sucrose, before embedding in OCT. Sections were blocked for 1hr in gelatin block (5% normal donkey serum, 1% BSA, 2% fish gelatin, 0.3% Triton X-100 in PBS). Primary antibodies were diluted in blocking buffer and incubated at 4°C overnight (O/N). MOMBasic kit (Vector Laboratories) was used for blocking when primary antibodies were generated from mouse. After washing with PBS, secondary antibodies, were added for 1hr at room temperature (RT). Slides were washed with PBS, counterstained with 4’6’-diamidino-2-phenylindole (DAPI) and mounted in Prolong Gold (Invitrogen). Images were acquired with an Axio Observer.Z1 epifluorescence microscope equipped with a Hamamatsu ORCA-ER camera (Hamamatsu Photonics), and with an ApoTome.2 (Carl Zeiss) slider that reduces the light scatter in the fluorescent samples, using 20x objective, controlled by Zen software (Carl Zeiss). Z stacks were projected and RGB images were assembled using ImageJ. Panels were labeled in Adobe Illustrator CS5.
Lentiviral expression constructs
Lentiviral super-enhancer reporters were generated by PCR amplification of selected enhancer regions from BAC clones, followed by insertion into KpnI and BsaBI restriction sites of the Rbpj-EGFP construct37. To generate the Sox9 expression construct, Sox9 cDNA was PCR amplified, and inserted into the LV-TRE-PGKH2BmRFP1 construct18. The resulting LV-TRE-mycSox9-PGK-H2BmRFP was used for in utero injections.
Partial Thickness Wound (Dermabrasion) and HFSC transplantation
Animals were anesthetized with Ketamine/Xylazine and administered Bupenorphine analgesia. Skin was shaved and remaining hair cleared with hair removal cream. Skin was gently stretched between two fingers and epidermis removed using a small rotary drill (Dremel) with a polishing wheel attachment (model 520), to create a partial-thickness wound. HFSC transplantations were described previously26.
Cell Culture
Primary HFSCs were isolated from P52-60 K14-H2B-iRFP mice and plated onto mitomycin C-treated dermal fibroblasts in E-media supplemented with 15% (vol/vol) serum and 0.3 mM calcium32. For colony formation assays, equal numbers of Sox9-deficient live cells were plated. After 14 days in culture, cells were fixed and stained with 1% (wt/vol) Rhodamine B (Sigma). Colony diameter was measured from scanned images of plates using Image J and colony numbers were counted. For viral infections, HFSCs were spun with lentivirus for 30 min at 1100g in the presence of polybrene (100 μg/ml)23. For Sox9 over-expression studies, the PGK-Sox9-IRES-H2BYFP construct was transfected into cultured HFSCs or epidermal keratinocytes. 72h later, YFP+ and YFP- cells were purified by FACS. Luciferase assays were performed as described15.
RNA extraction and qRT-PCR
FACS-isolated cells were sorted directly intro TrizolLS (Invitrogen). Total RNA was purified using the Direct-zol RNA MiniPrep kit (Zymo Research) per manufacturer's instructions. DNase treatment was performed to remove genomic DNA (RNase-Free DNase Set, Qiagen) Equal amounts of RNA were reverse-transcribed using Oligo-dT primers (Superscript III, Life Technologies). qRT-PCR was performed on an Applied Biosystems 7900HT Fast Real-Time PCR system. cDNAs were normalized to equal amounts using primers against Ppib2.
Statistics
For all measurements, 3 biological replicates and 2 or more technical replicates were used. Experiments were independently replicated twice, and representative data are shown. To determine the significance between two groups, comparisons were made using unpaired two-tailed Student's t test in Prism6 (GraphPad software). For all statistical tests, the 0.05 level of confidence was accepted for statistical significance.
Extended Data
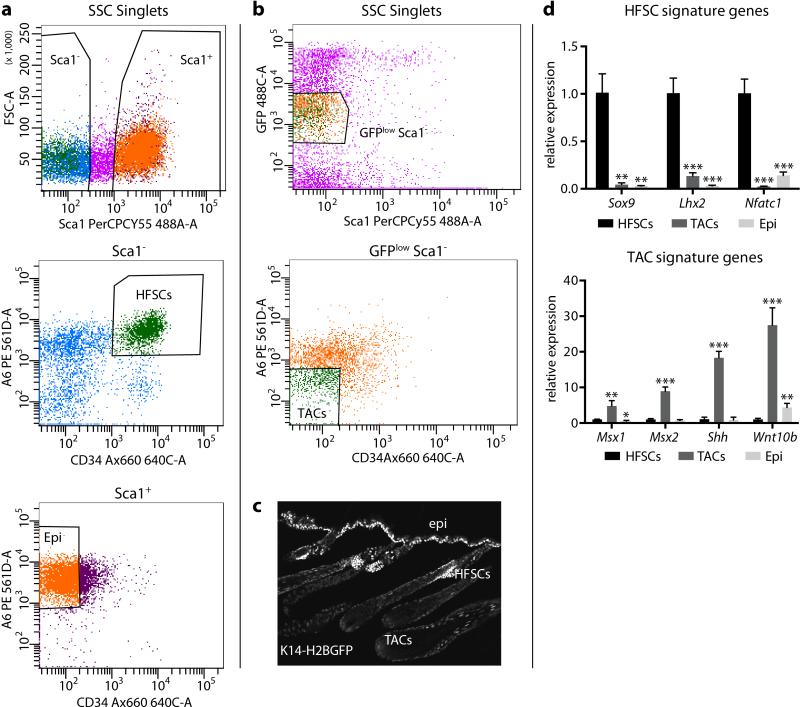
Extended Data Figure 1. FACS purification strategy to isolate HFSCs and TACs.
a, FACS purification of WT HFSCs for ChIP-Seq according to established markers α6hi and CD34+ 26. Sca1 is used to remove basal epidermal cells. b, FACS purification of TACs from Krt14-H2B-GFP mice29. TACs are GFPlow Sca1- α6low/- CD34-. c, Epifluorescence of Krt14-driven H2B-GFP. HFSCs and epidermal cells are GFPhi, whereas TACs are GFPlow. d, q-PCR to verify the FACS sorting strategy and measure enrichment of cell-type specific marker genes. Mean and standard deviation are shown (n = 3). P-values from t-test: *P<0.05; **P<0.01; ***P<0.001, relative to HFSCs.
Extended Data Figure 2. Enhancer distribution, size and gene assignment in HFSCs.
a, Distribution of H3K27ac occupancy at promoter and enhancers in HFSCs. b, Distribution of typical and super-enhancers in HFSCs. c, Enhancer size distribution in HFSCs. d, Number of individual H3K27ac peaks per gene. Super-enhancers are clusters of H3K27ac peaks and mainly consist of ≥5 peaks per gene. e, f, Enhancer-gene assignments, exemplified by HFSC-SEs Fzd6 and Btg2. FPKM, fragments per kilobase of transcript per million mapped reads (RNA-seq). g, Differential expression for genes driven by HFSC-SEs and TEs. P-values from t-test: ***P<0.001. h, Density plot, contrasting expression levels of TE- versus SE-associated HFSC genes in HFSCs compared to epidermal progenitors. Note cell type-specific differences in expression for HFSC genes controlled by super-enhancers but not typical enhancers. i, Gene Ontology analysis of genes controlled by HFSC enhancers. j, List of selected SE-regulated HFSC genes. SE, super-enhancer; TE, typical enhancer.
Extended Data Figure 3. HFSC-TFs are enriched within super-enhancers and cluster in epicenters.
a, b, Enrichment of HFSC TFs within chromatin of super-enhancers, but not typical enhancers. Comparisons were made with 377 randomly selected typical enhancers and their flanking sequence extended 5’ and 3’ to match the average length of super-enhancers (average of 3 analyses is shown). Each ‘TF event’ (a) represents one HFSC-TF bound within a SE. ‘TF peaks’ (b) refers to the absolute amount of TFs occupying the SE. c, Heatmap showing ChIP-seq read densities (from -5kb to +5kb of peak center) across H3K27ac peaks located in SEs. Note that HFSC-TFs frequently bound densely together with strong H3K27ac peaks. d, Motif analysis of HFSC-SEs for putative TF binding sites. e, Analysis of distance of H3K27ac peaks to their nearest transcription factor ChIP-seq peaks in HFSCs in vivo (distance of the two peak centers). Note that enrichment of TF binding occurs within 1-kb regions of H3K27ac peaks (‘epicenters’). f, Frequency and distribution of HFSC-SE epicenters. g, Rare ‘atypical’ enhancers co-bound by 7 HFSC-TFs are more highly expressed in HFSCs versus committed progenitors.
Extended Data Figure 4. Identification of super-enhancers in TACs.
a, Distribution of H3K27ac ChIP-seq signal across all enhancers in transit-amplifying cells (TACs) reveals 381 super-enhancers of little overlap with HFSC super-enhancers. b, Tracking the status of TAC super-enhancers in HFSCs indicates striking enhancer remodeling upon lineage progression. Example shows the appearance of a de novo super-enhancer for the Dlx3/4 locus as HFSCs commit to a TAC fate. c, Examples of super-enhancer associated genes in TACs. Genes in green have a reported function in HFs.
Extended Data Figure 5. Super-enhancer reporters drive cell-type specific expression.
a, The lentiviral CTRL reporter construct (containing no enhancer) is silent throughout all stages of the hair cycle, despite efficient infection (as evidenced by H2B-mRFP1). b, Immunofluorescence showing that Cxcl14-eGFP super-enhancer reporter activity co-localizes with Krt24+ HFSCs. DP, dermal papilla; Bu, Bulge. White dashed lines denote the epidermal-dermal border; solid lines delineate the DP. c, H3K27ac and MED1 ChIP-seq occupancy at the Cux1 locus in TACs. Red box shows the SE epicenter that was cloned for reporter assays. Note that epicenters bound by MED1 are sufficient to identify cell-stage specific loci, even without prior information about lineage-specific TFs. d, CUX1 expression pattern in hair follicles.
Extended Data Figure 6. HFSCs adapt to microenvironmental changes by reversible remodeling of super-enhancers.
a, Absence of Cxcl14-SE-eGFP reporter activity in transduced cultured HFSCs. b, Transplanted cultured HFSCs establish de novo HFs and regain expression of HFSC-TFs. c, Note extensive HFSC-SE-remodeling upon culture conditions. d, HFSCs in vitro are molecularly distinct from activated HFSCs (aHFSC) in vivo. e-h, H3K27ac levels at the Cxcl14, Sfrp1, Lhx2 and Ehf loci in HFSCs in vivo and in vitro. Note the dynamic regulation of super-enhancers and the resulting changes in gene expression. i, Selected list of super-enhancer associated genes in HFSCs in vitro. j, Note HFSC-SE plasticity in vitro and during wound repair: Fhl2 and Prrg4 display SE-mediated activity in vitro. Upon transplantation, HFSCs silence in vitro-induced genes concomitant with HF regeneration. However, during wounding, HFSCs (lineage marked with K19-CreER/R26YFP) regain expression of Fhl2 and Prrg4.
Extended Data Figure 7. HFSCs activate different epicenters within super-enhancers to sustain expression of critical genes in different microenvironments.
a, b, H3K27ac and HFSC-TF ChIP-seq occupancies at the Macf1 and Rad51b loci in HFSCs in vivo and in vitro. Regions C, E and F mark epicenters active in vivo, richly bound by HFSC-TFs; adjacent regions D and G are novel epicenters active in vitro. Relative luciferase activities were driven by the 1-1.5kb encompassing these epicenters. Mean and standard deviation are shown (n = 3). P-values from t-test: ***P<0.001. Functional validation of epicenter shifts in vivo. eGFP-reporter activity of in vitro epicenters is highly active in the epidermis while physiological HFSC epicenters are restricted to the HF niche. c, Motif analysis of Macf1 epicenters (Regions A and B, Fig. 3e) for putative TF binding sites. d, Number and distribution of HFSC-SE epicenters in vitro. e, Frequency of epicenter shifts in HFSC-SEs (in vivo versus in vitro). Note that corresponding to the loss of HFSC-TFs in vitro, many SEs display epicenter shifts to maintain expression of critical genes (e.g. Macf1) in different microenvironments.
Extended Data Figure 8. HFSC TFs are reduced outside the niche but are sensitive to Sox9 levels.
a, SOX9 is expressed and displays nuclear localization in HFSCs in vitro. b, Colony formation assays on WT and Sox9-cKO HFSCs. Sox9fl/fl Rosa26YFPfl/+ HFSCs were seeded at 2K and 4K and transduced with lentiviral-Cre to achieve Sox9 ablation in vitro. All yellow and green colonies were not effectively targeted and are still SOX9+. All red colonies (SOX9-negative) aborted, as revealed by quantifications of colony numbers and sizes shown at right. c, Sox9-overexpression in cultured HFSCs. SOX9 induces the expression of Tle4, Tcf7l1, Tcf7l2 and Lhx2. d, e, HFSC TFs are expressed at substantially lower levels in basal epidermal progenitors in vivo or in cultured epidermal keratinocytes relative to HFSCs. f, Down-regulation of HFSC TFs in Sox9-cKO HFSCs in vivo before HFSCs are lost. g, Doxycycline-inducible overexpression of Lhx2 in cultured epidermal keratinocytes does not induce HFSC TFs. For b-g, mean and standard deviation are shown (n = 3). P-values from t-test: *P<0.05; **P<0.01; ***P<0.001; n.d., not detected; n.s., not significant.
Extended Data Figure 9. Sustained Sox9 expression in committed progenitors perturbs lineage progression.
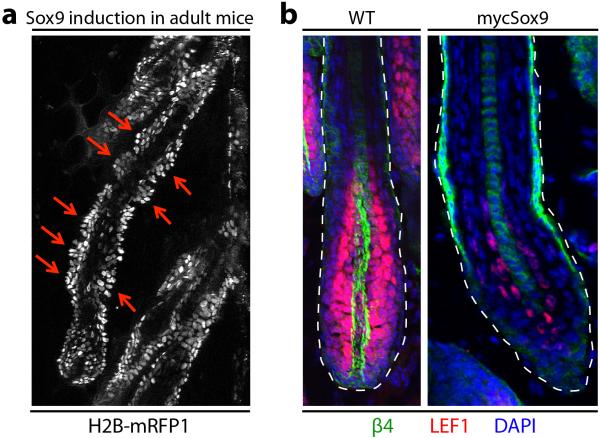
a, Sustained Sox9 in adult mice (Doxycycline for 3 weeks in adult mice, starting at P21) leads to de novo formation of minibulge-like structures along the ORS. b, Immunofluorescence showing that Lef1 (normally H3K27me3 repressed in HFSCs, but H3K27ac super-enhancer induced in TACs) remains repressed in mycSOX9+ HFs.
Supplementary Material
Acknowledgements
We thank S. Mazel, L. Li, S. Semova, and S. Tadesse for FACS sorting (RU FACS facility); and C. Lai for assistance in high-throughput sequencing (RU Genomics Resource Center). We thank E.F. laboratory members A. Aldeguer, S. Hacker, M. Sribour and J. Levorse for assistance in mouse research; I. Matos for advice on image acquisition; J. Racelis, S. Chai, and E. Wong for technical assistance; and Y. Ge, S. Naik, A. Kulukian, and N. Oshimori for valuable discussions. R.C.A. was supported by the Anderson Cancer Center Graduate Student Fellowship. E.F. is an HHMI Investigator. This work was supported by grants from the National Institutes of Health (R01-AR31737 to E.F. and R21MH099452 to D.Z).
Footnotes
Author contributions
R.C.A. and E.F. conceived the project and designed the experiments. R.C.A. and H.Y. performed the experiments, including FACS-purification, ChIP-seq assays, data analysis and in vivo reporter assays. D.S.O. and L.P. carried out in utero lentiviral injections and wounding experiments with mice. S.L., M.N. and M.K. contributed to in vitro experiments. A.A., S.R. and D.Z. performed bioinformatics analyses. E.F. supervised the project. R.C.A. and E.F. wrote the manuscript.
Author Information
ChIP-seq data are deposited in GEO under accession number GSE61316. The authors declare no competing financial interests. Readers are welcome to comment on the online version of the paper.
Online Content
Methods, along with any additional Extended Data display items and Source Data, are available in the online version of the paper; references unique to these sections appear only in the online paper.
Supplementary Information is available in the online version of the paper.
References
- 1.Spradling A, Drummond-Barbosa D, Kai T. Stem cells find their niche. Nature. 2001;414:98–104. doi: 10.1038/35102160. [DOI] [PubMed] [Google Scholar]
- 2.Lopez-Garcia C, Klein AM, Simons BD, Winton DJ. Intestinal stem cell replacement follows a pattern of neutral drift. Science. 2010;330:822–825. doi: 10.1126/science.1196236. doi: 810.1126/science.1196236. Epub 1192010 Sep 1196223. [DOI] [PubMed] [Google Scholar]
- 3.van Es JH, et al. Dll1+ secretory progenitor cells revert to stem cells upon crypt damage. Nat Cell Biol. 2012;14:1099–1104. doi: 10.1038/ncb2581. doi: 1010.1038/ncb2581. Epub 2012 Sep 1023. [DOI] [PMC free article] [PubMed] [Google Scholar]
- 4.Blanpain C, Fuchs E. Stem cell plasticity. Plasticity of epithelial stem cells in tissue regeneration. Science. 2014;344:1242281. doi: 10.1126/science.1242281. doi: 1242210.1241126/science.1242281. Epub 1242014 Jun 1242212. [DOI] [PMC free article] [PubMed] [Google Scholar]
- 5.Whyte WA, et al. Master transcription factors and mediator establish super-enhancers at key cell identity genes. Cell. 2013;153:307–319. doi: 10.1016/j.cell.2013.03.035. doi: 310.1016/j.cell.2013.1003.1035. [DOI] [PMC free article] [PubMed] [Google Scholar]
- 6.Hsu YC, Li L, Fuchs E. Transit-amplifying cells orchestrate stem cell activity and tissue regeneration. Cell. 2014;157:935–949. doi: 10.1016/j.cell.2014.02.057. doi: 910.1016/j.cell.2014.1002.1057. [DOI] [PMC free article] [PubMed] [Google Scholar]
- 7.Ezhkova E, et al. EZH1 and EZH2 cogovern histone H3K27 trimethylation and are essential for hair follicle homeostasis and wound repair. Genes Dev. 2011;25:485–498. doi: 10.1101/gad.2019811. doi: 410.1101/gad.2019811. Epub 2012011 Feb 2019811. [DOI] [PMC free article] [PubMed] [Google Scholar]
- 8.Lien WH, et al. Genome-wide maps of histone modifications unwind in vivo chromatin states of the hair follicle lineage. Cell Stem Cell. 2011;9:219–232. doi: 10.1016/j.stem.2011.07.015. doi: 210.1016/j.stem.2011.1007.1015. [DOI] [PMC free article] [PubMed] [Google Scholar]
- 9.Loven J, et al. Selective inhibition of tumor oncogenes by disruption of super-enhancers. Cell. 2013;153:320–334. doi: 10.1016/j.cell.2013.03.036. doi: 310.1016/j.cell.2013.1003.1036. [DOI] [PMC free article] [PubMed] [Google Scholar]
- 10.Hnisz D, et al. Super-enhancers in the control of cell identity and disease. Cell. 2013;155:934–947. doi: 10.1016/j.cell.2013.09.053. doi: 910.1016/j.cell.2013.1009.1053. Epub 2013 Oct 1010. [DOI] [PMC free article] [PubMed] [Google Scholar]
- 11.Gosselin D, et al. Environment drives selection and function of enhancers controlling tissue-specific macrophage identities. Cell. 2014;159:1327–1340. doi: 10.1016/j.cell.2014.11.023. doi: 10.1016/j.cell.2014.11.023. [DOI] [PMC free article] [PubMed] [Google Scholar]
- 12.Lavin Y, et al. Tissue-resident macrophage enhancer landscapes are shaped by the local microenvironment. Cell. 2014;159:1312–1326. doi: 10.1016/j.cell.2014.11.018. doi: 10.1016/j.cell.2014.11.018. [DOI] [PMC free article] [PubMed] [Google Scholar]
- 13.Liu Z, et al. Enhancer activation requires trans-recruitment of a mega transcription factor complex. Cell. 2014;159:358–373. doi: 10.1016/j.cell.2014.08.027. doi: 10.1016/j.cell.2014.08.027. [DOI] [PMC free article] [PubMed] [Google Scholar]
- 14.Dowen JM, et al. Control of cell identity genes occurs in insulated neighborhoods in mammalian chromosomes. Cell. 2014;159:374–387. doi: 10.1016/j.cell.2014.09.030. doi: 10.1016/j.cell.2014.09.030. [DOI] [PMC free article] [PubMed] [Google Scholar]
- 15.Folgueras AR, et al. Architectural niche organization by LHX2 is linked to hair follicle stem cell function. Cell Stem Cell. 2013;13:314–327. doi: 10.1016/j.stem.2013.06.018. doi: 310.1016/j.stem.2013.1006.1018. [DOI] [PMC free article] [PubMed] [Google Scholar]
- 16.Kadaja M, et al. SOX9: a stem cell transcriptional regulator of secreted niche signaling factors. Genes Dev. 2014;28:328–341. doi: 10.1101/gad.233247.113. doi: 310.1101/gad.233247.233113. [DOI] [PMC free article] [PubMed] [Google Scholar]
- 17.Keyes BE, et al. Nfatc1 orchestrates aging in hair follicle stem cells. Proc Natl Acad Sci U S A. 2013;110:E4950–4959. doi: 10.1073/pnas.1320301110. doi: 4910.1073/pnas.1320301110. Epub 1320302013 Nov 1320301126. [DOI] [PMC free article] [PubMed] [Google Scholar]
- 18.Chang CY, et al. NFIB is a governor of epithelial-melanocyte stem cell behaviour in a shared niche. Nature. 2013;495:98–102. doi: 10.1038/nature11847. doi: 110.1038/nature11847. Epub 12013 Feb 11846. [DOI] [PMC free article] [PubMed] [Google Scholar]
- 19.Lien WH, et al. In vivo transcriptional governance of hair follicle stem cells by canonical Wnt regulators. Nat Cell Biol. 2014;16:179–190. doi: 10.1038/ncb2903. doi: 110.1038/ncb2903. Epub 2014 Jan 1026. [DOI] [PMC free article] [PubMed] [Google Scholar]
- 20.Siersbaek R, et al. Transcription factor cooperativity in early adipogenic hotspots and super-enhancers. Cell Rep. 2014;7:1443–1455. doi: 10.1016/j.celrep.2014.04.042. doi: 1410.1016/j.celrep.2014.1404.1042. Epub 2014 May 1422. [DOI] [PubMed] [Google Scholar]
- 21.Luyten A, Zang C, Liu XS, Shivdasani RA. Active enhancers are delineated de novo during hematopoiesis, with limited lineage fidelity among specified primary blood cells. Genes Dev. 2014;28:1827–1839. doi: 10.1101/gad.240101.114. doi: 10.1101/gad.240101.114. [DOI] [PMC free article] [PubMed] [Google Scholar]
- 22.Kim TH, et al. Broadly permissive intestinal chromatin underlies lateral inhibition and cell plasticity. Nature. 2014;506:511–515. doi: 10.1038/nature12903. doi: 10.1038/nature12903. Epub 2014 Jan 12. [DOI] [PMC free article] [PubMed] [Google Scholar]
- 23.Beronja S, Livshits G, Williams S, Fuchs E. Rapid functional dissection of genetic networks via tissue-specific transduction and RNAi in mouse embryos. Nat Med. 2010;16:821–827. doi: 10.1038/nm.2167. doi: 810.1038/nm.2167. Epub 2010 Jun 1036. [DOI] [PMC free article] [PubMed] [Google Scholar]
- 24.Nowak JA, Polak L, Pasolli HA, Fuchs E. Hair follicle stem cells are specified and function in early skin morphogenesis. Cell Stem Cell. 2008;3:33–43. doi: 10.1016/j.stem.2008.05.009. doi: 10.1016/j.stem.2008.1005.1009. [DOI] [PMC free article] [PubMed] [Google Scholar]
- 25.Ellis T, et al. The transcriptional repressor CDP (Cutl1) is essential for epithelial cell differentiation of the lung and the hair follicle. Genes Dev. 2001;15:2307–2319. doi: 10.1101/gad.200101. [DOI] [PMC free article] [PubMed] [Google Scholar]
- 26.Blanpain C, Lowry WE, Geoghegan A, Polak L, Fuchs E. Self-renewal, multipotency, and the existence of two cell populations within an epithelial stem cell niche. Cell. 2004;118:635–648. doi: 10.1016/j.cell.2004.08.012. [DOI] [PubMed] [Google Scholar]
- 27.Chen T, et al. An RNA interference screen uncovers a new molecule in stem cell self-renewal and long-term regeneration. Nature. 2012;485:104–108. doi: 10.1038/nature10940. doi: 110.1038/nature10940. [DOI] [PMC free article] [PubMed] [Google Scholar]
- 28.Wu X, et al. Skin stem cells orchestrate directional migration by regulating microtubule-ACF7 connections through GSK3beta. Cell. 2011;144:341–352. doi: 10.1016/j.cell.2010.12.033. doi: 310.1016/j.cell.2010.1012.1033. [DOI] [PMC free article] [PubMed] [Google Scholar]
- 29.Tumbar T, et al. Defining the epithelial stem cell niche in skin. Science. 2004;303:359–363. doi: 10.1126/science.1092436. Epub 2003 Dec 2011. [DOI] [PMC free article] [PubMed] [Google Scholar]
- 30.Means AL, Xu Y, Zhao A, Ray KC, Gu G. A CK19(CreERT) knockin mouse line allows for conditional DNA recombination in epithelial cells in multiple endodermal organs. Genesis. 2008;46:318–323. doi: 10.1002/dvg.20397. doi: 10.1002/dvg.20397. [DOI] [PMC free article] [PubMed] [Google Scholar]
- 31.Vasioukhin V, Degenstein L, Wise B, Fuchs E. The magical touch: genome targeting in epidermal stem cells induced by tamoxifen application to mouse skin. Proc Natl Acad Sci U S A. 1999;96:8551–8556. doi: 10.1073/pnas.96.15.8551. [DOI] [PMC free article] [PubMed] [Google Scholar]
- 32.Nowak JA, Fuchs E. Isolation and culture of epithelial stem cells. Methods Mol Biol. 2009;482:215–232. doi: 10.1007/978-1-59745-060-7_14. 10.1007/1978-1001-59745-59060-59747_59714. [DOI] [PMC free article] [PubMed] [Google Scholar]
- 33.Langmead B, Trapnell C, Pop M, Salzberg SL. Ultrafast and memory-efficient alignment of short DNA sequences to the human genome. Genome Biol. 2009;10:R25. doi: 10.1186/gb-2009-10-3-r25. doi: 10.1186/gb-2009-1110-1183-r1125. Epub 2009 Mar 1184. [DOI] [PMC free article] [PubMed] [Google Scholar]
- 34.Zhang Y, et al. Model-based analysis of ChIP-Seq (MACS). Genome Biol. 2008;9:R137. doi: 10.1186/gb-2008-9-9-r137. doi: 110.1186/gb-2008-1189-1189-r1137. Epub 2008 Sep 1117. [DOI] [PMC free article] [PubMed] [Google Scholar]
- 35.McLean CY, et al. GREAT improves functional interpretation of cis-regulatory regions. Nat Biotechnol. 2010;28:495–501. doi: 10.1038/nbt.1630. doi: 410.1038/nbt.1630. Epub 2010 May 1032. [DOI] [PMC free article] [PubMed] [Google Scholar]
- 36.Ye T, et al. seqMINER: an integrated ChIP-seq data interpretation platform. Nucleic Acids Res. 2011;39:e35. doi: 10.1093/nar/gkq1287. doi: 10.1093/nar/gkq1287. Epub 2010 Dec 21. [DOI] [PMC free article] [PubMed] [Google Scholar]
- 37.Williams SE, Beronja S, Pasolli HA, Fuchs E. Asymmetric cell divisions promote Notch-dependent epidermal differentiation. Nature. 2011;470:353–358. doi: 10.1038/nature09793. doi: 310.1038/nature09793. [DOI] [PMC free article] [PubMed] [Google Scholar]
Associated Data
This section collects any data citations, data availability statements, or supplementary materials included in this article.


