Abstract
Peripheral blood cell counts are important biomarkers of radiation exposure. In this work, a simplified compartmental modeling approach is applied to simulate the perturbation of the hematopoiesis system in humans after radiation exposure, and HemoDose software is reported to estimate individuals’ absorbed doses based on multi-type blood cell counts. Testing with patient data in some historical accidents indicates that either single or serial granulocyte, lymphocyte, leukocyte, and platelet counts after exposure can be robust indicators of the absorbed doses. In addition, such correlation exists not only in the early time window (1 or 2 d) but also in the late phase (up to 4 wk) after exposure, when the four types of cell counts are combined for analysis. These demonstrate the capability of HemoDose as a rapid point-of-care diagnostic or centralized high-throughput assay system for personnel exposed to unintended high doses of radiation, especially in large-scale nuclear/radiological disaster scenarios involving mass casualties.
Key words: biodosimetry; blood; dose assessment; modeling, dose assessment
INTRODUCTION
Unintended radiation exposures could occur to personnel due to industrial and medical radiological accidents, nuclear and radiological attacks by terrorists, and large solar particle events (SPEs) during interplanetary space travel. In such scenarios, dosimeters are needed for effective medical management and treatment of the exposed individuals (Swartz et al. 2010). While physical devices can promptly detect radiation contamination in living subjects and reconstruct the radiation intensity in the environment, they cannot detect the absorbed dose and dose distribution in a particular individual or estimate individual radiation sensitivity. To guide medical personnel in their clinical decisions, biological markers are usually applied to examine the radiation-induced changes at different biological levels; i.e., total organism, organ systems, cellular systems, and genomics/proteomics at subcellular levels. These indicators are observable signs, symptoms, or phenotypes as a function of time after radiation exposure. The manifestation of these syndromes reflects the response of physiological processes at various levels of coping with the effects of radiation impairment (Hu et al. 2009). Among these, the peripheral blood cell counts are widely recognized as robust and high throughput indicators to assess the extent of radiation-induced injury (Waselenko et al. 2004). This is due to the fact that the hematopoietic system is one of the most vulnerable parts of the human body to radiation damage (Goans et al. 2001; Fliedner et al. 2007). Empirical formulas such as Guskova’s method (Baranov et al. 1995) and Goans’ method (Goans et al. 1997; Goans and Waselenko 2005) have established a quantitative relationship between the absorbed doses of the exposed individuals and the absolute lymphocyte counts or lymphocyte depletion rates and have been widely used in the research community of radiation casualty management (Sine et al. 2001; REMM 2014). However, experimental and theoretical studies on the underlying mechanisms of these empirical formulas are lacking.
Recently, the authors found that a set of coarse-grained hematopoietic compartmental (CGHC) models can be used to describe the perturbation of blood cell kinetics in animals and humans that is induced by various types of radiation exposures (Hu and Cucinotta 2011). Particularly, the models demonstrated good correlations between the absorbed doses and the time course of granulocyte and lymphocyte changes in peripheral blood after radiation exposure (Hu and Cucinotta 2011; Hu et al. 2012; Hu and Cucinotta 2013). These models were originally proposed by Smirnova in the late 1980s to simulate and interpret experimental data of acute and chronic irradiations on rodents (Smirnova 2011). The authors developed methods to extrapolate these models for dogs, non-human primates, and humans (Hu and Cucinotta 2011), which can simulate many sets of experimental data for large-size animals as well as clinical data of accidental human victims with a wide range of absorbed doses and exposure scenarios (Hu and Cucinotta 2011; Hu et al. 2012). It has been established that the granulopoiesis model can reproduce the initial granulocytosis, the following depression and abortive rise, the nadir period, and the final regenerative phase, which span from the timepoint of exposure to several weeks post-exposure (Hu and Cucinotta 2011). For the human lymphopoiesis model, the simulated lymphocyte counts and the depletion rate constants are consistent with the empirical methods of Guskova’s and Goans’ formulas (Hu et al. 2012). These results suggest that these models can be used as biodosimetry tools to assess radiation injury. Furthermore, they may provide a framework to illustrate the biological mechanism of the two empirical formulas that link the peripheral blood cells and absorbed doses.
Modeling the radiation-induced perturbation of the hematopoietic system has been pursued for several decades (Bond et al. 1965; Steinbach et al. 1980; Wichmann and Loeffler 1985; Fliedner et al. 1996). However, most models are built upon a very detailed architectural organization from hematopoietic stem cells (HSCs) to mature blood cells, which are speculated to comprise up to 31 stages (Dingli et al. 2007). These models also contain a large number of variables and coefficients that are difficult to determine experimentally. The Smirnova’s approach applied in the recent series of works considers all four major cell lines (granulopoiesis, lymphopoiesis, erythropoiesis, and thrombopoiesis) in a framework of negative feedback control via an implicit regulation mechanism, with each cell line consisting of either three or four coarse-grained compartments, and explicit parameters measurable by conventional hematological and radiobiological methods (Smirnova 2011). The implicit treatment of various regulation factors is consistent with physiological and particularly the radiation-pathophysiological observations. It is revealed that, for each cell line, not only a network of hematopoietic cytokines exist that regulate cell viability, multiplication and differentiation (Sachs 1996), but there are also nervous factors characterized by myelinated and unmyelinated nerve fibers in bone marrow that control cellular flow. Also cellular factors such as the continuous migration of HSCs through the blood assure a sufficient number of HSCs in each bone marrow subunit (Fliedner et al. 2002). These factors work together to allow the heterogeneously distributed bone marrow to act and react as “one organ” for the complicated cell renewal processes in the whole body. An implicit treatment of such a complex mechanism is superior to the explicit way, as the regulation of each cell line acts not just locally but in terms of how a system operates across all levels of organization. With this advantage and the simplified coarse-grained hematopoietic compartmental structure, effects of various radiation conditions can be incorporated easily into the cellular kinetic equations, and a dynamic relationship between the peripheral blood and bone marrow precursor cells after radiation damage can be rigorously established (Smirnova 2011).
In this work, the authors present their endeavor to use four sets of CGHC models for humans as a biodosimetry tool to estimate dose through the dynamics of multi-type blood cell counts after radiation exposure. This is stimulated by a recent work on modeling the human thrombopoietic response after radiation (Smirnova 2012) and the fact that the dynamics of leukocyte counts after significant exposure follow a pattern very similar to that of the granulocyte counts (UNSCEAR 1988). This investigation indicates that the granulocyte, lymphocyte, leukocyte, and platelet counts after exposure are robust indicators of radiation doses for exposed victims. In addition, the correlation of the absorbed doses with the multi-type blood cell counts is established not only in the early time window (1–2 d) but also in the late phase (up to 4 wk) after exposure. The blood cell assay is readily available, automated, and inexpensive because it is a standard diagnostic tool for investigating many clinical conditions. Furthermore, the peripheral blood counts are must-have information to monitor the health status of victims in any radiation-related accidental scenarios. Therefore, it is expected that these modeling tools can be used as rapid, point-of-care diagnostic or centralized high-throughput assay systems for radiation exposure and injury assessment, especially for large-scale radiation accident/incident scenarios involving mass casualties.
In the following section, the models for these four systems, the algorithms of dose estimation, and the functions of each module in the software HemoDose are discussed. In the next section, patient data in some historical accidents are used as examples to demonstrate the capabilities of these tools. After that, the four models are compared with respect to their prediction strength as well as possible limitations. The last section provides a summary and some future research directions.
MATERIALS AND METHODS
CGHC models for humans
As the detailed granulopoiesis and lymphopoiesis models for various animals and humans have been described previously (Hu and Cucinotta 2011; Hu et al. 2012), only a brief summary of a unified version of the granulopoiesis, lymphopoiesis, and thrombopoiesis models for humans is provided here.
Based on the scheme of Smirnova (Kovalev and Smirnova 1996), each hematopoietic line is considered to contain three coarse-grained compartments, according to the degree of the maturity and dividing capability of the cells:
X1, the dividing precursor cells (from stem cells in the respective microenvironment to morphologically identifiable dividing cells);
X2, the nondividing but maturing cells; and
X3, the mature cells in peripheral blood.
The granulopoiesis model also considers the mature granulocytes in various tissues (X4) (Hu and Cucinotta 2011).
The killing rate of whole body irradiation at a dose rate N is described in the dynamics of the concentration of each cell compartment as

where xi (i=1,2,3,4) are the concentrations of cells in compartment Xi (defined as x0 == x1), B0 is the reproduction rate of X1 cells, Bi (i =1,2,3,4) are the specific transfer rates of cells from the various pools to the next pools, and Di is the conventional radiobiological dose D0 for Xi cells (a dose after which the number of cells in this compartment reduces to 37% of their initial number).
For each cell compartment, it is assumed that two types of damaged cells are induced by radiation; i.e.,


where  and
and  are the concentrations of moderately damaged and heavily damaged Xi cells, which collectively survive 1–2 d and only 4–7 h, respectively, after radiation injury; ρi the ratio of the numbers of moderately damaged and heavily damaged Xi cells; and νmd and νhd the specific death rates of these two types of damaged cells. For granulopoiesis and thrombopoiesis, only X1 cells are radiosensitive (i.e., Di > 1 = ∞), and therefore i = 1 in eqns (2) and (3). But for lymphopoiesis, all three compartments are radiosensitive, and i = 1–3 in the above equations (Hu et al. 2012).
To determine the ratio ρi of the moderately damaged and heavily damaged Xi cells, another radiosensitivity parameter  for interphase cells was introduced, which is defined as the acute dose that reduces the number of cells in interphase (4–7 h) to 37% of the initial number (Kovalev and Smirnova 1996), such that

where i = 1 for granulopoiesis and thrombopoiesis, and i = 1–3 for lymphopoiesis.
Following the injured cells hypothesis proposed by Bond et al. (1965), the undamaged X1 cells are further divided into intact and weakly damaged cells, both of which undergo proliferation and maturation at the same rates as normal cells until an abortive rise time Tar is reached. Then cells from the weakly damaged group die at the same rate as the moderately damaged cells νmd. Tar is found to be linearly related to the absorbed dose D,

where T0 and E are time parameters that are unique for specific hematopoietic lineages and species, and D = N × Δt (Hu and Cucinotta 2011; Hu et al. 2012).
Another radiosensitivity parameter,  , is introduced to characterize the dynamics of the weakly damaged cells:

where νwd specifies the death rate of the weakly damaged cells.
Based on the implicit regulation mechanism, the production rate of X1 cells is determined by other parameters and cell concentrations (Smirnova 2011):

where A is the maximum specific rate of cell division; θi, Φ, and Γ represent the dissimilar contribution of different cells to the regulators production; and β is determined by the transfer rates of the compartments to ascertain that the system can be maintained in the steady state when no radiation is imposed (Hu and Cucinotta 2011), which has the following form:

For acute radiation, the above equations are further simplified as the terms for cell killing vanish after exposure, which are reported earlier (Hu and Cucinotta 2011; Hu et al. 2012). The control parameters and radiobiological parameters of the models of human granulopoiesis, lymphopoiesis, and thrombopoiesis used in HemoDose are listed in Table 1. They are first estimated based on the parameters set for rodents (Kovalev and Smirnova 1996) and the differences in cellular amplification factor and transfer rates for the hematopoietic systems between rodents and humans (Hu and Cucinotta 2011) and further optimized by matching the simulation results with empirical data from various sources.
Table 1.
The control parameters and radiobiological parameters of the models of human granulopoiesis, lymphopoiesis, and thrombopoiesis utilized in HemoDose.
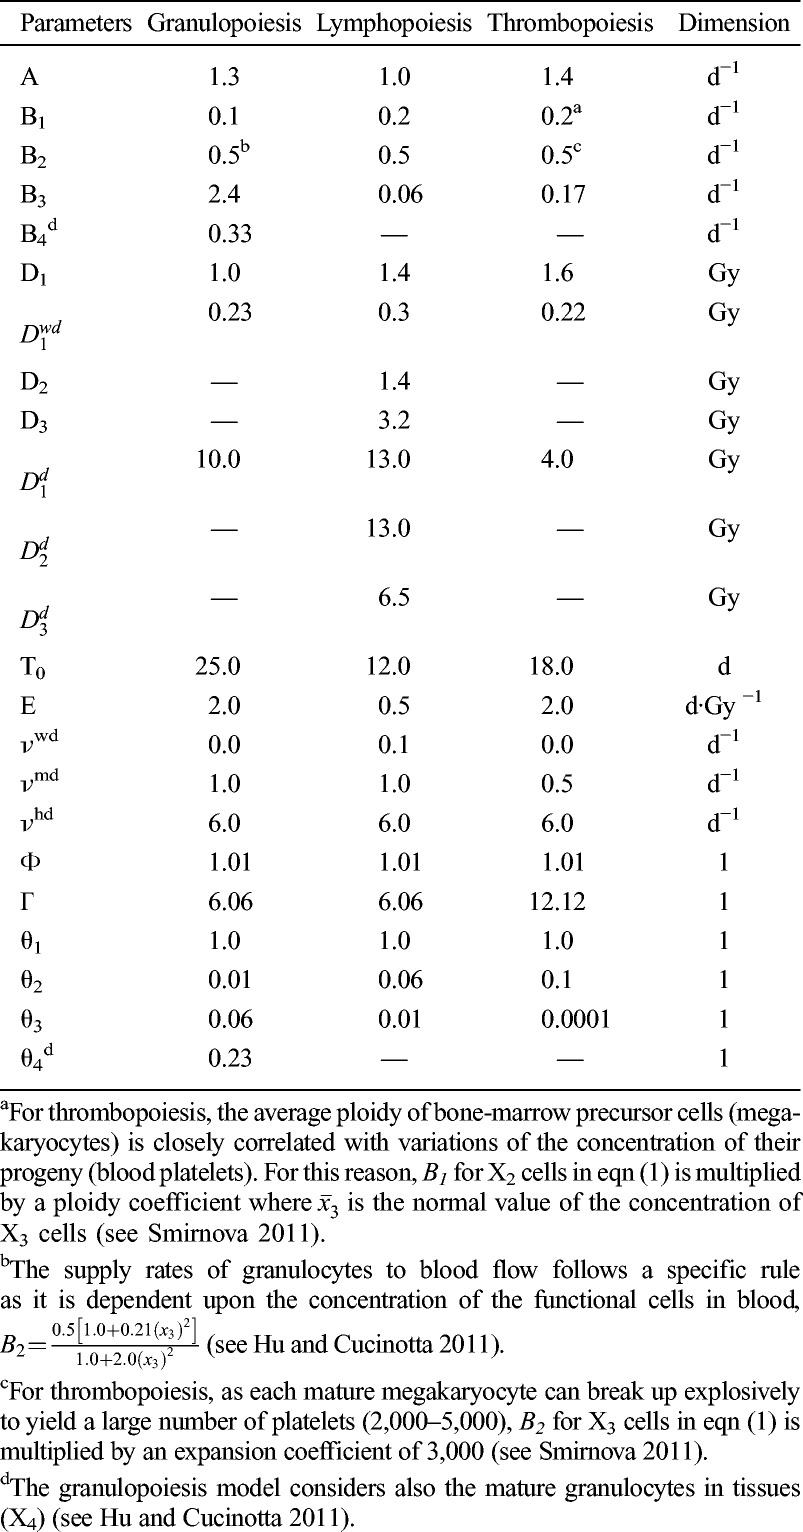
The above formalism shows that the granulopoiesis system after acute radiation can be modeled by the kinetics of seven groups of cells, the lymphopoiesis system by 10 groups of cells, and the thrombopoiesis system by six groups of cells. Granulocytes and lymphocytes are the major components of leukocytes, and the lymphocyte count is rapidly depressed and recovered very slowly after exposure. In HemoDose, the leukopoiesis model system is assumed to take the same form as the granulopoiesis system, but with a different reference count. The strength and limitation of this treatment will be discussed in the following sections.
Algorithm of dose estimation
The dose estimation in HemoDose is conducted by a simple trying and matching algorithm. First, a profile of blood cell counts (G/L) vs. post-exposure time (days) is constructed for granulocytes, lymphocytes, leukocytes, or platelets as the input to the program. Then a set of trial values of acute dose (D) are introduced into the cell-specific system of differential equations, and by integrating, a set of curves representing the dynamics of peripheral blood cell counts are generated. After that, the sums of deviations of the simulated counts from the clinical counts are calculated for all trial doses, and the trial dose that generates the best match (i.e., the minimum deviation) is chosen as the simulated dose.
A two-stage search process is used to find the best match. In the first stage, doses ranged from 0.1 Gy to 12.1 Gy with steps of 1 Gy. In the second stage, trial values range around the best dose from the first stage, this time in steps of 0.1 Gy. Therefore the estimated doses in HemoDose are reported with accuracy of 0.1 Gy. No further accuracy is pursued as the blood cell counts are known to have significant individual variations and temporal variations (Costongs et al. 1985). After the best match is identified, the lower and upper 95% confidence intervals (CI) of the estimated dose for each model are calculated by assuming the baseline count is 125% and 80% of the reference value, respectively. These values are chosen to be within the usual variation ranges of the blood cell counts of healthy adults (Costongs et al. 1985).
To reproduce the closest results between the simulated doses and the reported ones, it is found that the three models need to use different weighting schemes. For the thrombopoiesis model, the clinical data before 30 d post-exposure are assumed to dominate the contribution to the fitting parameter, while each data point after 30 d post-exposure contributes only 0.1 of the data in early phase. A similar scheme applies for the lymphopoiesis model, except that the early phase is defined as 7 d post-exposure. For the granulopoiesis model, however, applying reduced weights to the late phase data does not improve the prediction power but instead is found to impair the accuracy of the estimation; therefore, no weighting scheme is applied. This holds also for the leukopoiesis model.
Reference blood cell counts
To compare the simulated results with the clinical data, a reference blood cell count is needed for each type of cell. In HemoDose, the mean values for adults (age group 18–57 y) are used for granulocytes, lymphocytes, and platelets (4.0, 2.0, and 250.0 G/L, respectively) (Costongs et al. 1985). For the leukopoiesis system, however, it is found that a reference count of 8.0 G/L helps the model to generate the best results, though the mean leukocyte counts for adults is 6.6 G/L (Costongs et al. 1985).
If the mean values of the blood cell counts of the patient are known from routine physical examination or from pre-exposure measurement, replacing the default reference counts with the known individual mean counts will significantly improve the fit of the model to the clinical data. Therefore, the dose predicted this way is assumed to be closer to the real exposure.
Accidental data sets
HemoDose web tools store several sets of hematological data of exposed personnel in some historical radiation accidents, all adapted from public literature. These include five patients’ data from the 1958 Oak Ridge Y-12 plant accident (Andrews and Sitterson 1959), 82 patients’ data from the 1986 Chernobyl accident (Guskova et al. 2001), three patients’ data from the 1999 Tokaimura accident (Hirama et al. 2003), and three patients’ data from the 1999 Henan accident (Liu et al. 2008).
The Henan accident is distinct from the other three in several aspects. First, all three patients received protracted exposure rather than acute radiation, with exposure time varying from 9.3 h to 20 h (Liu et al. 2008). Second, there were one adult female patient and one young age (8 y old) male patient in this accident report, while all patients in other accidents were adult males. Third, all three patients in this accident were not identified as radiation victims immediately but were hospitalized several days later and received cytokine and transfusion treatments more than 10 d after exposure. This happened because the accident occurred at a rural site in China, not like the other accidents that occurred at industrial sites.
As most sets of data from the Chernobyl accident are available, these data sets are used to calibrate the four hematopoiesis models, and the data sets from the other three accidents are used to test the models.
Software modules
HemoDose web tools are mainly comprised of four modules of hematopoietic response after radiation exposure: granulocyte count, lymphocyte count, leukocyte count, and thrombocyte count, which can be accessed at http://spaceradiation.usra.edu/irModels/. Each module contains three groups of functional programs–Plot Historical Data, Model Historical Data, and Model Clinical Data–each displayed in a tab once a module is selected (Fig. 1).
Fig. 1.
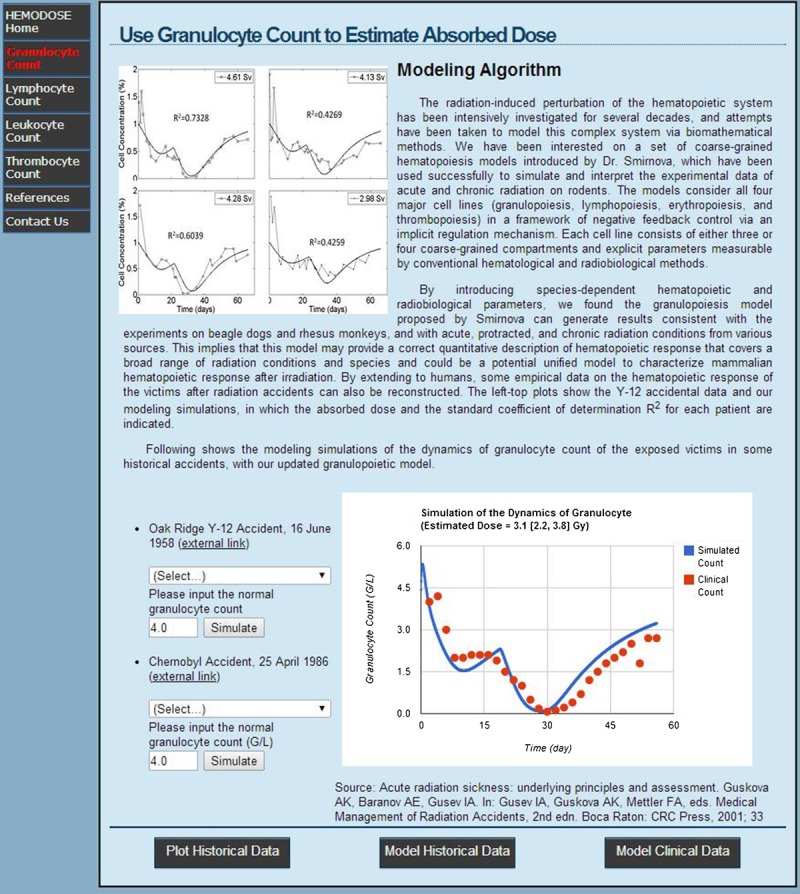
The “Model Historical Data” tab of HemoDose after the granulocyte module is selected. The simulation result is depicted in the lower-right plot for the 2.5 [2.0–3.0] Gy group (17 patients) in the Chernobyl accident.
The “Plot Historical Data” tab displays a web page with a list of historical events. The user can select a patient or a group in an accident, and the temporal profile of the blood cell counts will be plotted. As the plotting program is built with interactive Google Chart (https://developers.google.com/chart/), the counts at specific times can be displayed by moving the cursor on the scattering points.
The “Model Historical Data” tab provides the same list of historical events, but the specific model is triggered when the “Simulate” button is clicked, generating a plot with the best fitting curve juxtaposed along with the historical data points and a simulated dose with 95% CI (Fig. 1).
The “Model Clinical Data” tab estimates the absorbed doses of radiation for exposed victims, and it uses specific blood cell counts at different time points after exposure as inputs. HemoDose provides two ways for the user to input clinical data. The first option allows a prepared data file from a local computer to be uploaded, which contains the post-exposure times (days) and the corresponding blood cell counts (G/L) as a set of two-column data. The times and the corresponding blood cell counts will be displayed in the next web page for the user to check the correctness of input. A “Restart” button directs the user to upload the file again. Once the file is confirmed and a reference blood cell count is provided, clicking the “Run” button will launch the background codes of the corresponding hematopoiesis models, which generate a best-fitting curve based upon the input data, plot the curve as well as the input data, and give out an estimated dose with an uncertainty range (i.e., 95% CI). The second option allows the user to input the clinical data manually and, similarly, to simulate the best-fitting dynamics of specific blood cell counts as compared with the input, and to give out an estimated dose with CI.
All four modules of this set of web tools were incorporated with a set of PHP-script-driven web pages, which were tested with major browsers such as Google Chrome, Microsoft Internet Explorer (IE), Apple Sarafi, and Mozilla Firefox. A Windows desktop version was also developed. They are currently accessible at http://spaceradiation.usra.edu/irModels/.
RESULTS
Accident data sets simulations
Chernobyl accident
Two sets of hematological data were adapted from public reports on the Chernobyl accident. The first set of data is from a report that documented over 82 Chernobyl patients, with diagnosed doses ranging from 0.1 Gy to 13.8 Gy (Guskova et al. 2001). They were divided into eight groups with mean doses of 0.4, 1.1, 2.5, 3.3, 4.5, 5.0, 7.5, and 12.0 Gy, the numbers of patients in which were 10, 18, 17, 7, 8, 8, 5, and 9, respectively. The second set of data is from the UNSCEAR 1988 report, which was a scientific response shortly after the Chernobyl accident. It provided a series of various blood cell counts of some individual patients exposed to relatively low dose whole body irradiation (UNSCEAR 1988).
The group data reported in Guskova et al. (2001) were used to calibrate the three basic CGHC models. Table 2 lists the doses simulated from the final forms of the respective models. The simulated doses by the granulopoiesis model with all available data points are within 1 Gy difference from the reported doses for the respective groups with exposures from 0.4 to 7.5 Gy. For the 12.0 Gy group, the granulopoiesis model reaches its upper limit (10.5 Gy) after taking the corresponding granulocyte counts as input. The lymphopoiesis model also reaches the upper limit for this group, but the simulated dose (11.5 Gy) is closer to the reported dose. Except for the groups with doses of 3.3 Gy and 4.5 Gy, the simulated doses of other groups by the lymphopoiesis model with all available data points are within 1 Gy difference from the reported doses (Table 2). The differences for the 3.3 and 4.5 Gy groups are 1.1 and 1.4 Gy, respectively, and the severity order is reversed from the reported order, though the uncertainty ranges of the reported and simulated doses have some overlaps. The simulated doses by the thrombopoiesis model for the six groups with exposure from 0.4 to 5.0 Gy are within 0.7 Gy difference from the reported doses. However, this model underestimates the absorbed doses of the two most highly exposed groups.
Table 2.
Model simulations of the absorbed doses of the patients in the Chernobyl accident.
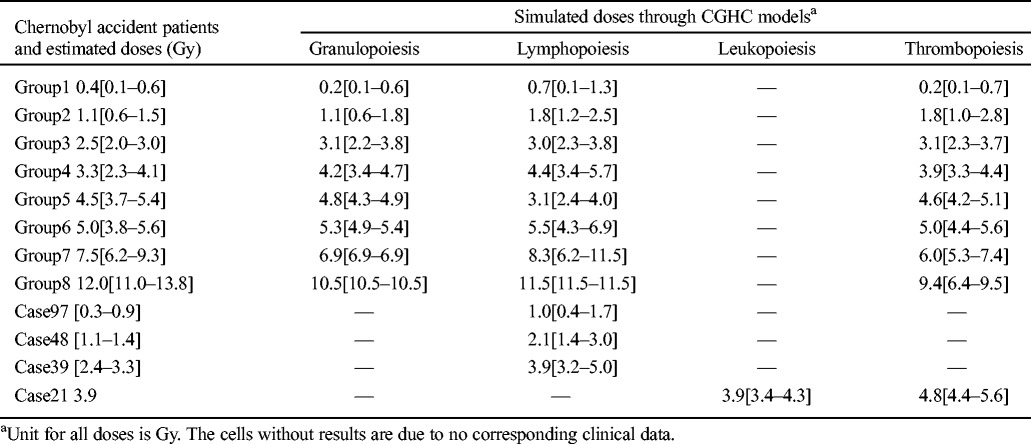
When these models are applied to individual data reported in UNSCEAR (1988), most simulated doses are higher than reported, except for the one simulated by the leukopoiesis model for Case 21, which reproduces the correct reported dose (Table 2). Nevertheless, such discrepancies are generally regarded as acceptable due to the complexity and uncertainty of any exposure diagnosis process and the individual variation of the hematopoietic response to radiation injury.
Fig. 2 shows the temporal profiles of granulocyte, lymphocyte, and platelet counts of two groups of Chernobyl accident patients (mean absorbed dose 1.1 Gy and 5.0 Gy, respectively), along with the simulation results by the three CGHC models with all available data points. It is clear that all three models fit the clinical data better in the early phase (<30 d) than in the late phase (>30 d). These three types of blood cell counts in the late phase are known to have larger variations in victims than in the early phase (Fliedner et al. 2001). For this reason, the fitting parameters of the models use different weights of the clinical data in different phases, as discussed above.
Fig. 2.
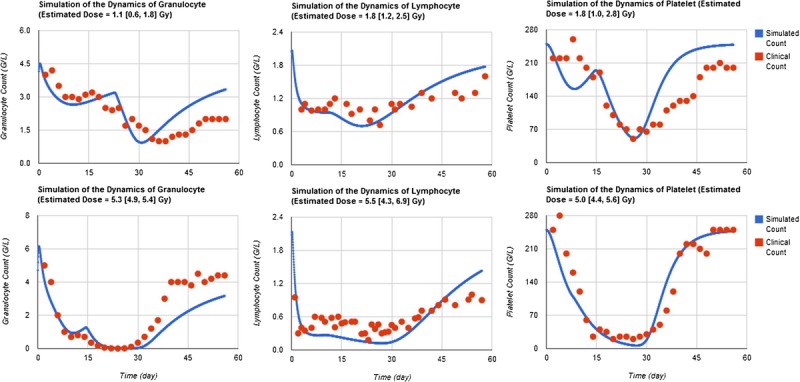
HemoDose model simulations of the Chernobyl accident data. The temporal profile of granulocyte, lymphocyte, and platelet counts are those of two cohorts of Chernobyl accident patients (mean absorbed dose 1.1 Gy and 5.0 Gy, respectively), which are adapted from Guskova et al. (2001).
Oak Ridge Y-12 plant accident
When these models are applied to clinical data of the Oak Ridge Y-12 plant accident patients, there is a systematic underestimation of the absorbed doses (Table 3). The granulopoiesis, lymphopoiesis, and leukopoiesis models can distinguish the severely exposed patients (>3 Gy) from the moderately exposed patients (<3 Gy), though in some cases the discrepancies between simulated doses and those reported are larger than 1.4 Gy. All simulated doses by the thrombopoiesis model are within 0.9 Gy differences of the reported; however, the order of severity predicted by this model is not correct. It should be noted that the control parameters of these models are calibrated based on the limited sources of radiation victims’ data from the Chernobyl accident in an effort to reproduce the closest results as compared to the reported doses. In the future when more sources are available, the control parameters can be adjusted, and the accuracy of prediction can be improved.
Table 3.
HemoDose model simulations of the absorbed doses of the patients in the Y-12 plant accident.

Fig. 3 shows HemoDose model simulations of the temporal profile of granulocyte, lymphocyte, leukocyte, and platelet counts of patient A in the Y-12 plant accident with all available data points. Though the simulated doses of these four models are lower than the reported (3.65 Gy), most characteristics of the dynamics of all four types of blood cell counts are faithfully reproduced, which include the initial elevation and the subsequent depletion, abortive rise, nadir phase, and recovery phase for granulocytes and leukocytes; the initial rapid depletion and the subsequent long duration of nadir phase for lymphocytes; and the initial shoulder phase and the subsequent depletion to nadir and recovery for platelets.
Fig. 3.
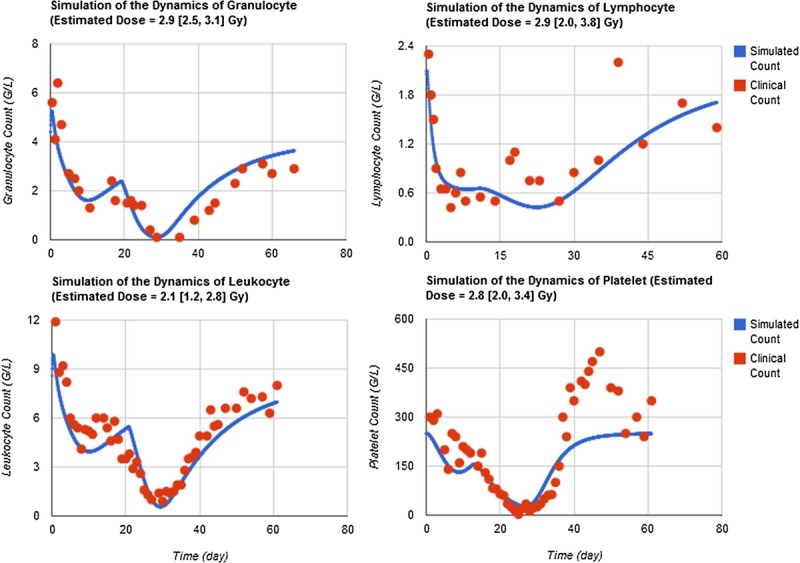
HemoDose model simulations of the Y-12 plant accident data. The temporal profile of granulocyte, lymphocyte, leukocyte, and platelet counts of patient A in the Y-12 plant accident are reproduced from Andrews and Sitterson (1959) and Fliedner et al. (1996).
Tokai-mura accident
Table 4 reports the simulated doses based on the first 10-d blood counts for patients A and B, and 76-d counts for patient C in the Tokai-mura accident (Hirama et al. 2003). It should be noted that all three patients were hospitalized immediately after the exposure and received medical intervention such as granulocyte colony-stimulating factor (G-CSF) administration on day 1 or 2. In addition, patients A and B also received hematopoietic stem cell transplantation on day 2 and 9, respectively. These treatments should have significantly changed the hematological response of the victims. For patients A and B, all the simulated doses through the counts of three types of blood cells reach or nearly reach the upper limits of the respective models (9.9–12.5 Gy), which are consistent with the severity of their injury, though not consistent with their reported doses. For patient C, the administration of G-CSF apparently changed the time course of neutrophil and leukocyte counts after exposure, as the modeling simulations through these two types of cell counts (0.1 Gy) failed to reveal the severity of exposure. On the contrary, the lymphocyte and platelet counts appear to be unaffected by such intervention, and the simulated doses are close to the reported dose for this patient (3.6 and 4.6 Gy, respectively).
Table 4.
HemoDose model simulations of the absorbed doses of the patients in the Tokai-mura accident.

Henan accident
The three patients the Henan accidents received medical therapies more than 10 d after exposure (Liu et al. 2008). However, only leukocyte counts are reported. With the 60-d leukocyte counts, the simulated dose for Patient C (37 y, male) is 4.2 [3.5–4.7] Gy, which is reasonably close to the reported dose (2.8 [2.5–3.2] Gy). However, for Patient A (38 y, female), the simulated dose is 7.2 [6.4–7.9] Gy, which is a bit higher than the reported dose (5.4 [4.3–6.6] Gy). For the young Patient B (8 y, male), the simulated dose is 5.4 [5.2–5.4] Gy, significantly higher than reported (2.8 [2.4–3.1] Gy). This might be attributed to the protracted exposure these patients received or the age and gender factors, as the current versions of CGHC models assume that the baseline counts of four types of cells are those of healthy adults (age group 18–57 y) (Costongs et al. 1985). Recent research implied that these baselines may vary for groups of different ages and genders (Hirokawa et al. 2013). In addition, the radiosensitivity parameters of the various cellular compartments for children should be different from the adults.
Short time window simulations
Though the early post-exposure points contribute more to the reconstruction of absorbed doses with CGHC models, especially for lymphocyte counts, the authors found that the clinical hematology data in late time windows after exposure are still reliable to simulate the exposure severity. Table 5 shows the HemoDose model simulations of the absorbed doses of the patients in the Y-12 plant accident based on the blood cell counts in different time windows after exposure. For the lymphopoiesis model, the early time points regenerate better results as compared with the reported doses. However, the results from late time points are not very wayward; for the cases reported in Table 5 and Fig. 4, all simulated doses from different time windows can be accepted as good indicators of the exposure severity. For the other three models, the clinical data in late time windows generate even better results than in early time windows. This is due to the facts that, unlike the lymphocyte counts that drop exponentially after exposure, granulocyte and leukocyte counts experience initial rise, then depression and abortive rise in the early phase, and thrombocyte counts have a shoulder phase before they drop to nadir (Fig. 2). These results demonstrate that the blood cell counts at the late time points after exposure can still be used to estimate the absorbed doses, and HemoDose can be used as a lag-time biodosimetry tool in the case of a large radiological/nuclear attack, in which many victims may not be diagnosed immediately after exposure.
Table 5.
HemoDose model simulations of the absorbed doses of the patients in the Y-12 plant accident based on the blood cell counts in different time windows after exposure.
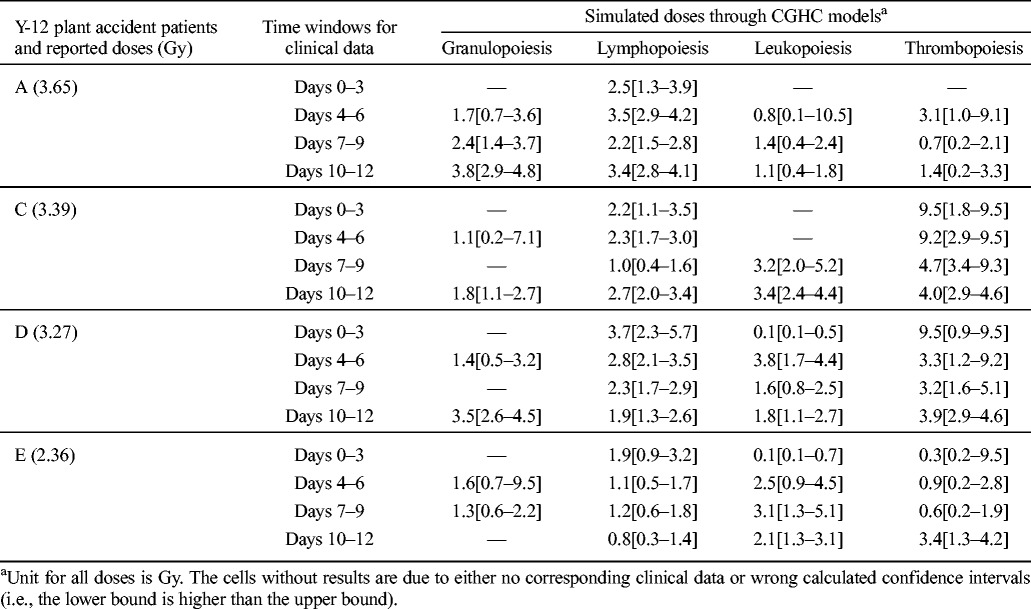
Fig. 4.
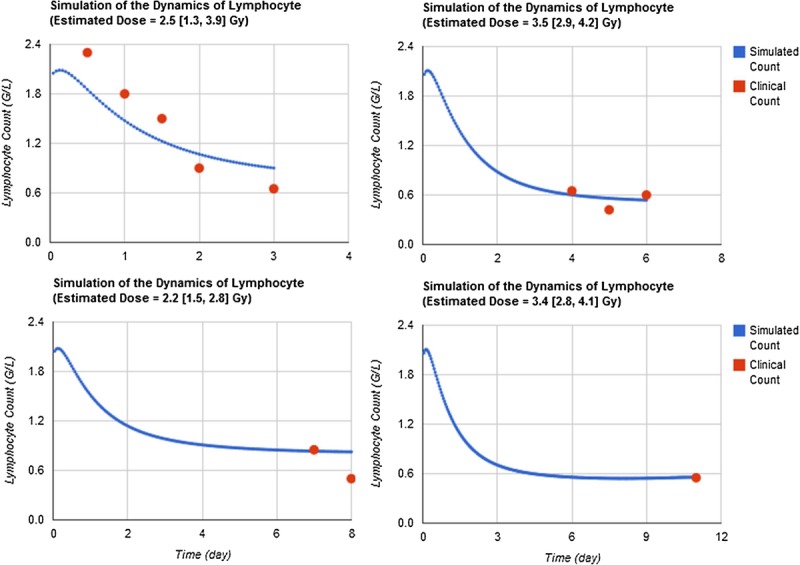
Short time windows simulations. HemoDose model simulations of the absorbed dose of patient A in the Y-12 plant accident based on the lymphocyte counts in different time windows after exposure. Clinical data were reproduced from Andrews and Sitterson (1959).
Single point simulations
Fig. 4 also indicates that, in HemoDose, the absorbed dose of an exposed victim can be estimated with even one cell count. This capability is thoroughly investigated for the four CGHC models implemented in HemoDose. Fig. 5 lists all the reconstructed doses for patient A in the Y-12 plant accident from just one count of differentiated cells after exposure. Some data points generate incorrect results, as the lower bound of CI is higher than the upper bound, and they are not listed in the figure, but the listed doses are reasonably close to the reported dose (3.65 Gy). Among the four models, the lymphopoiesis model performs the best in the early phase (<15 d), as in this time window (2–15 d) almost every data point generates a good estimation compared to the reported dose. However, the doses simulated from the first three time points (0.5, 1, and 1.5 d) are significantly underestimated (Fig. 5). To use these points, the multiple time point’s simulation demonstrates to be more reliable (Fig. 3). Fig. 5 also indicates the thrombopoiesis model performs the single point simulations quite well during the late phase (15–30 d), and the granulopoeisis and leukopoiesis models occasionally generate correct doses. These results demonstrate that, if the four models are used complementarily, HemoDose can be used as a simple tool to rapidly estimate radiation dose in mass-casualty and population-monitoring scenarios, not only in the early time windows but also during the late phase (<4 wk) after exposure.
Fig. 5.
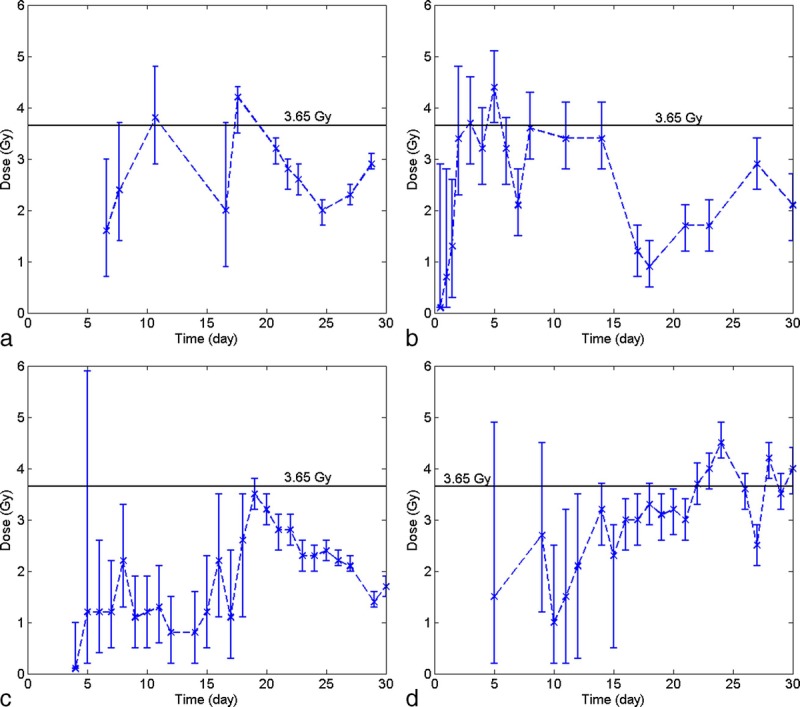
Single point simulations of the absorbed dose of patient A in Y-12 plant accident. (a) granulocyte counts, (b) lymphocyte counts, (c) leukocyte counts, (d) platelet counts.
Comparing with other methods
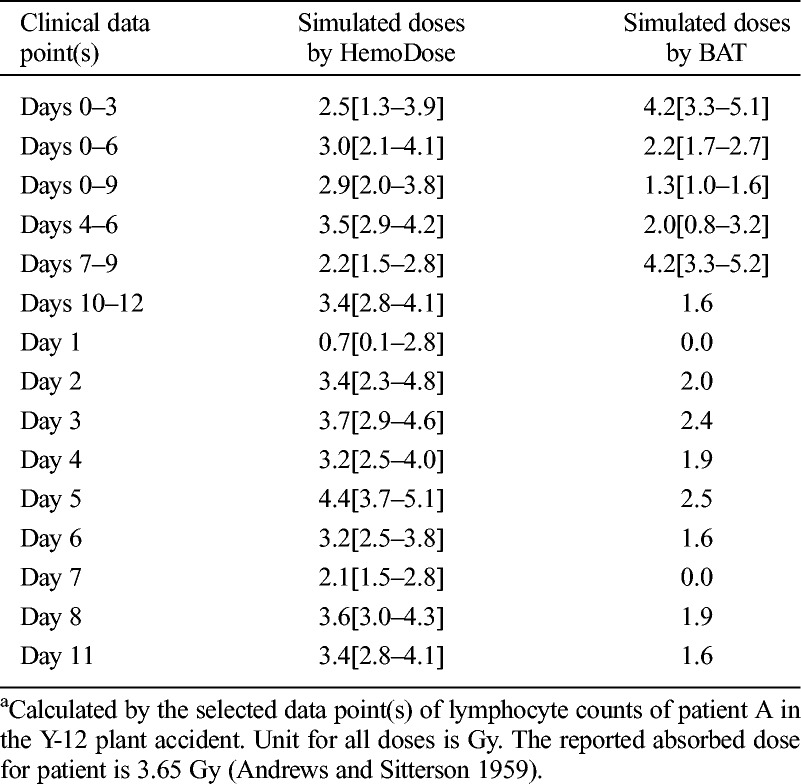
As the Biodosimetry Assessment Tool (BAT) is a widely recognized software tool with algorithms for radiation dose assessment based on single or serial lymphocyte counts (Blakely et al. 2001, 2005), a comparison is made on the predictive capability of the lymphocyte module of HemoDose and BAT. Table 6 reports the calculated doses for patient A of the Y-12 plant accident based on the reported single or serial lymphocyte counts. For clinical data from days 0–3 and 7–9, BAT’s estimated doses are rather close to the reported doses (i.e., 3.65 Gy). However, the calculated doses from other serial counts and single counts are not better than those estimated by HemoDose as compared with the reported dose. In addition, as the normal range of lymphocyte counts in a healthy adult is not taken into account with Guskova’s method implemented in BAT (Sandgren et al. 2010), the doses calculated from single counts (including those for the the fourth 3-d data, which contain only one data point) do not provide a 95% CI (Table 6). The algorithm of HemoDose allows the calculation to generate a 95% CI for both the single and serial blood cell counts, and all simulated doses except for the first day’s data point are consistently and reasonably close to the reported dose.
Table 6.
Comparison of the prediction capability of the lymphocyte module of HemoDose and AFFRI BAT programs.a
For delayed discovery events, the lymphocyte counts measured at 6 d after exposure have been used as a “rule of thumb” to estimate the absorbed doses as well as the severity of acute radiation syndrome by IAEA experts (IAEA 1998). As a proof of lag-time dosimetry, the lymphocyte module of HemoDose is tested by using the range of the tabulated lymphocyte counts as inputs (Table 7). It is clear that all of the simulated doses by HemoDose, from the pre-clinical phase to the lethal cases, are consistent with the affirmed doses by IAEA experts (Table 6).
Table 7.
Comparison of the estimated doses for delayed discovery events between the HemoDose calculation and IAEA experts affirmation (adapted from IAEA 1998).

Cytogenetic analysis is regarded as the “gold standard” for accurate diagnosis of radiation exposure (Waselenko et al. 2004). Though the results will not be available for 48 to 72 h after the sample has been submitted for analysis due to the need for incubation, the estimated doses by this method are usually consistent with other more sophisticated methods. For the recent Bulgaria accidents (Djounova et al. 2012; Gregoire et al. 2013), two laboratories [Institut de Radioprotection et de Ŝuret´e Nucléaire (IRSN), Paris, and National Centre of Radiobiology and Radiation Protection (NCRRP), Sofia] used the same protocol to perform cytogenetic analysis on the samples of five patients and got nearly the same results (Fig. 6). With the lymphocyte counts of days 2–7 and the specific baseline of the patients reported in Djounova et al. (2012), the estimated doses of five patients by HemoDose are consistent with the results of these two laboratories (Fig. 6). On the other hand, if the default reference count for lymphocytes (i.e., 2.0 G/L) is applied, the discrepancies of HemoDose estimation are generally larger. This indicates that a patient-specific baseline, if available, can improve the prediction power of HemoDose.
Fig. 6.
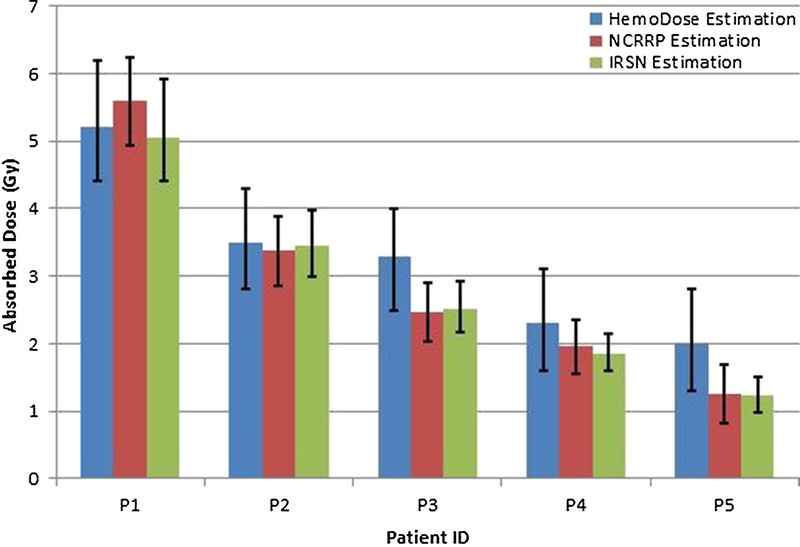
Comparison of estimated doses by HemoDose and cytogenetic method for five patients in the Bulgaria accident. The 95% confidence interval of each method was used to plot the error bars (Djounova et al. 2012). Same protocol of cytogenetic analysis was used in NCRRP and IRSN (Gregoire et al. 2013).
The blood cell counts have been used routinely as a reliable indicator for radiation injury in many previous delayed discovery events (Liu et al. 2008). However, the mechanism of their close correlation has not been systematically and rigorously investigated previously. It is evident that the approach applied in this work could facilitate further mechanism study of mammalian hematopoiesis response after radiation exposure.
DISCUSSION
Among the four models considered, the lymphopoiesis model performs the best for either serial counts or single point estimations. Due to the high sensitivity of all compartments of this lineage to radiation, the dynamics of lymphocyte counts after exposure follows a simple “hockey stick” pattern (Sandgren et al. 2010); i.e., an early exponential depletion followed by a slow recovering phase. The correlation between the absorbed doses and the time profile of lymphocyte counts has previously inspired researchers to formulate two empirical methods (i.e., Guskova’s method and Goans’ method), which form the basis of BAT algorithms (Blakely et al. 2005). An in-depth discussion has been presented before about the compatibility of the CGHC lymphopoiesis model and these empirical formulas (Hu et al. 2012). It is noteworthy to pay attention to the time frame restriction of applying these formulas. For example, Goans’ method is formulated based on the reported hematological data of the first 8 h or 2 d post-irradiation (Goans et al. 1997, 2001). The assumption of exponential depletion is apparently not valid after the initial phase. In addition, the rapid initial depletion phase is significantly shorter for high dose cases than for low dose cases. Based upon this observation, it will be problematic to use one formula to describe the lymphocyte response for a wide range of absorbed doses, which may also provide incorrect information for the severity of the hematopoiesis injury (Waselenko et al. 2004; Alexander et al. 2007). As the CGHC lymphopoiesis model characterizes the deviation of absolute lymphocyte counts from the beginning of infliction up to the whole range of clinical observation, the time frame from which the clinical data are derived is not essential to the accuracy of the diagnosis, though early data points (<7 d) are more reliable than later points.
Comparing with the lymphopoiesis model, the granulopoiesis and thrombopoiesis models are more reliable to characterize the cellular dynamics in the late phase (>15 d). The platelet counts are particularly valuable to estimate absorbed dose from single clinical data during the late phase (15–30 d). However, because the platelets are resistant to radiation and have a lifetime of about 10 d in blood, the decline of these cells during the early phase after radiation is slow and usually involves a wide shoulder (Fliedner et al. 2002). The data points in the early phase (<15 d) are therefore not quite predictive to estimate the severity of exposure. On the other hand, there is evidence that the magnitude of the initial granulocytosis is correlated with the absorbed doses (Fliedner et al. 2002). However, due to the lack of empirical data that can be considered with the granulopoiesis model, such a correlation has not yet been fully established. The dose-dependent granulocytosis is included in the updated model [Figs. 2 and 4 of this work, as compared with Fig. 4 in Hu and Cucinotta (2011)] and will be improved when more data sources are available. An interesting alternative approach is to consider the dynamics of the ratio of neutrophil/lymphocyte counts after exposure, which will take out the factor of inter-individual variations of the baseline and therefore generate more accurate dose estimation (Blakely et al. 2010).
Apparently, a simple adaptation of the granulopoiesis model to describe the radiation alternated dynamics of leukocytes has only achieved limited success. It appears that the contribution of monocyte cells cannot be ignored, which constitute 2–10% of all leukocytes in the human body. Though it is known that monocytes are produced by the bone marrow from hematopoietic stem cell precursors called monoblasts and circulate in the bloodstream for about 1 to 3 d and then move into tissues throughout the body, the cell kinetics as well as radiation response of this lineage have not been well studied. A further step to improve the leukopoiesis model would be taking the lymphocyte dose response into account, which can be achieved by simple superposition of the dynamics of lymphocytes onto that of the granulocytes. A well established leukocyte dose indicator will be useful, as in many places with poor medical resources, a differential white blood cell assay may not be feasible, but the total leukocyte count analysis is much easier to conduct (e.g., in Liu et al. 2008).
Limitations of note are the limited sources of accident victims’ data as well as the inherent variability and large statistical errors in various datasets. Another concern of HemoDose is the lack of consideration of age and gender-dependent factors. The current version assumes the baseline counts of three types of cells are those of healthy adults (age group 18–57 y) (Costongs et al. 1985). The introduction of age and gender-dependent parameters is currently being developed and will be reported in future work. Recent research implied that these baselines may be variant for groups of different ages and genders (Hirokawa et al. 2013). Particularly, the radiosensitivity parameters of the various cellular compartments for children and seniors are definitely different from the adults. The simulations of the three patients in the Henan accidents (Liu et al. 2008) demonstrate this problem, which can be run online as the data are stored at the web site. To be a useful biodosimetry tool in a radiology/nuclear disaster scenario, the application range of population of these models needs to be expanded to include all segments of the civilian population, especially the at-risk population such as children, pregnant women, senior citizens, and patients with illness or infection, etc. Further works are necessary to consider larger accident patient databases, such as SEARCH (Friesecke et al. 2000) and the U.S. Radiation Registry REAC/TS (Gusev et al. 2001).
Besides the hematological approach by using clinical parameters on which the algorithms of HemoDose and BAT are based, there are many other established and emerging dosimetry methods that can be used immediately and retrospectively to estimate the absorbed doses for radiation-exposed victims. These include the cytogenetic techniques such as the ‘gold standard’ dicentric chromosome assay; premature chromosome condensation; micronucleus assay and various FISH techniques (IAEA 2001); genetic techniques such as somatic mutations and gene expression assay (Meadows et al. 2008); protein biomarkers like γ-H2AX, C-reactive protein, and serum amylase (Guipaud and Benderitter 2009); physical dosimetry, such as the electron paramagnetic resonance, thermoluminescence, optically stimulated luminescence and nuclear activation; and various analytical and numerical dose reconstruction techniques (Ainsbury et al. 2011). However, due to the inherent limitations of each method and the vast challenges in most radiation accident scenarios, none of these methods can be used as a standalone tool to perform rapid and accurate dose assessment for the possibly hundreds of thousands of people in such events (Ainsbury et al. 2011). It is envisioned that the cheap, easy-to-use, and deployable methods such as HemoDose and BAT will play an essential role in the initial triage during such events, and other sophisticated techniques can be used as complimentary tools to further determine the accurate doses for the victims that need medical intervention or no-exposure assurance.
CONCLUSION
The above results demonstrate the predictive capability of HemoDose to assess radiation exposure severity. Since the early study of radiation effects, peripheral blood cell counts have been noted as bio-indicators of radiation injury, and quantitative correlation between the blood cell counts and absorbed doses has been hypothesized (Bond et al. 1965). The authors found that this can be elegantly formulated by the Smirnova’s approach, which uses a coarse-grained compartmental representation of the mammalian hematopoiesis system and an implicit regulatory mechanism. Testing with many data sets from some historical radiation accidents with HemoDose, it is established that either single or serial granulocyte, lymphocyte, leukocyte, or platelet counts after exposure can be robust indicators of the absorbed doses for the exposed individuals or groups. The blood cell assay is readily available, automated and inexpensive, and measurements take only a fraction of an hour for multiple samples. Therefore, these modeling tools can be used in combination with high throughput blood assay systems for rapid dose determinations in a large scale radiological disaster scenario. In addition, the present work indicates that correlation between the absorbed doses and victim's various types of blood cell counts exists not only in the early time window (1 or 2 d) but also in the late phase (up to 4 wk) after exposure, if the four types of blood cell counts are combined for analysis. This capability will be very useful to estimate the severity of exposure for delayed discovery events.
HemoDose can also serve as an alternative biodosimetry tool for space travelers in the case of large SPEs (Cucinotta and Durante 2006; Kim et al. 2009). Calculations based on actual solar particle observation indicate that some large historical SPEs may have induced moderate acute radiation sickness (ARS) in astronauts beyond low earth orbit (Hu et al. 2009). Mitigating the adverse biological effects of SPEs is one of the primary concerns of space agencies, as various types of ARS are known to immediately impair the performance capabilities of crew members and thereby threaten mission success (NCRP 2006). With the recent proposal of deployment of a hematology analyzer to the space vehicles (Crucian et al. 2013), it will be appropriate to apply HemoDose to monitor the severity of ARS of crew members in case the vehicles encounter a large SPE. Rapid radiation exposure information in such an adverse scenario is essential for the health and medical management team to respond promptly to apply pertinent countermeasures and ensure that the safety and performance of the crew members will not be imperiled. To improve the accuracy of HemoDose for SPEs, future work will consider track structure effects on the RBEs for different cell phase compartments and cell types and the role of combined SPE and galactic cosmic ray exposure, with additional considerations of the influence of microgravity on blood system responses.
Acknowledgments
The opinions or assertions contained herein are the private views of the authors and are not necessarily those of the Wyle Laboratories, the Armed Forces Radiobiology Research Institute, the Uniformed Services University of the Health Sciences, the University of Nevada, the U.S. Department of Defense, or National Aeronautics and Space Administration (NASA). We thank Alan H. Feiveson for proofreading our manuscript. This work was supported by NASA Space Radiation Risk Assessment Project and the University of Nevada, Las Vegas. We are thankful for many years of collaboration with Olga Smirnova.
Footnotes
The authors declare no conflicts of interest.
(Manuscript accepted 23 February 2015)
REFERENCES
- Ainsbury EA, Bakhanova E, Barquinero JF, Brai M, Chumak V, Correcher V, Darroudi F, Fattibene P, Gruel G, Guclu I, Horn S, Jaworska A, Kulka U, Lindholm C, Lloyd D, Longo A, Marrale M, Monteiro Gil O, Oestreicher U, Pajic J, Rakic B, Romm H, Trompier F, Veronese I, Voisin P, Vral A, Whitehouse CA, Wieser A, Woda C, Wojcik A, Rothkamm K. Review of retrospective dosimetry techniques for external ionising radiation exposures. Radiat Protect Dosim 147: 573– 592; 2011. [DOI] [PubMed] [Google Scholar]
- Alexander GA, Swartz HM, Amundson SA, Blakely WF, Buddemeier B. BiodosEPR-2006 meeting: acute dosimetry consensus committee recommendations on biodosimetry applications in events involving terrorist uses of radioactive materials and radiation accidents. Radiat Meas 42: 972– 996; 2007. [Google Scholar]
- Andrews GA, Sitterson BW. Hematologic effects of the accidental radiation exposure at Y-12. In: Brucer M, ed. The acute radiation syndrome, a medical report on the Y-12 accident June 16, 1958. Oak Ridge Institute of Nuclear Study Report No. ORINS-25; 1959: 2 1– 2. 17. [PubMed] [Google Scholar]
- Baranov AE, Guskova AK, Nadejina NM, Nugis V. Chernobyl experience: biological indicators of exposure to ionizing radiation. Stem Cells 13(Suppl 1): 69– 77; 1995. [PubMed] [Google Scholar]
- Blakely WF, Ossetrova NI, Whitnall MH, Sandgren DJ, Krivokrysenko VI, Shakhov A, Feinstein E. Multiple parameter radiation injury assessment using a nonhuman primate radiation model-biodosimetry applications. Health Phys 98: 153– 159; 2010. [DOI] [PubMed] [Google Scholar]
- Blakely WF, Prasanna PG, Grace MB, Miller AC. Radiation exposure assessment using cytological and molecular biomarkers. Radiat Protect Dosim 97: 17– 23; 2001. [DOI] [PubMed] [Google Scholar]
- Blakely WF, Salter CA, Prasanna PG. Early-response biological dosimetry—recommended countermeasure enhancements for mass-casualty radiological incidents and terrorism. Health Phys 89: 494– 504; 2005. [DOI] [PubMed] [Google Scholar]
- Bond VP, Fliedner TM, Archambeau JO. Mammalian radiation lethality. New York: Academic Press; 1965. [Google Scholar]
- Costongs GM, Janson PC, Bas BM, Hermans J, van Wersch JW, Brombacher PJ. Short-term and long-term intra-individual variations and critical differences of clinical chemical laboratory parameters. J Clin Chem Clin Biochem 23: 7– 16; 1985. [PubMed] [Google Scholar]
- Crucian B, Quiriarte H, Guess T, Ploutz-Snyder R, McMonigal K, Sams C. A miniaturized analyzer capable of white-blood-cell and differential analyses during spaceflight. Lab Med 44: 304– 312; 2013. [Google Scholar]
- Cucinotta FA, Durante M. Cancer risk from exposure to galactic cosmic rays: implications for space exploration by human beings. Lancet Oncol 7: 431– 435; 2006. [DOI] [PubMed] [Google Scholar]
- Dingli D, Traulsen A, Pacheco JM. Compartmental architecture and dynamics of hematopoiesis. PLoS One 2: e345; 2007. [DOI] [PMC free article] [PubMed] [Google Scholar]
- Djounova J, Guleva I, Negoicheva K, Mileva I, Panova D, Rupova I, Gigov I. Initial medical diagnosis of patients severely irradiated in the accident with 60Co in Bulgaria. Radiat Protect Dosim 151: 640– 644; 2012. [DOI] [PubMed] [Google Scholar]
- Fliedner T, Friesecke I, Beyrer K. Medical management of radiation accidents, manual on the acute radiation syndrome. The British Institute of Radiology: Plymouth, UK; 2001. [DOI] [PubMed] [Google Scholar]
- Fliedner TM, Graessle D, Meineke V, Dorr H. Pathophysiological principles underlying the blood cell concentration responses used to assess the severity of effect after accidental whole-body radiation exposure: an essential basis for an evidence-based clinical triage. Exp Hematol 35(Suppl 1): 8– 16; 2007. [DOI] [PubMed] [Google Scholar]
- Fliedner TM, Graessle D, Paulsen C, Reimers K. Structure and function of bone marrow hemopoiesis: mechanisms of response to ionizing radiation exposure. Cancer Biother Radiopharm 17: 405– 426; 2002. [DOI] [PubMed] [Google Scholar]
- Fliedner TM, Tibken B, Hofer EP, Paul W. Stem cell responses after radiation exposure: a key to the evaluation and prediction of its effects. Health Phys 70: 787– 797; 1996. [DOI] [PubMed] [Google Scholar]
- Friesecke I, Beyrer K, Wedel R, Reimers K, Fliedner TM. SEARCH: a system for evaluation and archiving of radiation accidents based on case histories. Radiat Environ Biophys 39: 213– 217; 2000. [DOI] [PubMed] [Google Scholar]
- Goans RE, Holloway EC, Berger ME, Ricks RC. Early dose assessment following severe radiation accidents. Health Phys 72: 513– 518; 1997. [DOI] [PubMed] [Google Scholar]
- Goans RE, Holloway EC, Berger ME, Ricks RC. Early dose assessment in criticality accidents. Health Phys 81: 446– 449; 2001. [DOI] [PubMed] [Google Scholar]
- Goans RE, Waselenko JK. Medical management of radiological casualties. Health Phys 89: 505– 512; 2005. [DOI] [PubMed] [Google Scholar]
- Gregoire E, Hadjidekova V, Hristova R, Gruel G, Roch-Lefevre S, Voisin P, Staynova A, Deleva S, Ainsbury EA, Lloyd DC, Barquinero JF. Biological dosimetry assessments of a serious radiation accident in Bulgaria in 2011. Radiat Protect Dosim 155: 418– 422; 2013. [DOI] [PubMed] [Google Scholar]
- Guipaud O, Benderitter M. Protein biomarkers for radiation exposure: towards a proteomic approach as a new investigation tool. Ann Ist Super Sanita 45: 278– 286; 2009. [PubMed] [Google Scholar]
- Gusev I, Guskova A, Mettler F. Medical management of radiation accidents. Boca Raton, FL: CRC Press; 2001. [Google Scholar]
- Guskova A, Baranov A, Gusev I. Acute radiation sickness: underlying principles and assessment. In: Gusev I, Guskova A, Mettler F, eds. Medical management of radiation accidents. Boca Raton, FL: CRC Press; 2001: 33– 51. [Google Scholar]
- Hirama T, Tanosaki S, Kandatsu S, Kuroiwa N, Kamada T, Tsuji H, Yamada S, Katoh H, Yamamoto N, Tsujii H, Suzuki G, Akashi M. Initial medical management of patients severely irradiated in the Tokai-mura criticality accident. Br J Radiol 76: 246– 253; 2004. [DOI] [PubMed] [Google Scholar]
- Hirokawa K, Utsuyama M, Hayashi Y, Kitagawa M, Makinodan T, Fulop T. Slower immune system aging in women versus men in the Japanese population. Immun Ageing 10: 19; 2013. [DOI] [PMC free article] [PubMed] [Google Scholar]
- Hu S, Cucinotta FA. Characterization of the radiation-damaged precursor cells in bone marrow based on modeling of the peripheral blood granulocytes response. Health Phys 101: 67– 78; 2001. [DOI] [PubMed] [Google Scholar]
- Hu S, Cucinotta FA. Modeling the depressed hematopoietic cells for immune system under chronic radiation. In: Peterson L, Masulli F, Russo G. Computational intelligence methods for bioinformatics and biostatistics. Berlin, Heidelberg: Springer; 2013: 26– 36. [Google Scholar]
- Hu S, Kim MH, McClellan GE, Cucinotta FA. Modeling the acute health effects of astronauts from exposure to large solar particle events. Health Phys 96: 465– 476; 2009. [DOI] [PubMed] [Google Scholar]
- Hu S, Smirnova OA, Cucinotta FA. A biomathematical model of lymphopoiesis following severe radiation accidents—potential use for dose assessment. Health Phys 102: 425– 436; 2012. [DOI] [PubMed] [Google Scholar]
- IAEA. Diagnosis and treatment of radiation injuries. Vienna: International Atomic Energy Agency; Safety Report Series No. 2; 1998. [Google Scholar]
- IAEA. Cytogenetic analysis for radiation dose assessment. A manual. Vienna: International Atomic Energy Agency; IAEA Technical Report Series; 2001. [Google Scholar]
- Kim MY, Hayat ML, Feiveson AH, Cucinotta FA. Using high-energy proton fluence to improve risk prediction for consequences of solar particle events. Advances Space Res 44: 1428– 1432; 2009. [Google Scholar]
- Kovalev EE, Smirnova OA. Estimation of radiation risk based on the concept of individual variability of radiosensitivity. Bethesda, MD: AFRRI; AFRRI Contract Report 96–1; 1996. [Google Scholar]
- Liu Q, Jiang B, Jiang LP, Wu Y, Wang XG, Zhao FL, Fu BH, Istvan T, Jiang E. Clinical report of three cases of acute radiation sickness from a (60)Co radiation accident in Henan Province in China. J Radiat Res 49: 63– 69; 2008. [DOI] [PubMed] [Google Scholar]
- Meadows SK, Dressman HK, Muramoto GG, Himburg H, Salter A, Wei Z, Ginsburg GS, Chao NJ, Nevins JR, Chute JP. Gene expression signatures of radiation response are specific, durable and accurate in mice and humans. PLoS One 3: e1912; 2008. [DOI] [PMC free article] [PubMed] [Google Scholar]
- NCRP. Information needed to make radiation protection recommendations for space missions beyond low-earth orbit. Bethesda, MD: NCRP; Report No. 153; 2006. [Google Scholar]
- REMM. Radiation emergency medical management [online]. 2014. Available at www.remm.nlm.gov/ars_wbd.htm. Accessed 8 August 2014.
- Sachs L. The control of hematopoiesis and leukemia: from basic biology to the clinic. Proc Natl Acad Sci USA 93: 4742– 4749; 1996. [DOI] [PMC free article] [PubMed] [Google Scholar]
- Sandgren DJ, Salter CA, Levine IH, Ross JA, Lillis-Hearne PK, Blakely WF. Biodosimetry Assessment Tool (BAT) software-dose prediction algorithms. Health Phys 99(Suppl 5): S171– 183; 2010. [DOI] [PubMed] [Google Scholar]
- Sine RC, Levine IH, Jackson WE, Hawley AL, Prasanna PG, Grace MB, Goans RE, Greenhill RG, Blakely WF. Biodosimety Assessment Tool: a post-exposure software application for management of radiation accidents. Mil Med 166(Suppl): 85– 87; 2001. [PubMed] [Google Scholar]
- Smirnova OA. Environmental radiation effects on mammals: a dynamical modeling approach. New York: Springer; 2011. [Google Scholar]
- Smirnova OA. Comparative analysis of the dynamics of thrombocytopoietic, granulocytopoietic, and erythropoietic systems in irradiated humans: a modeling approach. Health Phys 103: 787– 801; 2012. [DOI] [PubMed] [Google Scholar]
- Steinbach KH, Raffler H, Pabst G, Fliedner TM. A mathematical model of canine granulocytopoiesis. J Math Biol 10: 1– 12; 1980. [DOI] [PubMed] [Google Scholar]
- Swartz HM, Flood AB, Gougelet RM, Rea ME, Nicolalde RJ, Williams BB. A critical assessment of biodosimetry methods for large-scale incidents. Health Phys 98: 95– 108; 2010. [DOI] [PMC free article] [PubMed] [Google Scholar]
- UNSCEAR. UNSCEAR 1988 report to the general assembly with annexes. Effects and risks of ionizing radiation. New York: United Nations; 1988. [Google Scholar]
- Waselenko JK, MacVittie TJ, Blakely WF, Pesik N, Wiley AL, Dickerson WE, Tsu H, Confer DL, Coleman CN, Seed T, Lowry P, Armitage JO, Dainiak N. Medical management of the acute radiation syndrome: recommendations of the Strategic National Stockpile Radiation Working Group. Ann Intern Med 140: 1037– 1051; 2004. [DOI] [PubMed] [Google Scholar]
- Wichmann HE, Loeffler M. Mathematical modeling of cell proliferation: stem cell regulation in hemopoiesis. Boca Raton: CRC Press; 1985. [Google Scholar]


