

Abstract
Genetic epilepsy and neurodegenerative diseases are two common neurological disorders conventionally viewed as being unrelated. A subset of patients with severe genetic epilepsies with impaired development and often death respond poorly to anticonvulsant drug therapy, suggesting a need for new therapeutic targets. Previously, we reported that multiple GABAA receptor epilepsy mutations caused protein misfolding and abnormal receptor trafficking. Here we establish in a novel model of a severe human genetic epileptic encephalopathy, the Gabrg2+/Q390X knock-in mouse, that in addition to impairing inhibitory neurotransmission, mutant GABAA receptor γ2(Q390X) subunits accumulated and aggregated intracellularly, activated caspase 3 and caused widespread, age-dependent neurodegeneration. These novel findings suggest that the fundamental protein metabolism and cellular consequences of the epilepsy-associated mutant γ2(Q390X) ion channel subunit are not fundamentally different from those associated with neurodegeneration. The study has far-reaching significance for identification of conserved pathological cascades and mechanism-based therapies that overlap genetic epilepsies and neurodegenerative diseases.
Keywords: GABAA receptors, genetic epilepsy, γ2(Q390X) subunit mutation, γ2(Q351X) subunit mutation, protein accumulation/aggregation, caspase 3 activation, neuronal death, Gabrg2+/Q390X knock-in mouse, SUDEP
Introduction
Genetic epilepsies (GEs) are common neurological disorders that are associated frequently with ion channel gene mutations1. Although many GEs are relatively benign, there is a group of GEs, the epileptic encephalopathies including Dravet syndrome, which are associated with intractable seizures, impaired development, severe cognitive impairment and sudden death. It is not known, however, if the intractable seizures or some underlying progressive pathological processes are responsible for their clinical outcomes or if the clinical features of the epileptic encephalopathies are caused by the impaired channel function, the presence of intracellular mutant ion channel protein or both.
The epileptic encephalopathy, Dravet syndrome, has been shown to be associated with mutations in sodium channel (SCN1A, SCN2A, SCN1B)2–5 and GABAA receptor (GABRG26, 7, GABRA18) channel subunit genes. GABRG2(Q390X) is a mutation heterozygously associated with Dravet syndrome7 (note: the GABRG2(Q390X) mutation is also referred to as GABRG2(Q351X)7, 9, 10 when not including the 39 amino acid signal peptide). We have characterized extensively the cellular effects of this mutation in vitro9–11 demonstrating that, like many other truncated proteins, γ2(Q390X) subunits are nonfunctional. In addition, however, the subunits accumulated in the endoplasmic reticulum (ER) where they produced dominant negative suppression of the biogenesis and trafficking of wild-type subunits10. The γ2(Q390X) subunits dimerized quickly once translated9, accumulated and disturbed cellular hemostasis in a concentration-dependent manner11. It is well established that sustained ER stress leads to neurodegeneration12: however, the long-term cellular consequences of a misfolded mutant ion channel subunit associated with GE have not been addressed.
Here we generated a heterozygous Gabrg2+/Q390X knock-in (KI) mouse and compared it to a heterozygous Gabrg2+/− knock-out (KO) mouse that has loss of functional γ2 subunits without accumulation of the mutant subunits. The Gabrg2+/− mouse has been reported to have mild hyperanxiety13 and to have brief absence seizures only in mice with the seizure prone DBA2J genetic background14. In contrast, we found that Gabrg2+/Q390X mice had a severe epilepsy phenotype including spontaneous generalized tonic clonic seizures in mice with the seizure-resistant C57BL/6J background, suggesting that the mutation produced epilepsy by a mechanism(s) other than simple haploinsufficiency. Furthermore, we demonstrated that Gabrg2+/Q390X mice had increased mortality, reminiscent of sudden unexpected death in epilepsy (SUDEP) in humans. We compared the KI and KO mice functionally and biochemically and found that Gabrg2+/Q390X mice formed intraneuronal detergent-resistant, high molecular mass protein complexes containing γ2 subunits and displayed widespread caspase 3 activation and sporadic neuronal death in the mouse brain, especially in the cortex, that increased in severity with aging. This thus provides evidence that an epilepsy ion channel gene mutation directly causes chronic neurodegeneration in vivo, and the presence of neurodegeneration in addition to intractable seizures provides a possible explanation, at least in part, for several key features of epileptic encephalopathies including the bases for phenotypic severity, drug resistance, progressive course and poor outcome. The findings suggest that the protein metabolism of an ion channel epilepsy mutation is not fundamentally different from that associated with neurodegeneration, and thus drugs developed to treat neurodegeneration might be repurposed to treat severe genetic epilepsies by targeting the same mechanisms.
Results
Mutantγ2(Q390X) subunits areaggregation-prone
GABAA receptors are the major mediators of inhibitory neurotransmission in the brain and are primarily composed of 2α, 2β and 1γ subunits (Supplementary Fig. 1a). The GABRG2(Q390X) mutation was identified in two separate pedigrees with epilepsy including Dravet syndrome7 and produces a truncated subunit with loss of 78 C-terminal amino acids (Supplementary Fig. 1b). We used protein structure modeling of the wild-type and mutant γ2 subunits without the extracellular N-terminal domain to predict the potential consequences on structure of the mutant subunit For the mutant γ2(Q390X) subunit, the hydrophobic 4th transmembrane α-helix (YARIFFPTAFCLFNLVYWVSYLYL) was deleted, and a new α-helix with many charged amino acids (KDKDKKKKNPAPTIDIRPRSATI) was found to assume its location (Fig. 1a). The upper domain of the wild-type γ2 subunit is mainly hydrophobic (Fig. 1a, left panel green) and embedded in the membrane as a transmembrane domain, while the lower domain is hydrophilic and intracellular (Fig. 1a, left panel red). The mutant γ2(Q390X) subunit has more hydrophilic surface area than the wild-type subunit (Fig. 1b, left and middle panel) due to the new α-helix (KDKDKKKKNPAPTIDIRPRSATI) that was found to be unstable in the membrane, thus changing the subunit from a transmembrane protein to a globular cytosolic protein. The remaining hydrophobic surfaces in the α-helices of the mutant subunit were no longer in the membrane and were predicted to become “sticky” in solvent, i.e. the domains were predicted to bind to each other or to other proteins due to hydrophobic interactions. Based on a docking study for multiple interacting molecules, a number of relatively stable homo-dimer conformations may be formed as a result of non-specific self-interactions of mutant γ2 subunits (Supplementary Fig. 1c), and a number of non-specific hetero-dimer conformations may be formed between the mutant γ2 subunit and its wild-type partnering α1 subunit (Supplementary Fig. 1d). All of these subunit dimers were predicted to be stable.
Figure 1. The GABRG2(Q390X) mutation associated with the epileptic encephalopathy Dravet syndrome caused the mutant subunit to be aggregate prone and to accumulate intracellularly.

a, Predicted structural models. The left and middle panels show protein surfaces of wild-type γ2 and mutant γ2(Q390X) subunits, respectively, where green indicates hydrophobic residues and red shows hydrophilic (polar or charged) residues. The right panel shows the mutant and wild-type subunits superimposed with the same orientation as the left and middle panels (γ2 subunit in cyan/blue and γ2(Q390X) subunit in yellow/orange). The transmembrane 4 (TM4) α-helix (YARIFFPTAFCLFNLVYWVSYLYL) in the wild-type γ2 subunit and a new α-helix (KDKDKKKKNPAPTIDIRPRSATI) in the mutant γ2(Q390X) subunit are shown in highlight with edged representations. b, The Gabrg2+/Q390X KI mouse was constructed with insertion of a DraI restriction site in the mutant allele. c, Wild-type γ2 subunits or mutant γ2(Q390X) subunit monomers and oligomers were detected in lysates from HEK 293T cells coexpressing α1β2γ2 or α1β2γ2(Q390X) subunits (HEK), lysates from wild-type and KI mouse thalami (1 week), wild-type and Gabrg2+/Q390X mouse cortical membrane preparations (2 months) and immunopurified γ2 subunits from wild-type and KI mouse cortex (cxt) and cerebellum (cb) (~1 year). d, γ2(Q390X), but not γ2, subunits accumulated intracellularly in live α1β2γ2YFP (wt) or α1β2γ2(Q390X)YFP (mut) subunit-transfected HEK 293T cells (HEK) and COS-7 (COS) cells and γ2YFP or γ2YFP and γ2(Q390X)YFP subunit-transfected cultured rat cortical neurons. e. Image showing a coronal brain section of somatosensory cortex layers II–VI from a 16 month old wild-type mouse stained with anti-γ2 subunit (green) and anti-NeuN (red) antibodies and with To-pro-3 (blue). White line designates the approximate layers surveyed in g and h. f, g, Freshly prepared brain sections from 2–4 months old (f) or over 16 months old (g) wild-type and KI littermates were immunostained with anti-γ2 subunit antibody and visualized with Alexa-488 fluorophores (green) under confocal microscopy. The nuclei were stained with To-pro-3 (blue). h, Fluorescence intensities of γ2 subunits conjugated with Alexa-488 fluorophores in cortical brain sections from wild-type and heterozygous mice were quantified. (unpaired t test, p = 0.008 wt vs het for 2–4 months old, p < 0.0001 wt vs het for 16 months and 2–4 months vs 16 months (n = 5 for 5 pairs of mice; 5 independent experiments, error bars are s.e.m.) (** p < 0.01; ***p < 0.001 vs wt, §§§p < 0.001 vs 2–4 months old mice. In c, the red arrows designate the mutant γ2 subunit monomers, the green arrows designate the wild-type γ2 subunits and the blue arrows designate the mutant γ2 subunit aggregates. In f and g, the red arrows designate the somatic regions of individual cells.
The GABRG2(Q390X) mutation promoted intraneuronal accumulation of mutant γ2(Q390X) subunits in Gabrg2+/Q390X KI mice
To fully characterize the pathological basis for the epilepsy associated with the Q390X mutation, we generated the heterozygous Gabrg2+/Q390X KI mouse line with a standard gene targeting strategy (Fig. 1b). In both transfected HEK 293T cells and in brains from 1 week to 14 month old Gabrg2+/Q390X mice, mutant γ2(Q390X) subunits formed oligomers, likely dimers, tetramers and/or high molecular mass protein complexes on SDS-PAGE (Fig. 1c, blue arrows). The predicted molecular mass of the mutant γ2(Q390X) subunit was 40 KDa, (Fig. 1c, red arrows), and the full length wild-type γ2 subunit was about 50 KDa10 (Fig. 1c, green arrows). In HEK 293T and COS-7 cells cotransfected with α1, β2 and γ2(Q390X)YFP subunits and in cultured rat cortical neurons transfected with γ2YFP or γ2YFP and γ2(Q390X)YFP subunits alone, the mutant subunits accumulated intracellularly in the ER (Fig. 1d).
Immunohistochemical staining with anti γ2 subunit antibody indicated consistently that γ2 subunits accumulated in the cortex of 2 and 16 month old KI mice (Fig. 1e–g) as well as in P0 KI mice and in multiple brain regions including the cortex (Supplementary Fig 2.). The γ2 subunit fluorescence intensity was increased in cultured neurons (22.20 ± 0.97 vs 37.20 ± 2.5, n = 5 cultures, p = 0.0005, unpaired t test) as well as in Gabrg2+/Q390X mice at both 2–4 and 16 months old (Fig. 2h). In the brains of P0 mice, the γ2 subunit staining was also stronger in Gabrg2+/Q390X than in wild-type mice, and in cerebellum γ2 subunit staining was prominent in the Purkinje cells layer, which contains Purkinje cells and Bergmann glia cells (Supplementary Fig. 2). The increased γ2 subunits in the somatic regions in Gabrg2+/Q390X mice across different ages suggest that there was consistent ER retention of the mutant subunit protein.
Figure 2. Gabrg2+/Q390X KI mice had increased mortality both pre- and postnatally.

a, The wild-type γ2 subunit allele PCR product was 323 bp while the mutant γ2 subunit allele product was 405 bp due to the insertion of an 82 bp fragment as shown in the PCR image for genotyping. b, The distribution of each genotype for pups in mixed C57Bl/6J/129Svj (n = 7 litters, 58 pups) and C57Bl/6J (n = 8 litters, 69 pups) backgrounds was plotted. c, Mutant P0 pups were grossly normal. d, Sections of cerebral cortex including the hippocampal formation were stained with hematoxylin and eosin. e, A survival plot was obtained that showed the percentage of surviving mice with each genotype for 30 postnatal weeks (n = 51 for wt and 47 for het). Note that homozygous KI mice did not survive beyond P0 (asterisk).
Gabrg2+/Q390X KI mice had reduced viability
SUDEP is a significant concern for patients with epilepsy, especially those with frequent and severe seizures such as those associated with Dravet syndrome15. SUDEP has been characterized in the SCN1A KO mouse model of Dravet syndrome16, but the basis for SUDEP is still unclear. SUDEP could be due to brain driven cardiac dysfunction during seizures or to other non-cardiac mechanisms15, 17. Because the GABRG2(Q390X) mutation is associated with Dravet syndrome, we determined the mortality rate of heterozygous KI mice. We genotyped all mice by PCR of tail DNA (Fig. 2a), and included all of the retrieved dead pups. We found that heterozygous and homozygous KI mice were born with a reduced Mendelian ratio (Fig. 2b). Homozygous Gabrg2Q390X/Q390X mice, however, did not survive beyond the day of birth (Fig. 2e, asterisk), consistent with a previous report for homozygous Gabrg2+/− KO mice18. However, gross morphology of heterozygous and homozygous mice (Fig. 2c), and the cellular structure of heterozygous pup’s brains (Fig. 2d) appeared to be normal. Although viable, heterozygous mice had increased mortality throughout life (measured up to 30 weeks), and wild-type mice had minimal to no death over that time period (Fig. 2e). The increased death rate for heterozygous KI mice was likely related to severe generalized seizures consistent with our observation that several mice died after the occurrence of spontaneous generalized tonic clonic seizures during routine handling.
Gabrg2+/Q390X KI mice had spontaneous seizures and neurobehavioral comorbidities
We observed spontaneous generalized tonic clonic seizures in Gabrg2+/Q390X mice at 19 days old (Supplementary Fig. video showing a 19 day old heterozygous KI mouse with spontaneous generalized tonic clonic seizures and death). To characterize the seizure phenotype of heterozygous KI mice, we recorded synchronized video EEGs in mice. The EEGs demonstrated occurrence of spontaneous electrographic and behavioral seizures as well as interictal discharges (Fig. 3a, Supplementary Fig. 3). With blockade of GABAA receptors by pentylenetetrazol (PTZ; 50 mg/kg), heterozygous KI mice had lowered seizure threshold compared with wild-type littermates as demonstrated by early onset and increased percentage of clonic seizures and tonic hind limb extension (Fig. 3b, c). The reason we chose a lower dose of PTZ was due to the high mortality rate of Gabrg2+/Q390X mice at higher doses of PTZ (70 mg/kg or 85 mg/kg).
Figure 3. Gabrg2+/Q390X KI mice had severe seizures and behavioral comorbidities.
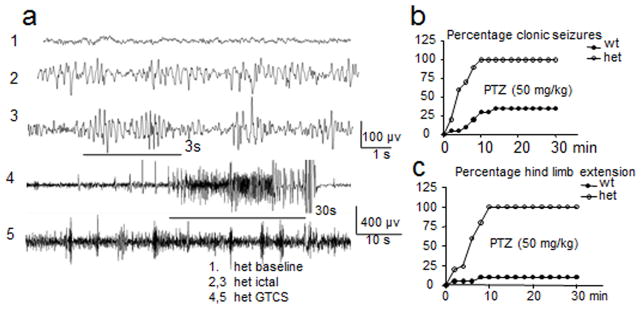
a, Representative EEG recordings show that the heterozygous (het) KI mice had interictal periods without (het baseline) or with (het ictal) epileptiform activity and had spontaneous generalized tonic clonic seizures with epileptiform discharges (het GTCS). b, c, KI mice had lowered seizure threshold with intraperitoneal pentylenetetrazol (PTZ) administration (50 mg/kg). After PTZ injection, KI mice in the C57BL/6J background (open circles) progressed more rapidly to (b) clonic seizures and hind limb extension (c) than wild-type (wt) mice (filled circles) (n = 20 mice for wt and 23 for het).
We then assessed potential behavioral comorbidities of epilepsy in Gabrg2+/Q390X mice. We performed the elevated zero maze (EZM) test and the open field (OF) test. In the EZM test, heterozygous mice spent significantly less time in the open arm (121.6 ± 6.46 vs 94.5± 3.67, n = 59 for wt and 57 for het, unpaired t test) and had reduced total entries into the open arm (16.24 ± 0.91 vs 13.39 ± 0.61, n = 59 for wt and 57 for het, unpaired t test). In the OF test, heterozygous KI mice had increased total distance travelled in the first 10 minutes (1245.4 ± 31.2 vs 1497.4 ± 54.1, n = 35 for wt and 47 for het, unpaired t test) but tended to be quiet and stayed in the corner of the chamber in the later time segments and had reduced time spent in the center (31.28 ±1.113 vs 19.77 ± 1.010, n = 35 for wt and 47 for het, p <0.0001, unpaired t test). We could not exclude the possibility that the heterozygous KI mice had behavioral arrest after they were habituated in the testing chamber during the later time segments of the one hour long test. This was consistent with the fact that the KI mice spent less time in the center resting (42.98 ± 2.58 (sec) vs 33.72 ± 2.42 (sec), n = 35 for wt and 47 for het, p = 0.012, unpaired t test) and more time in the periphery resting (81.06 ± 6.33 vs 106.4 ± 5.82, n = 35 for wt and 47 for het, p = 0.045, unpaired t test). Gabrg2+/Q390X mice had multiple phenotypes including spontaneous seizures, SUDEP, enhanced anxiety and deficits in social behaviors while Gabrg2+/− KO mice were reported to be seizure free13 or to only have absence epilepsy in a specific seizure prone genetic background14.
GABAergic mIPSC amplitude and frequency were reduced more in Gabrg2+/Q390X KI mice than in Gabrg2+/− KO mice
Gabrg2+/Q390X KI mice had severe epilepsy, increased mortality and neuropsychiatric comorbidities. By contrast, Gabrg2+/− KO mice were reported to be seizure free13 or to only have absence epilepsy, but not thermal seizures, in a specific seizure prone genetic background like DBA2J14. We next sought to determine if there was a difference in GABAergic synaptic strength between these animals. It is generally believed that a loss of function mutation such as a truncation mutation causes disease because of haploinsufficiency of the affected gene, and thus KO models have been widely used for studying human diseases19. We previously demonstrated in vitro that in addition to being nonfunctional, mutant γ2(Q390X) subunits suppressed the biogenesis and function of wild-type partnering subunits9. To determine the impact of mutant γ2(Q390X) subunits on GABAergic neurotransmission in KI mice, we recorded GABAergic mIPSCs in cortical layer VI neurons in age-matched Gabrg2+/Q390X and Gabrg2+/− KO mice20. The choice of cortical layer VI neurons was based on the involvement of thalamocortical circuitry in seizure generation and neurons in this layer as well as the layer IV receive direct projection of ventrobasal complex (VB) neurons21. Compared with wild-type mice, heterozygous KI mice had reduced mIPSC amplitudes (Fig. 4a, c) and frequency (2.94 ± 0.34 vs 1.69 ± 0.40, n = 16 cells from 11 slices from 7 mice for wt, n = 13 cells from 8 slices rom 6 mice for het, unpaired t test, p = 0.021), while there was no significant difference between wild-type and heterozygous KO mice in either amplitude (Fig. 4b, d) or frequency (3.61 ± 0.91 vs 2.58 ± 0.29, n = 8 cells from 6 slices from 5 mice for wt, n = 9 cells from 7 slices from 6 mice for het, unpaired t test, p = 0.28).
Figure 4. The GABAergic mISPCSs from Gabrg2+/Q390X KI mice were not equivalent to those from Gabrg2+/ − KO mice.
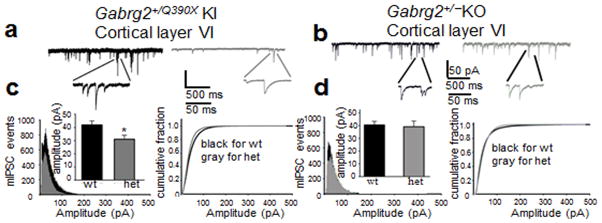
a, b, Representative traces of GABAergic mIPSCs from cortical layer VI pyramidal neurons from two month old wild-type (wt) and heterozygous (het) KI (a) or KO (b) mice. c, d, mIPSC amplitudes were plotted as a function of frequency of occurrence and amplitude (inserts) and in cumulative histograms for both het KI (c) and KO (d) mice. (For KI mice, n = 15 cells from 11 slices from 10 mice for wt and 11 cells from 8 slices from 8 mice for het, unpaired t test, p = 0.022 wt vs het; For KO mice, n = 8 cells from 6 slices from 5 mice for wt, n = 9 cells from 7 slices from 6 het mice, p = 0.966 wt vs het). Error bars are mean +/− s.e.m.,* p < 0.01 vs wt).
Although both Gabrg2+/Q390X KI and Gabrg2+/− KO mice both had loss of γ2 subunit function, biogenesis of the remaining wild-type partnering subunit differed between KI and KO mice
The reduced mIPSC amplitude and frequency in Gabrg2+/Q390X mice were likely due in part to the reduction of wild-type γ2 subunits but also secondarily to loss of α1 subunits as a consequence of reduced α1βγ2 receptors being assembled and trafficked to synapses. This is not surprising given the critical role of γ2 subunits in synaptic GABAA receptor maintenance and clustering22. Consistent with the electrophysiological recordings, biochemical studies demonstrated that total levels of both wild-type γ2 and α1 subunits were reduced in multiple brain regions including cortex in the KI mice (Fig. 5a, c, e, g and Supplementary Fig. 4 for full-length gels), while total levels of γ2 were reduced to a lesser extent and total levels of α1 subunits were unaltered in the age matched heterozygous KO mice (Fig. 5b, d, f, h and Supplementary Fig. 4 for full-length gels). Such results suggest more impaired neuronal inhibition in the KI than in the KO mice. The data also suggested that the mutant γ2(Q390X) subunits suppressed the biogenesis of their wild-type partnering subunits and wild-type γ2 subunits.
Figure 5. Gabrg2+/Q390X KI mice were not equivalent to Gabrg2+/− KO mice with respect to the remaining wild-type GABAA receptor subunit expression.

a–d, Lysates from different brain regions (cortex (cxt), cerebellum (cb), hippocampus (hip) and thal (thalamus)) from heterozygous (het) KO and KI mice were subjected to SDS-PAGE and immunoblotted with anti-γ2 subunit antibody (a, b) or anti-α1 subunit antibody (c, d). e–h, Integrated density values (IDVs) for total γ2 and α1 subunits from wild-type and het KI (e, g) or wild-type and het KO (f, h) mice were normalized to the Na+/K+ ATPase or anti-glyceraldehyde-3-phosphate dehydrogenase (GAPDH) loading control (LC) in each specific brain region and plotted. (In e–h, *p < 0.05; **p < 0.01; ***p < 0.001 vs wt. n = 5 pairs of mice for KI and 5 pairs of mice for KO, error bars are s.e.m. Full-length gels are presented in Supplementary Fig. 4. See Supplementary Methods checklist for full details of statistical tests.)
Younger Gabrg2+/Q390X KI mice had intraneuronal accumulation of γ2 subunits and reduced γ2 subunits at synaptosomes and the cell surface in cerebral cortex
Our in vitro study indicated that mutant γ2(Q390X) subunits failed to traffick to the cell surface10 and accumulated inside neurons. Here we demonstrated in Gabrg2+/Q390X mice that the staining of γ2 subunits was more intense in neuronal somata compared with the age and gender matched wild-type littermates at 6 months old (Fig. 6a–c). However, the fluorescence signal intensity in the whole field or non-somatic regions was reduced in the Gabrg2+/Q390X mice (Fig. 6a–c). The γ2 subunit puncta were colocalized with the inhibitory postsynaptic marker gephyrin. We further compared the distribution of the γ2 subunits in wild-type and heterozygous KI mice in synaptosomes or at the cell surface by subcellular fractionation or live brain slice surface biotinylation. The data demonstrated that the γ2 subunits were reduced in the synaptosomes (Fig. 6d, f and Supplementary Fig. 4 for the full-length gel) and at the cell surface (Fig. 6e, g and Supplementary Fig. 4 for the full-length gel). In summary, the data suggested that γ2 subunits in the synapses were reduced in spite of their accumulation in the neuronal somatic region.
Figure 6. Younger Gabrg2+/Q390X KI mice had increased γ2 subunit accumulation in neuronal somata, but reduced expression of γ2 subunits in synaptosomes and on the cell surface.

a, The brains from 6 month old wild-type and heterozygous (het) KI littermates were blocked, short fixed with 4% paraformaldehyde for 30 min and immersed in 30% sucrose overnight. The brain tissues were sectioned by cryostat at 15 μm and stained with rabbit anti-γ2 subunit antibody (green), mouse anti-gephyrin antibody (red) and cellular nucleus marker To-pro-3 (blue). The presented images were from cortex layers V–VI. b, An enlarged image from the wt overlay was used to illustrate the quantification of the fluorescent intensity values in somatic and non-somatic regions with ImageJ. The fluorescent intensities of the whole field, somatic or non-somatic regions were measured. c, The fluorescence intensity values in the nuclei were used as background values that were subtracted in each condition. The total fluorescence intensity values from the whole field and non-somatic regions were reduced but were increased in the somata in the het mouse brains. (p = 0.0048 for whole field, p = 0.0031 for somata, p = 0.0136 for nonsomata, n = 11 mice for wt and 12 mice for het, unpaired t test. d, f, The forebrains of 2–4 months old mice were subfractionated. Equal amounts of protein from nuclei and cell debris (p1), total cytosol (s1), cytosol and light membrane (s2) and synaptosomes (spm) were analyzed by SDS-PAGE and immunoblotted with anti-γ2 subunit antibody. The protein IDVs in each fraction were normalized to their own loading control (LC) Na+/K+ ATPase or β-Tubulin (p = 0.034 wt vs het spm, n = 4 pairs of mice, 4 independent experiments, unpaired t test). e, g, The surface proteins from the live mouse brain slices were biotinylated and analyzed by SDS-PAGE and immunoblotted with anti-γ2 subunit antibody (p = 0.011 for cor, p = 0.0088 for cb, p = 0.0154 for hip, p = 0.0007 for thal, n = 4 pairs of mice. One sample t test). (In c, f–g, *p < 0.05; **p < 0.01, *** vs wt. Error bars are s.e.m., See Supplementary Methods Checklist for full details of statistical tests. Full-length gels for d and e are presented in Supplementary Fig. 4.)
Older mutant Gabrg2+/Q390X KI mice had increased caspase 3 activation and cell death in the cerebral cortex
Although no in vivo evidence for neurodegeneration in genetic epilepsyhas been reported previously, in multiple neurodegenerative diseases it has been established that sustained accumulation and aggregation of mutant protein will lead eventually to neurodegeneration23–26. Thus, since the mutant γ2(Q390X) subunit was aggregation prone and relatively stable9, itssustained expression could lead to neurodegeneration. To determine neuronal apoptosis in heterozygous KI mice, we stained for γ2 subunits and cleaved caspase 3 in 1 year old mice (Fig. 7a, b). Cleaved caspase 3 has been used as a marker for cellular apoptosis because of its role in executing cell death27. In Gabrg2+/Q390X KI, but not wild-type, mice, increased cleaved caspase 3 staining and γ2 subunit accumulation were both present in the deep layers of the cortex (Fig. 7a, b). The intensity of both γ2 subunit and cleaved caspase 3 staining was higher in the neuronal somata of the mutant than in wild-type mice (Fig. 7f). Cleaved caspase 3 was mainly in the neuronal cytoplasm (Fig. 7c) and colocalized with γ2 subunits in what appeared to be aggregates (Fig. 7d). These cleaved caspase 3/γ2 subunit aggregates were absent in the old wild-type and young (2 month) KI mice. They were detectable in the 5–6 month old KI mice but were prominent in old (1 year or older) KI mice with neuronal loss in the cortex (Supplementary Fig. 5–8). Paraffin-embedded brain tissues were used here because the staining was focused on neuronal somatic regions. Synaptic proteins were poorly preserved in these tissues compared with those with short fixation (Figs. 1f–g, 6a–b and Supplementary Fig. 9).
Figure 7. Older Gabrg2+/Q390X KI mice had caspase 3 activation and neuronal death in the deep layers of cerebral cortex.

a, b, Brain sections from 1 year old wild-type (wt) and heterozygous (het) KI mice were stained with (a) rabbit anti-γ2 subunit antibody or (b) rabbit cleaved caspase 3. c–e, Similar sections were stained for cleaved caspase 3 (green) in combination with (c) mouse monoclonal neuronal marker NeuN (red) and cellular nuclei marker To-pro-3 (blue), (d) mouse anti-γ2 subunit (red) and cellular nuclei marker To-pro-3 (blue), or (e) NeuN (red) and cell death marker TUNEL (green). f, The γ2 subunit and cleaved caspase 3 protein density values in the cell somata were quantified using image J (p = 0.005 for γ2 subunit, p = 0.0161 for caspase 3 intensity, n = 12 sections from 7 mice for wt and n =11 sections from 7 mice for het., unpaired t test). (*p < 0.05; **p < 0.01 vs wt, n = 12 for wt and11 for het). g, The cleaved caspase 3 positive staining cells in the total cellular population, the cleaved caspase 3 positive staining in NeuN positive cells and the TUNEL positive cells in the NeuN expressing populations were quantified and plotted (p = 0.0301 for caspase 3, p < 0.0001 for caspase 3 + NeuN, P<0.0001 for TUNEL. n = 7 pairs of mice, unpaired t test. (In f–g,*p < 0.05; **p < 0.01 vs wt, ***p < 0.001 vs wt Error bars are s.e.m. See Supplementary Methods Checklist for full details of statistical tests.).
We also determined if the mutant γ2 subunit aggregates were associated with neuronal death. To do this, we performed TUNEL staining, and the percent of neurons with TUNEL positive staining in cortical layer V–VI neurons was higher in 1 year old heterozygous mice (Fig. 7e, g). It is believed that age is a risk factor for neurodegeneration and protein aggregation, and this concept has been well studied in neurodegenerative diseases caused by both genetic and environmental factors28–31. Our data are consistent with the studies of neurodegeneration; the older heterozygous mice had cleaved caspase 3 activation, cytoplasmic caspase 3/γ2 subunit positive aggregates and neuronal death while these features were not prominent in the younger Gabrg2+/Q390X mice (Supplementary Fig. 5–8, 10–12).
The activation of caspase 3 could be due to the accumulation of mutant γ2(Q390X) subunits independent of seizure activity
Although caspase 3 activation is a crucial event for neuronal death and an established feature of many neurodegenerative diseases32, caspase 3 activation can be caused by other neuronal activities33. We thus determined the level of caspase 3 activation in cultured neurons where no seizure activity was present. We demonstrated that more neurons were positively stained with caspase 3 in the neurons cultured from the heterozygous Gabrg2+/Q390X mice than from the wild-type mice (4.6 ± 1.7% vs 29.4 ± 6.7%, n = 4 cultures, p = 0.015, unpaired t test, Fig. 8a). In HEK 293T cells, we expressed wild-type γ2 or mutant γ2(Q390X) subunits with progressively increased cDNA amounts and found that the mutant γ2(Q390X) subunits had increased ER stress as evidenced by the upregulated expression of ER stress hallmark GADD153 (Fig. 8b, c). Interestingly, the wild-type γ2 subunits also increased ER stress with high amounts of transfected cDNA. This suggests that wild-type γ2 subunits also caused ER stress when assembly partners are lost and when they are present at high intracellular levels. The sustained ER stress would lead to cell death as evidenced by increased caspase 3 activation in the cells expressing the mutant γ2(Q390X) subunit. The expression level of caspase 3 in the cells expressing mutant γ2(Q390X) subunits was similar to the control cells treated with the apoptosis-inducer staurosporine (3 μM) for 4 hrs (Fig. 8d); in contrast, caspase 3 activation was not or only minimally present in the cells expressing wild-type γ2 subunits (Fig. 8e and Supplementary Fig. 4 for the full-length gel).
Figure 8. Increased ER stress and caspase 3 activation were detected in cells expressing mutant γ2(Q390X) subunits.

a, Hippocampal neurons from P0 wild-type and heterozygous (het) KI mice were grown in cell culture for three weeks, and neurons were stained with rabbit polyclonal anti-cleaved caspase 3 (green) and mouse monoclonal anti-γ2 subunit (red) antibodies (a). c, d, Lysates from HEK 293T cells expressing γ2 or γ2(Q390X) subunits with progressively increased cDNA concentrations were immunoblotted with either anti-γ2 subunit or the ER stress hallmark anti-GADD153 antibody with an Na+/K+ ATPase loading control (LC) (c), and the normalized GADD153 IDVs were plotted (*p < 0.05; **p < 0.01, ***p < 0.001 vs wt of the same cDNA amount, n = 4 different transfections. See Supplementary Methods Checklist for full details of statistical tests.) (d). e, f, HEK 293T cells were either untransfected (con) or transfected with γ2 (wt) or γ2(Q390X) (mut) subunits. The apoptosis inducer staurosporine (3 μM) was applied for 4 hrs as positive control (con + STS). The cells were harvested 2 days after transfection and analyzed by SDS-PAGE and immunoblotted by the anti-cleaved caspase 3 (e). The IDVs for each condition were normalized to the loading control Na+/K+ ATPase or β-tubulin and plotted (***p < 0.001 vs wt, n = 4 different transfections (f). (Error bars are s.e.m.. See Supplementary Methods Checklist for full details of statistical tests. Full-length gel for e is presented in Supplementary Fig. 4.)
Discussion
Dravet syndrome is an epileptic encephalopathy in which “the epileptic activity itself may contribute to severe cognitive and behavioral impairments above and beyond what might be expected from the underlying pathology alone (e.g., cortical malformation), and that these can worsen over time”34. However, the present work suggests that in addition to the disinhibition produced by substantial loss of functional γ2 subunits leading to epilepsy, the progressive behavioral changes and worsening epilepsy caused by the GABRG2(Q390X) mutation may also be due to neuronal dysfunction/neurodegeneration caused by the accumulation and aggregation of a truncated ion channel protein that increases cell stress and leads to chronic neurodegeneration.
There are no reports that the mutant protein associated with Dravet syndrome causes neurodegeneration. However, while not definitive, there are however several lines of evidence that neurodegeneration may occur in a subset of patients with GE. For example, a recent study of a brain specimen from a Dravet syndrome patient harboring the GABRG2(Q40X) mutation indicated that the mutant γ2 subunits formed protein aggregates, but the details of the aggregates are not available6. Our in vitro study indicated that mutant γ2(Q390X) subunits produced substantial protein aggregates while mutant γ2(Q40X) subunits were undetectable (Supplementary Fig. 13). In addition, a study using brain MRI in a large group of GE patients35 foundsignificantcortical atrophy, suggesting possible neuronal loss. A brain morphometry study in Dravet syndrome patients indicated global volume reductions of gray and white matter as well as a correlation between the intracranial volume reduction and increased age36. The lack of clear clinical evidence of an association of mutations in GE and neurodegeneration may be because epileptic encephalopathies occur in only a small subset of epilepsy patients and thus the relationship may possibly have been unrecognized. Also, the major cause of Dravet syndrome is SCN1A mutations, which may have a different pathophysiology than GABRG2 mutations.
In Dravet syndrome, altered neurotransmission and seizure phenotypes have been extensively characterized in an Scn1a KO mouse as well as in a nonsense mutation Scn1a KI mouse37, 38. However, no mutant protein was detected in Scn1a KI mice, suggesting haploinsufficiency. In the present study, we showed that truncated γ2(Q390X) subunits were produced, that they accumulated in neurons and that in older Gabrg2+/Q390X KI mice they formed sporadic protein aggregates in multiple brain regions. These findings are consistent with the wide spread expression of γ2 subunits in the brain39. We previously reported that mutant γ2(Q390X) subunits produced dominant negative suppression of wild-type partnering and wild-type γ2 subunits10, and had slow degradation and disturbed cellular homeostasis26. The current study provides the novel findings that an ion channel mutation associated with a severe GE results in activated caspase 3, protein aggregates andchronic neurodegeneration.
Gabrg2+/Q390X KI mice phenocopy the major symptoms of the human epileptic encephalopathy, Dravet syndrome, and the phenotypes of patients that heterozygously carry the mutation (See patient natural history in Online Methods for full details.).. Gabrg2+/Q390X KI mice had multiple forms of epilepsy, including generalized tonic clonic seizures, neuropsychiatric comorbidities, including increased anxiety and social deficits and SUDEP. However, we did not find a difference in motor coordination between control and mutant mice up to age 6 months as demonstrated by the rotarod test. This is in contrast to the findings that there was severe ataxia in heterozygous Scna1+/− KO mice at P2140. This suggests that there may be differences in the comorbidities between the severe epilepsies associated with an SCN1A mutation and a GABRG2 mutation.
Comparison of Gabrg2+/Q390X KI and Gabrg2+/− KO mice demonstrated that GABAergic neurotransmission in KI mice was not equivalent to the simple loss of one allele in KO mice. The difference in GABAergic neurotransmission between the KI and KO mice was likely due to differences in wild-type GABAA receptor subunit biogenesis. Gabrg2+/− KO mice only had a small reduction of γ2 subunits while α1 subunit expression was unchanged. In contrast, total expression of both α1 subunits and the remaining wild-type γ2 subunits in Gabrg2+/Q390X mice was reduced in all the major brain regions including cerebral cortex, cerebellum, hippocampus and thalamus compared to wild-type littermates and to the Gabrg2+/− KO mice. This dominant negative suppression of the wild-type subunits by γ2(Q390X) subunits is likely due to oligomerization of mutant γ2(Q390X) subunits with wild-type subunits, thus trapping the wild-type subunits in the ER. This likely explains in part why Gabrg2+/Q390X KI mice had a more severe epilepsy phenotype.
This study challenges the widely held belief that neurodegeneration does not occur in GEs. Much effort has been directed to identify neuronal death in different animal models of epilepsy eg, pilocarpine, kainic acid kindling and thermal animal models41. However, these are models of acquired, not genetic, epilepsies. The cellular environment in Gabrg2+/Q390X mice is different than in the external stimulus-induced seizure models because the mutation is present from conception. We demonstrated that the KI mice had intraneuronal γ2 subunit/caspase 3 protein aggregates and had caspase 3 activation and chronic neurodegeneration, although these features were not present in younger mice expressing the mutant subunit. The reduction of neuronal number was 15% in the somatosensory cortex in the old KI mice as marked by neuronal marker NeuN. However, sporadic neuronal death was observed in multiple brain regions including cortex, hippocampus, thalamus and cerebellum. In a given neuron, its viability and caspase 3 activation were likely correlated with the abundance of γ2(Q390X) subunits. We have previously demonstrated that ER-retained trafficking-deficient γ2 subunits produce ER stress11. It is possible that the activated caspase 3 also alters synaptic activity since caspase 3 is required for the refinement of neuronal circuits during development that involves selective elimination of axons, dendrites and synaptic connections32, 33. However, it should be noted that while mutant γ2 subunits accumulated in neurons of mice at all ages, the neuronal death in the KI mice was highly variable, chronic and subject to substantial developmental impact being only evident in the older mice. The identification of mutant protein aggregation in Gabrg2+/Q390X KI mice has far reaching implications for both disease classifications and therapeutic strategies. Although GE and neurodegenerative diseases are two conventionally unrelated disease entities, this study suggests that the mutant protein metabolism and the engaged signaling pathways like caspase 3 activation may be similar in both disorders. Therefore the therapeutic developments in neurodegeneration and other diseases with similar mechanisms could be repurposed to treat epilepsy by targeting the same signaling pathways.
ONLINE METHODS
The natural history of Dravet syndrome patients with the GABRG2(Q390X) mutation
The GABRG2(Q390X) mutation is associated with two small pedigrees of Dravet syndrome. One pedigree was reported by Harkin et al.,7. The other patient was identified by our U.K. collaborator Dr. Mark Rees.
The history of the patient in Harkin’s report has been mentioned in two papers7,42. In Harkin’s paper7, the patient’s history was documented as “The patient had had a severe phenotype of GEFS+, which was initially regarded as MAE, but further history showed she had SMEI. She had multiple clonic seizures affecting the right upper limb, associated with fever at age 3 months. She had many such focal febrile seizures, as well as afebrile GTCS. But she did not have convulsive status epilepticus. Absence, myoclonic, and atonic seizures began at age 3–4 years. Myoclonus involving both upper limbs was prominent on examination and was exacerbated with lamotrigine. From age 17 years, she had continuous irregular myoclonus of her right upper limb; by age 22 years, she had 1–2 GTCS/year and 1–2 absence seizures. EEGs became more active over time and showed frequent paroxysms of irregular generalized polyspike-wave activity brought out by photic stimulation. MRI was normal. Early motor developmental milestones were normal, but speech was delayed. Neuropsychological assessment at age 14 years placed her in the moderately intellectually disabled range, without lateralizing features.”
In Jansen’s paper42, the patient was reported when she was 26 years old. Her age of seizure onset was 3 months. She first had febrile seizures, then she had TCS, myoclonic seizures (MS), absence seizures (AS), complex partial seizures (CPS) and tonic seizures (TS). Her diagnosis is SMEI. She had TCS, CPS and AS when she was at 26 years old. Motor signs were not present. In Jansen’s paper, MRI scans were available in 10 patients. Unilateral hippocampal atrophy was noted in 2, generalized atrophy in 2 and 6 were normal. However, the authors did not specify which mutation had brain atrophy. To our knowledge, this is the only study that reports the natural history of Dravet syndrome with the GABRG2(Q390X) mutation.
The history of the patient identified by Dr. Mark Rees was unclear because the finding has not been published. However, per our communication with Dr. Rees, the child was very cognitively impaired and had refractory seizures but other information was not available.
Mice
The Gabrg2+/Q390X KI mouse was generated in collaboration with the Macdonald laboratory and Dr. Siu-Pok Yee at University Connecticut Health Center. Briefly, genomic DNA containing Gabrg2 was retrieved from the BAC, RP23-233N1, which was generated using DNA isolated from C57BL/6J mice. The targeting vector was prepared by recombineering as described43. The targeting vector containing the 5′ long arm, which included exon 8, was approximately 5 kb followed by the LoxP-PGK-neo-LoxP cassette and exon 9 with the Q390X point mutation, which comprised the 3kb 3′ short arm. A DraI restriction endonuclease site was engineered into the mutant Gabrg2 allele to help distinguish the mutant from the wild-type allele. Targeted mice were bred with Hprt-Cre mice to remove the PGK-neo cassette to generate the mutant KI mouse. The targeting vector containing the 5′ arm, which includes exon 8, is approximately 5 kb followed by the LoxP-PGK-neo-LoxP cassette and exon 9 with the Q390X (C1165T) point mutation, which comprise the 7kb 3′ arm. The vector was linearized by NotI digestion prior to electroporation into ES cells, which was derived from F1 (C57BL/6J/129Svj) embryo. After electroporation into ES cells and G418 and Ganc selection, the targeted ES clones were identified by using long range PCR followed by PCR/sequencing to confirm the presence of the C1165T point mutation. Chimeric mice were generated by morula<->ES cell aggregation and then bred with Hprt-Cre mice to remove the PGK-neo cassette and screened for germline transmission.
The primer pairs flanking the LoxP site for genotyping were gtF 5′-ATGGCGATGGAAGTTGACA and gtR: 5′-TGATGTTGCTCATGCCTCTC. The PCR fragment for the wild-type allele was 323 bp while the fragment for the mutant allele was 405 bp. The Gabrg2+/− KO mouse line was provided by Dr. Bernard Luscher (Penn State University)18. The mice used for biochemistry, immunohistochemistry and electrophysiology studies were from mixed C57BL/6J/129Svj background. The mice used for EEG recordings and neurobehavioral experiments were congenic lines and were bred into C57Bl/6J mice for at least 8 generations. All behavioral tests were done blind to mouse genotype with age matched littermates.
Animal pairing and data acquisition for biochemistry study
All wild-type and mutant mice from the heterozygous Gabrg2+/Q390X KI and Gabrg2+/− KO lines used for biochemistry were gender matched littermates from each line. There was no sharing of wild-type mice between KI and KO lines. The wild-type and mutant mice were paired before the experiments. All the experiments were run in parallel. Each pair of wild-type and mutant KI or KO mice were sacrificed at the same time, the samples were prepared at the same time, samples from the four brain regions (cortex, cerebellum, hippocampus and thalamus) of each pair were run at the same time in the same gel. Each data point for wild-type and mutant mice were from the same membrane, and the protein of interest was normalized to the loading control Na+/K+-ATPase or GAPDH band from the same membrane each time.
Plasmid and antibodies
The human γ2(Q390X) and γ2(Q390X)YFP subunit plasmids were described in a previous study10. Rabbit polyclonal anti-γ2 subunit antibody (224–003, 1:300) was purchased from Synaptic System. Mouse monoclonal anti-γ2 subunit antibody used in Figure 7d was a gift provided by Dr. Suchitra Joshi from Dr. Jedeep Kapur in Department of Neurology, University of Virginia, Health Sciences Center, Charlottesville, Virginia) (1:50). The specificity of this antibody has been validated by Dr. Kapur’s laboratory, and the antibody is commercially available 44. Mouse monoclonal anti α1(N95/35) (1:1000) was from the University of California Davis/National Institutes of Health NeuroMab Facility. Rabbit anti-cleaved caspase 3 (9664S, 1:300) was from Cell Signaling Technology. The mouse monoclonal anti-neuronal nuclei (NeuN) antibody was from Millipore (MAB377, 1:100) or from Abcam (ab 104224, 1:100). The rabbit polyclonal anti-Er81 (AB10554, 1:100) and Trb1 (b81086) antibodies were from Millipore or Abcam. The mouse monoclonal GADD153 (AB11419, 1:100) antibody was purchased from Abcam. The rabbit anti-Calbindin D-28K antibody (CB38, 1:200) was from Swant. For protein loading internal controls, mouse monoclonal anti-Na+/K+ATPase α subunit (a6F, 1:1000) was from the Developmental Studies Hybridoma Bank, and the rabbit polyclonal GAPDH antibody (AB9485, 1:2000) was from Abcam. Mouse monoclonal β-Tubulin antibody (T8328, 1:500) was from Sigma. The fluorescently conjugated goat anti rabbit-680 (926–32221) and goat anti mouse-800 (926–32210) secondary antibodies were from LI-Cor (1:10,000).
Brain slice immunohistochemistry
We used brain sections both with the conventional paraffin embedding method and with the short fixation protocol to preserve the postsynaptic proteins45. TUNEL staining was performed with the TACS 2 TdT-Fluor in situ apoptosis detection kit from Trevigen following the manufacturer’s instructions and as performed in a previous study46, 47.
For freshly prepared brain tissues, mice were not perfused, and the brains were directly blocked and shortly fixed in 4% paraformaldehyde for 30 min and then maintained in 30% sucrose before sectioning on cryostat. The brains were sectioned at 15 μm. The sectioned tissues were stored at −20° before staining and discarded after 1 month. For paraffin embedded brain tissue preparations, mice were transcardially perfused with a fixative of 2% paraformaldehyde, 2% glutaraldehyde, and 0.2% picric acid in 0.1 M sodium phosphate, pH 7.2, and the brains were postfixed in 4% paraformaldehyde overnight at 4°C. The brains were preserved in 70% ethanol for 2 hrs and blocked and then processed by the Vanderbilt Pathology core with the standard procedure in the core. Paraffin embedded tissues were sectioned at 5 μm using a microtome and stored at room temperature. The sectioned brain slices were mounted on Superfrost Plus slides for histochemical and immunohistochemical studies. The brain slices were routinely deparaffinized, rehydrated and antigen retrieved for 10 min at 95° C. The slices were then blocked for endogenous peroxidase activity with 3% H2O2 solution for 10 min, permeabilized with 0.4% triton for 10 min and blocked with 0.2%/0.2% BSA/Triton for 1 hr followed by immunoreaction with specifically targeted antibodies overnight. The slices were then gently washed with 0.1% BSA/PBA three times before incubating with secondary antibodies. The slices were then processed with gradient alcohol (75%, 95% and 100%) and rinsed with the hydrophobic clearing agent xylene for 2 min twice and DAB reaction before being sealed with coverslips or directly sealed with ProLong Gold antifade mounting medium (Molecular Probes) for slices with fluorophore conjugated antibodies. The nuclei were either counterstained with hematoxylin for bright microscopy or with Topro-3 (1:500) for fluorescence microscopy.
Immunohistochemistry related quantifications
For all γ2 subunit and caspase 3 protein intensity measurements, raw values of the protein intensity in the somatic region were measured in ImageJ. A total 10–12 randomly chosen non-overlapping fields from 3 consecutive sections per mouse were measured each time. All the neurons were included in each field. The mean value was taken as n = 1 for each mouse. If the staining was with fluorophore-conjugated secondary antibodies, the nuclear region of the same cells was used as background because the boundary of the nuclei was relatively clear. If the staining was for light microscopy with DAB, the adjacent neuropil region was used as background because the boundary of the nuclei was not as clear. The protein intensity value of the somatic region for each cell was equal to the value of the somatic region subtracting the background value. In Figure 6C, the non-somatic fluorescence density value was the direct measurements of the neuropil region. The cell counting for caspase 3, calbindin D-28K and TUNEL positive cells as well as the NeuN positive cells co-labeled with cortical layers V or VI markers Er81 and Trb1 were quantified based on our previous study47. The mean positive staining was determined by counting 10–12 non-overlapping fields in specific layers in brain sections or in randomly chosen fields in cultures under 63X objective. The 10–12 non-overlapping fields were from 3 sections in each mouse or 3 dishes for each genotype in cultures for each experiment. The counts of 3 sections or 3 dishes were averaged and taken as n = 1. For the quantifications of the protein intensity in the somatic region in the immunohistochemistry, ImageJ was used.
Digital histology and unbiased cell counting
For the brain sections with good representation of somatosensory cortex zone 1 and 2 (S1-2), we used the interaural 2.22 mm, Bregma 1.58 mm reference point based on the mouse brain atlas and cut 6–8 rostral sections at intervals of 5 μm from each mouse brain for the assay in cortex, hippocampus and thalamus. We prepared the cerebellar sections separately. The mouse brains were cut sagittally across the midline and 6–8 consecutive sections at intervals of 5 μm were prepared parasagittally starting from the midline in the right hemisphere. The images were acquired automatically by computer, and the image processing parameters were determined by the core personnel who were blind to mouse genotype. All the images were scanned at 20X and viewed with 7X. The total number of 5 × 105 μm2 in somatosensory cortex were quantified manually by a person blind to genotype or by MetaMorph software. The cell counts of the 6–8 consecutive sections were averaged and taken as one of 5 pairs of mice.
Subcellular fractionation and isolation of synaptosomes
The procedures of subcellular fractionation were modified from a previous study48. Briefly, after quickly removing the brains, regions of interest were dissected and homogenized in pre-chilled homogenization HEPES buffered sucrose buffer (HBS containing 0.32 M sucrose, 10 mM HEPES, pH 7.4, 2mM EDTA) with a ratio of 10 ml buffer:1 g of brain tissue (each mouse brain is around 0.4g) with 10–15 strokes. The homogenates were then spun down at 1000 g for 10 min to remove the cell debris and nuclei. The pellet was taken as P1. The supernatant was taken as S1, and S1 was centrifuged at 13,800 g for 20 min. The S1 pellet was taken as P2, and the supernatant was taken as S2. S2 was the combination of cytosol and light membranes, while P2 was crude synaptosomal fraction. P2 was resuspended with HBS buffer at 1:10 ratio and centrifuged at 13,800 g for 15 min (for wash). The washed pellet was then mixed with 9X vol ice cold H2O-protease inhibitors. After rapidly adjusting to 4 mM HEPES by using 1M HEPES (pH 7.4), the P2 suspension was then rotated for 30 min at 4°C, followed by spinning at 25,000 g for 20 min. The pellet was taken as P3 and resuspended by adding 1.5 ml HBS buffer followed by discontinuous gradient sucrose ultracentrifuge. An equal volume (2.2 ml) of sucrose with different concentrations (1.4 M, 1.2 M, 1.0 M to 0.8 M) was added from bottom to top in the tube. The sample (1.5 ml) of P3 was added to the top of the sucrose layers. The sucrose tube containing the sample of P3 was then centrifuged at 150,000 g for 1 hr, and then each layer of interest was carefully collected and stored at −80°C. The synaptosome layer (spm) was at 1.0/1.2 M sucrose interface.
Live brain slice biotinylation
The protocol was based on a previous study20. Briefly, the brain slices were incubated for 45 min at 4°C in aCSF that contained 1 mg/ml of the membrane-impermeable, biotinylation reagent, sulfosuccinimidyl-2-(biotinamido)-ethyl-1,3′-dithiopropionate (Sulfo-NHS-SS-biotin; Thermo Scientific). After biotinylation, the slices were washed with 0.1 M glycine in aCSF. The cortices were dissected based on the region of interest and sonicated in radioimmunoprecipitation assay (RIPA) solution (20 mM Tris, pH 7.4, 1% Triton X-100, 250 mM NaCl) that also contained protease inhibitor mixture (1:100, Sigma-Aldrich), 0.5% deoxycholate and 0.1% SDS.
Brain slice preparation and recording
Recordings of GABAergic mIPSCs were obtained from layer VI somatosensory cortex neurons in brain slices as previously described20. Coronal brain slice sections (300 μm) were made using a vibratome in ice-cooled solution containing (in mM) 214 sucrose, 2.5 KCl, 1.25 NaH2PO4, 0.5 CaCl2, 10 MgSO4, 24 NaHCO3, and 11 D-glucose, pH 7.4 bubbled with 95%O2/5%CO2 at 4°C. Slices were then incubated in oxygenated artificial cerebrospinal fluid (ACSF) at 36°C for 30 min. After this, slices were kept at room temperature for at least 1 hr before recording on a Nikon Eclipse FN-1 IR-DIC microscope at room temperature. Pipette internal solution contained (in mM): 135 CsCl, 10 EGTA, 10 HEPES, 5 ATP-Mg, and QX-314 (5 mM) (pH 7.25, 290–295 mOsm), and recording micropipette resistances were 2 – 4 MΩ. Whole-cell patch clamp recordings were made at room temperature from layer VI pyramidal neurons in SI/II somatosensory cortex visualized with an upright Nikon eclipse FN-1 IR-DIC microscope. Neurons in the layer above the white matter with a typical apical dendrite and large soma (smaller than the layer V neuronal somata) were chosen for recordings. Data were collected using a MultiClamp 700B amplifier with compensation for series resistance (70%) and cell capacitance. Data were filtered at 2 kHz and digitized at 20 kHz using a Digidata 1440A AD converter.
Synchronized EEG recordings and analysis
Synchronized video EEGs were recorded from 8 week to 4 month old C57BL/6J mice one week after electrode implantation and recorded with synchronized EEG monitoring system from Pinnacle Technology based on previous study49. Briefly, mice were anesthetized with 1–3% isoflurane and four epidural electrodes (stainless steel screws affixed to one head mount) were placed on the brain surface and secured in place with dental cement and surgical stiches. EMG leads were inserted into the trapezius muscle. Mice were allowed to recover from the EEG head mount implantation surgery for one week before EEG recording. Video-EEG monitoring lasted for 24–48 hrs, and mice were freely moving during EEG recordings. Mouse behaviors such as behavioral arrest, myoclonic jerks or generalized tonic clonic seizures during the EEG recordings were identified to determine if mice exhibit behavioral seizures. At least 24 hours of baseline EEG recordings were obtained and analyzed for each mouse.
Open field test
Open field test was performed based on the standard protocol in Vanderbilt Neurobehavior core. Briefly, each individual mouse was placed into an open field activity chamber (Med Associates, 27 × 27 × 20.3 cm) that contained within light- and air-controlled environmental chambers for 60 min. Location and movement were detected by the interruption of infrared beams by the body of the mouse (16 photocells in each horizontal direction, as well as 16 photocells elevated 4cm to measure rearing) and were measured by the Med Associates Activity Monitoring program. Total distance traveled and time resting in center (50% of area) and peripheral zone were measured. The open field arena was cleaned with 70% ethanol and wiped with paper towels between each trial.
Elevated zero maze test
The elevated zero maze is a modification of the elevated plus maze used for assessing anxiety-related behaviors. The elevated circular platform (40 cm off the ground, 50 cm in diameter) had two enclosed arenas opposite each other (5 cm wide with 15 cm high walls) and two open arenas (5 cm wide). Briefly, each mouse was lowered by its tail into the open arena of the maze and allowed to explore the maze for 300 s. The whole circular platform was cleaned with 70% ethanol and wiped with paper towels between each animal. Activity of the mouse was monitored via an overhead camera connected to a computer in a separate room using video acquisition and ANY-maze analysis software (Stoelting, Wood Dale, IL). Data analyzed included time spent in the open versus closed arms, the number of entry in the open arms.
Protein structure prediction and docking
We used MUFOLD50 to predict the protein structures. The docking was performed by symmetric docking of SymmDock between two γ2 subunits and by general docking of PatchDock between the γ2 and α1 subunits51. Chimera (UCSF Chimera--a visualization system for exploratory research and analysis52) was used to display the protein structures.
Statistical analysis
IDVs were quantified by using the Quantity One or Odessy fluorescence imaging system (Li-Cor). The fluorescence intensity values were quantified by using ImageJ. Data were expressed as mean ± S.E.M values and analyzed with Graphpad Prism 5.0 software. Statistical significance of immunoblot and cell imaging data was determined by two-way ANOVA with Bonferroni posttests, a Student’s unpaired t test or, if appropriate, single-value t test. For the comparison of GABAergic mIPSC electrophysiology data, a Kolmogorov-Smirnov test was used to determine the cumulative probabilities, the distribution of wild-type and the mutant mIPSC peak amplitudes. The behavioral data was analyzed by a distribution-free Mann-Whitney U test as well as Student’s t test. No statistical methods were used to pre-determine sample sizes, but our sample sizes are similar to those reported in previous publications 10, 19–20. Data distribution was assumed to be normal, but this was not formally tested. All analyses used an alpha level of 0.05 to determine statistical significance.
Supplementary Material
Supplementary Figure 1. A docking model suggests that truncated γ2(Q390X) subunits are prone to aggregate and form dimers with themselves or other partnering subunits that are potentially stable.
a, b, Cartoons illustrate α1β2γ2 pentamers (a) and the protein topology of wild-type γ2 and mutant γ2(Q390X) subunits (b). c, Top 5 docking models for potential mutant γ2 subunit homodimers predicted by SymmDock are shown. In each panel, the two γ2 subunit chains are shown in red and green. d, Top 5 docking models of potential complexes between the mutant γ2 subunit (shown in green) and its wild-type partnering α1 subunit (shown in red) predicted by PatchDock are shown.
Supplementary Figure 2. Mutant γ2(Q390X) subunits accumulated in cortex and cerebellum in P0 Gabrg2+/Q390X KI mice.
Brains from P0 wild-type and KI mouse littermates (C57BL/6J strain) were paraffin embedded, sectioned at 5 μm and stained with rabbit anti-γ2 subunit antibody and visualized with DAB. The sections were counterstained with hematoxylin, and the equivalent areas in the cortices of both wt and heterozygous (het) KI mice were imaged under light microscopy. Large red boxes indicated the posterior lobe of the cerebellum (bottom).
Supplementary video. Gabrg2+/Q390X KI mice had generalized tonic clonic seizures and sudden death after seizures.
A 19 day old KI mouse had spontaneous generalized seizures during handling (tailing). The mouse was found dead the next day, reminiscent of SUDEP in epilepsy patients.
Supplementary Figure 3. EEGs were obtained from wild-type and Gabrg2+/Q390X KI littermates in the C57BL/6J background.
Representative EEG recordings from a two month old wild-type mouse in the C57BL/6J background demonstrated no epileptiform activity (1) while its mutant littermate had ictal discharges (3). The boxed areas in 1 and 3 were expanded and illustrated in 2 and 4.
Supplementary Figure 4. Full length gels.
Full-length gels for images are presented in Figures 5a–d, 6d–e, 8e and supplementary Figure 10. The boxed region in each gel is the image presented in each corresponding figure. The colored image is shown for those gels with double colored protein molecular weight standards. White boxed regions are designated regions for protein of interest while purple boxed regions are for loading control. In Figure 5a, 5c and Figure 6e, the loading control is in the same gel for protein of interest.
Supplementary Figure 5. Representative images showing that mutant γ2(Q390X) subunits formed caspase 3 positive aggregates in old, but not young, mice.
a, Images from cortices of 1 year old wild-type (wt) and heterozygous (het) KI littermates. The brains were paraffin embedded and stained with mouse anti-γ2 subunit antibody (red), rabbit cleaved caspase 3 (green) and cellular nucleus marker To-pro-3 (blue). b, The cortices of 1 year old wt and 2 month, 5 month and 1 year old het KI littermates were stained with rabbit cleaved caspase 3.
Supplementary Figure 6. Representative images showing that there was neuronal loss in cortical layers V and VI in the older Gabrg2+/Q390X KI mice.
a, b, Images from cortices of 18 month old wild-type (wt) and heterozygous (het) KI mouse littermates (C57BL/6J as well as in C57/BL/6J/S129/SvJ background). The brain sections were from paraffin embedded or short fixed tissues and stained with mouse anti-NeuN and rabbit anti-Er81 antibodies, the cortical layer V marker (Er81) (a) or rabbit anti Trb1, a layer VI marker, (b). To-pro-3 (blue) was used to stain cellular nuclei in both a and b. c, The average numbers of cells costained with NeuN and Er81 or with NeuN and Trb1 were reduced in the het mice. (Unpaired t test, p = 0.2071 for Er81+NeuN, p = 0.0318 for Tbr1+NeuN, n = 5 pair of mice from 14–18 months old) (* p < 0.05; vs wt).
Supplementary Figure 7. Representative images showing that there was neuronal loss in the somatosensory cortex in the older Gabrg2+/Q390X KI mice.
a, Images are presented showing a coronal brain section from a 16 month old heterozygous (het) KI mouse stained with anti-γ2 subunit (green), anti-NeuN (red) and To-pro-3 (blue) and the brain regions we surveyed for neuronal loss. (b). Enlarged image of cortex from a to demonstrate the cortical layers. c, d, The brain sections were from paraffin embedded tissues and stained with mouse anti-NeuN (c) or anti-NeuN and cellular nucleus marker To-pro-3 (blue) (d). e, The average number of cells stained with NeuN were reduced in the cortex in the het mice. (unpaired t test, p = 0.03 for cortex I–II/III, p = 0.0012 for cortex IV–VI, p = 0.0226 for thal). f, The average number of cells stained with To-pro-3 or NeuN were unchanged in the dentate gyrus (DG), CA1 and CA3 regions in the het mice. To-pro-3 positive cells were quantified in DG because the cells were packed, and it was difficult to distinguish cell boundaries with the NeuN staining used in hippocampus (unpaired t test, p = 0.3590 for dg, p = 0.3924 for CA1, p = 0.7008 for CA3). g, for unbiased tissue imaging and cell counting, 6–8 consecutive brain sections from each mouse were prepared, the images were acquired automatically by computer and the core personnel who was blind to the mouse genotype. The images were scanned at original magnification of 20X, the images were viewed at 7X and the total cell numbers were measured per 5×10⁵ um2 in the somatosensory cortex S1-2 region. For each mouse, the 6–8 consecutive sections were averaged and taken as n = 1 of 5 pairs. (Unpaired t test, p = 0.0074). (* p< 0.05; ** p< 0.01 vs wt, n = 5 pair of mice from 14–18 months old.).
Supplementary Figure 8. Representative images showing Purkinje neurons in the cerebellum in the older Gabrg2+/Q390X KI mice.
a, Image showing the sagittal section of cerebellum in the 16 month old heterozygous (het) KI mouse stained with anti-γ2 subunit (green), anti-NeuN (red) and To-pro-3 (blue). The white boxed region represented the area we surveyed for Purkinje cell loss, which was between cerebellar lobule VII–VIII. b, Enlarged image of the surveyed cerebellum region in c and d stained with anti-calbindin D-28K (green) and anti-NeuN (red) antibodies and with To-pro-3 (blue). We costained the cerebellar tissue with both anti-NeuN and anti-Calbindin D-28K antibody because we found that NeuN did not label Purkinje neurons well. c, Cerebellar sections from wild-type and het mice stained with mouse anti-NeuN (red) and anti-Calbindin D-28K. (d). The lobule VII in either wt or het cerebellar cortex was surveyed under 63X objective. The cell counts of the 6–8 consecutive sections were averaged and taken as one of 5 pairs of mice. Average numbers of cells stained with Calbindin D-28K were quantified (unpaired t test, p = 0.0515, n = 5 pair of mice from 14–18 months old.).
Supplementary Figure 9. Representative image showing that short fixed wild-type mouse brain tissues had good preservation of GABAA receptor γ2 subunit protein.
The image above shows the immunostaining of γ2 subunits (green) in the hippocampal CA1 region of a three month-old wild-type mouse with the short fix (30 min in 4% PFA) method. The blue staining in the image above is the nucleus marker, Topro-3. The γ2 subunit distribution pattern was similar to that of γ2YFP subunits in live cultured hippocampal neurons in the paper Figure 1f–g and Figure 6a–b.
Supplementary Figure 10. The old Gabrg2+/Q390X KI mice had increased caspase 3 expression.
The lysates of cytosolic fration from forebrain tissues of wild-type (wt) and heterozygous (het) KI littermates were fractionated by SDS-PAGE and immunoblotted with rabbit polyclonal anti-active caspase 3. LC stands for NA+/K+ATPase internal loading control. The full-length gel is provided in Supplementary fig. 4.
Supplementary Figure 11. Representative images showing no difference in caspase 3 expression in young wild-type and Gabrg2+/Q390X KI mice.
a, The brain sections from P0 old mice were stained with anti-caspase 3 (active form) antibody, and the nuclei were counterstained with hematoxylin. b, The caspase 3 positive cells in different brain regions were quantified. There was more positive caspase 3 staining in P0 old pups than in adult mice probably due to active neuronal pruning and apoptosis during early brain development (two way ANOVA and Bonferroni posttests, P>0.05 for all brain regions. Error bars are s.e.m. See Supplementary Mehods Checklist for full details of statistical tests.).
Supplementary Figure 12. Representative images showing that increased caspase 3 activation in the old mutant Gabrg2+/Q390X KI mice was likely due to mutant subunit accumulation.
a, Cortical brain sections from 1 year old mice were stained with anti-γ2 subunit (right panel) or anti-caspase 3 (left panel) antibodies, and nuclei were counterstained with hematoxylin. b, The caspase 3 positive cells in the cortex from mice at different ages were quantified. There were caspase 3 positive cells in the older KI mice but not in the young KI mice compared to the wild-type mice. There was more positive caspase 3 staining in P0 pups than in adult mice probably due to active neuronal pruning and apoptosis during early brain development (two way ANOVA and Bonferroni posttests, p>0.05 for p0, P>0.05 for 2–4 months, P>0.05 for 5–6 months, P<0.001 for ~12 months. Error bars are s.e.m. See Supplementary Mehods Checklist for full details of statistical tests.)..
Supplementary Figure 13. The GABRG2(Q390X) mutation produced more mutant subunit protein aggregates than the GABRG2(Q40X) mutation.
Total lysates from HEK 293T cells untransfected (con) or transfected with wild-type γ2 and two mutant γ2 subunits (Q40X and Q390X) alone associated with Dravet syndrome (DS) were analyzed by SDS-PAGE. The membrane was immunoblotted with rabbit polyclonal anti γ2 subunit antibody. LC stands for Na+/K+ ATPase loading control. There was much more mutant γ2(Q390X) subunit total protein than wild-type γ2 or mutant γ2(Q40X) subunit total protein in HEK 293T cells expressing the equal amounts of wild-type or mutant cDNAs.
Acknowledgments
Research was supported by grants from Citizen United for Research in Epilepsy (CURE), Dravet syndrome foundation (DSF), Dravet.org which is previously named IDEAleague, Vanderbilt Clinical and Translation Science Award and NINDS R01 NS082635 to J.Q.K, NINDS R01 NS51590 to R.L.M and R01 GM100701 to D.X, NICHD Grant No. P30HD15052 to Vanderbilt Kennedy Center. Thanks to the Vanderbilt Translational Pathology core for the service in tissue preparation and immunostaining and Dr. Kelli Boyd for consultation on immunohistochemistry. Thanks to Kelienne Marie Verdier and Dr. Aurea Pimenta for animal husbandry, Zhong Liu and Dr. John Allison for assistance in neurobehavioral tests and Shuai Zeng for computational assistance. Thanks to Dr. Suchitra Joshi in Dr. Jadeep Kapur’s lab at University of Virginia School of Medicine for providing mouse monoclonal anti-γ2 subunit antibody. Thanks to Dr. Lily Wang at Vanderbilt University, Department of Biostatistics for providing consultation on statistics and Dr. Ty Abel at Vanderbilt University, Department of Pathology for consultation on stereology and cell counting
Footnotes
Author Contributions J.Q.K. and R.L.M. conceived the project, and J.Q.K. designed experiments, performed experiments; analyzed the data; coordinated the study; supervised the project and wrote the manuscript. R.L.M. supervised the animal breeding to develop the congenic wild-type and mutant strains. W.S. collected the biochemical data and helped on colony maintenance, genotyping and tissue preparation. Z.C. collected and analyzed the electrophysiology data. X.D. performed the protein modeling and wrote the protein modeling part of the paper. R.L.M. supervised the project, critically reviewed the data and edited the manuscript. All authors discussed the results and commented on the manuscript.
Supplementary Information is available in the online version of the paper.
A Supplementary Methods Checklist is available.
Reference List
- 1.Noebels JL. Exploring new gene discoveries in idiopathic generalized epilepsy. Epilepsia. 2003;44(Suppl 2):16–21. doi: 10.1046/j.1528-1157.44.s.2.4.x. [DOI] [PubMed] [Google Scholar]
- 2.Heron SE, et al. De novo SCN1A mutations in Dravet syndrome and related epileptic encephalopathies are largely of paternal origin. J Med Genet. 2010;47:137–141. doi: 10.1136/jmg.2008.065912. [DOI] [PubMed] [Google Scholar]
- 3.Shi X, et al. Missense mutation of the sodium channel gene SCN2A causes Dravet syndrome. Brain Dev. 2009;31:758–762. doi: 10.1016/j.braindev.2009.08.009. [DOI] [PubMed] [Google Scholar]
- 4.Patino GA, et al. A functional null mutation of SCN1B in a patient with Dravet syndrome. J Neurosci. 2009;29:10764–10778. doi: 10.1523/JNEUROSCI.2475-09.2009. [DOI] [PMC free article] [PubMed] [Google Scholar]
- 5.Ogiwara I, et al. A homozygous mutation of voltage-gated sodium channel beta(I) gene SCN1B in a patient with Dravet syndrome. Epilepsia. 2012;53:e200–e203. doi: 10.1111/epi.12040. [DOI] [PubMed] [Google Scholar]
- 6.Ishii A, et al. Association of nonsense mutation in GABRG2 with abnormal trafficking of GABAA receptors in severe epilepsy. Epilepsy Res. 2014;108:420–432. doi: 10.1016/j.eplepsyres.2013.12.005. [DOI] [PubMed] [Google Scholar]
- 7.Harkin LA, et al. Truncation of the GABA(A)-receptor gamma2 subunit in a family with generalized epilepsy with febrile seizures plus. Am J Hum Genet. 2002;70:530–536. doi: 10.1086/338710. [DOI] [PMC free article] [PubMed] [Google Scholar]
- 8.Carvill GL, et al. GABRA1 and STXBP1: Novel genetic causes of Dravet syndrome. Neurology. 2014 doi: 10.1212/WNL.0000000000000291. [DOI] [PMC free article] [PubMed] [Google Scholar]
- 9.Kang JQ, Shen W, Lee M, Gallagher MJ, Macdonald RL. Slow degradation and aggregation in vitro of mutant GABAA receptor gamma2(Q351X) subunits associated with epilepsy. J Neurosci. 2010;30:13895–13905. doi: 10.1523/JNEUROSCI.2320-10.2010. [DOI] [PMC free article] [PubMed] [Google Scholar]
- 10.Kang JQ, Shen W, Macdonald RL. The GABRG2 mutation, Q351X, associated with generalized epilepsy with febrile seizures plus, has both loss of function and dominant-negative suppression. J Neurosci. 2009;29:2845–2856. doi: 10.1523/JNEUROSCI.4772-08.2009. [DOI] [PMC free article] [PubMed] [Google Scholar]
- 11.Kang JQ, Shen W, Macdonald RL. Trafficking-deficient mutant GABRG2 subunit amount may modify epilepsy phenotype. Ann Neurol. 2013 doi: 10.1002/ana.23947. [DOI] [PMC free article] [PubMed] [Google Scholar]
- 12.Haynes CM, Titus EA, Cooper AA. Degradation of misfolded proteins prevents ER-derived oxidative stress and cell death. Mol Cell. 2004;15:767–776. doi: 10.1016/j.molcel.2004.08.025. [DOI] [PubMed] [Google Scholar]
- 13.Crestani F, et al. Decreased GABAA-receptor clustering results in enhanced anxiety and a bias for threat cues. Nat Neurosci. 1999;2:833–839. doi: 10.1038/12207. [DOI] [PubMed] [Google Scholar]
- 14.Reid CA, et al. Multiple molecular mechanisms for a single GABAA mutation in epilepsy. Neurology. 2013;80:1003–1008. doi: 10.1212/WNL.0b013e3182872867. [DOI] [PMC free article] [PubMed] [Google Scholar]
- 15.Hirsch LJ, et al. Abbreviated report of the NIH/NINDS workshop on sudden unexpected death in epilepsy. Neurology. 2011;76:1932–1938. doi: 10.1212/WNL.0b013e31821de7de. [DOI] [PMC free article] [PubMed] [Google Scholar]
- 16.Kalume F, et al. Sudden unexpected death in a mouse model of Dravet syndrome. J Clin Invest. 2013;123:1798–1808. doi: 10.1172/JCI66220. [DOI] [PMC free article] [PubMed] [Google Scholar]
- 17.Glasscock E, Yoo JW, Chen TT, Klassen TL, Noebels JL. Kv1.1 potassium channel deficiency reveals brain-driven cardiac dysfunction as a candidate mechanism for sudden unexplained death in epilepsy. J Neurosci. 2010;30:5167–5175. doi: 10.1523/JNEUROSCI.5591-09.2010. [DOI] [PMC free article] [PubMed] [Google Scholar]
- 18.Gunther U, et al. Benzodiazepine-insensitive mice generated by targeted disruption of the gamma 2 subunit gene of gamma-aminobutyric acid type A receptors. Proc Natl Acad Sci U S A. 1995;92:7749–7753. doi: 10.1073/pnas.92.17.7749. [DOI] [PMC free article] [PubMed] [Google Scholar]
- 19.Yu FH, et al. Reduced sodium current in GABAergic interneurons in a mouse model of severe myoclonic epilepsy in infancy. Nat Neurosci. 2006;9:1142–1149. doi: 10.1038/nn1754. [DOI] [PubMed] [Google Scholar]
- 20.Zhou C, et al. Altered cortical GABAA receptor composition, physiology, and endocytosis in a mouse model of a human genetic absence epilepsy syndrome. J Biol Chem. 2013;288:21458–21472. doi: 10.1074/jbc.M112.444372. [DOI] [PMC free article] [PubMed] [Google Scholar]
- 21.Donoghue JP, Ebner FF. The laminar distribution and ultrastructure of fibers projecting from three thalamic nuclei to the somatic sensory-motor cortex of the opossum. J Comp Neurol. 1981;198:389–420. doi: 10.1002/cne.901980303. [DOI] [PubMed] [Google Scholar]
- 22.Alldred MJ, Mulder-Rosi J, Lingenfelter SE, Chen G, Luscher B. Distinct gamma2 subunit domains mediate clustering and synaptic function of postsynaptic GABAA receptors and gephyrin. J Neurosci. 2005;25:594–603. doi: 10.1523/JNEUROSCI.4011-04.2005. [DOI] [PMC free article] [PubMed] [Google Scholar]
- 23.Bucciantini M, et al. Inherent toxicity of aggregates implies a common mechanism for protein misfolding diseases. Nature. 2002;416:507–511. doi: 10.1038/416507a. [DOI] [PubMed] [Google Scholar]
- 24.Bence NF, Sampat RM, Kopito RR. Impairment of the ubiquitin-proteasome system by protein aggregation. Science. 2001;292:1552–1555. doi: 10.1126/science.292.5521.1552. [DOI] [PubMed] [Google Scholar]
- 25.Williams AJ, Paulson HL. Polyglutamine neurodegeneration: protein misfolding revisited. Trends Neurosci. 2008;31:521–528. doi: 10.1016/j.tins.2008.07.004. [DOI] [PMC free article] [PubMed] [Google Scholar]
- 26.Berke SJ, Paulson HL. Protein aggregation and the ubiquitin proteasome pathway: gaining the UPPer hand on neurodegeneration. Curr Opin Genet Dev. 2003;13:253–261. doi: 10.1016/s0959-437x(03)00053-4. [DOI] [PubMed] [Google Scholar]
- 27.Yang DS, et al. Neuronal apoptosis and autophagy cross talk in aging PS/APP mice, a model of Alzheimer’s disease. Am J Pathol. 2008;173:665–681. doi: 10.2353/ajpath.2008.071176. [DOI] [PMC free article] [PubMed] [Google Scholar]
- 28.Dillin A, Cohen E. Ageing and protein aggregation-mediated disorders: from invertebrates to mammals. Philos Trans R Soc Lond B Biol Sci. 2011;366:94–98. doi: 10.1098/rstb.2010.0271. [DOI] [PMC free article] [PubMed] [Google Scholar]
- 29.Douglas PM, Dillin A. Protein homeostasis and aging in neurodegeneration. J Cell Biol. 2010;190:719–729. doi: 10.1083/jcb.201005144. [DOI] [PMC free article] [PubMed] [Google Scholar]
- 30.Balch WE, Morimoto RI, Dillin A, Kelly JW. Adapting proteostasis for disease intervention. Science. 2008;319:916–919. doi: 10.1126/science.1141448. [DOI] [PubMed] [Google Scholar]
- 31.Ross CA, Poirier MA. Protein aggregation and neurodegenerative disease. Nat Med. 2004;10(Suppl):S10–S17. doi: 10.1038/nm1066. [DOI] [PubMed] [Google Scholar]
- 32.D’Amelio M, Sheng M, Cecconi F. Caspase-3 in the central nervous system: beyond apoptosis. Trends Neurosci. 2012;35:700–709. doi: 10.1016/j.tins.2012.06.004. [DOI] [PubMed] [Google Scholar]
- 33.Li Z, et al. Caspase-3 activation via mitochondria is required for long-term depression and AMPA receptor internalization. Cell. 2010;141:859–871. doi: 10.1016/j.cell.2010.03.053. [DOI] [PMC free article] [PubMed] [Google Scholar]
- 34.Berg AT, et al. Revised terminology and concepts for organization of seizures and epilepsies: report of the ILAE Commission on Classification and Terminology, 2005–2009. Epilepsia. 2010;51:676–685. doi: 10.1111/j.1528-1167.2010.02522.x. [DOI] [PubMed] [Google Scholar]
- 35.Betting LE, et al. MRI reveals structural abnormalities in patients with idiopathic generalized epilepsy. Neurology. 2006;67:848–852. doi: 10.1212/01.wnl.0000233886.55203.bd. [DOI] [PubMed] [Google Scholar]
- 36.Perez A, et al. Brain morphometry of Dravet Syndrome. Epilepsy Res. 2014;108:1326–1334. doi: 10.1016/j.eplepsyres.2014.06.006. [DOI] [PubMed] [Google Scholar]
- 37.Ogiwara I, et al. Nav1.1 localizes to axons of parvalbumin-positive inhibitory interneurons: a circuit basis for epileptic seizures in mice carrying an Scn1a gene mutation. J Neurosci. 2007;27:5903–5914. doi: 10.1523/JNEUROSCI.5270-06.2007. [DOI] [PMC free article] [PubMed] [Google Scholar]
- 38.Ogiwara I, et al. Nav1.1 haploinsufficiency in excitatory neurons ameliorates seizure-associated sudden death in a mouse model of Dravet syndrome. Hum Mol Genet. 2013;22:4784–4804. doi: 10.1093/hmg/ddt331. [DOI] [PMC free article] [PubMed] [Google Scholar]
- 39.Laurie DJ, Wisden W, Seeburg PH. The distribution of thirteen GABAA receptor subunit mRNAs in the rat brain. III Embryonic and postnatal development. J Neurosci. 1992;12:4151–4172. doi: 10.1523/JNEUROSCI.12-11-04151.1992. [DOI] [PMC free article] [PubMed] [Google Scholar]
- 40.Kalume F, Yu FH, Westenbroek RE, Scheuer T, Catterall WA. Reduced sodium current in Purkinje neurons from Nav1.1 mutant mice: implications for ataxia in severe myoclonic epilepsy in infancy. J Neurosci. 2007;27:11065–11074. doi: 10.1523/JNEUROSCI.2162-07.2007. [DOI] [PMC free article] [PubMed] [Google Scholar]
- 41.Zeng LH, Rensing NR, Wong M. The mammalian target of rapamycin signaling pathway mediates epileptogenesis in a model of temporal lobe epilepsy. J Neurosci. 2009;29:6964–6972. doi: 10.1523/JNEUROSCI.0066-09.2009. [DOI] [PMC free article] [PubMed] [Google Scholar]
- 42.Jansen FE, et al. Severe myoclonic epilepsy of infancy (Dravet syndrome): recognition and diagnosis in adults. Neurology. 2006;67:2224–2226. doi: 10.1212/01.wnl.0000249312.73155.7d. [DOI] [PubMed] [Google Scholar]
- 43.Lee MW, Chang AC, Sun DS, Hsu CY, Chang NC. Restricted expression of LUZP in neural lineage cells: a study in embryonic stem cells. J Biomed Sci. 2001;8:504–511. doi: 10.1007/BF02256613. [DOI] [PubMed] [Google Scholar]
- 44.Joshi S, Sun C, Kapur J. A mouse monoclonal antibody against the gamma2 subunit of GABAA receptors. Hybridoma (Larchmt ) 2011;30:537–542. doi: 10.1089/hyb.2011.0035. [DOI] [PMC free article] [PubMed] [Google Scholar]
- 45.Notter T, Panzanelli P, Pfister S, Mircsof D, Fritschy JM. A protocol for concurrent high-quality immunohistochemical and biochemical analyses in adult mouse central nervous system. Eur J Neurosci. 2014;39:165–175. doi: 10.1111/ejn.12447. [DOI] [PubMed] [Google Scholar]
- 46.Chong ZZ, Kang JQ, Maiese K. Erythropoietin is a novel vascular protectant through activation of Akt1 and mitochondrial modulation of cysteine proteases. Circulation. 2002;106:2973–2979. doi: 10.1161/01.cir.0000039103.58920.1f. [DOI] [PubMed] [Google Scholar]
- 47.Kang JQ, Chong ZZ, Maiese K. Critical role for Akt1 in the modulation of apoptotic phosphatidylserine exposure and microglial activation. Mol Pharmacol. 2003;64:557–569. doi: 10.1124/mol.64.3.557. [DOI] [PubMed] [Google Scholar]
- 48.Mao LM, et al. Stability of surface NMDA receptors controls synaptic and behavioral adaptations to amphetamine. Nat Neurosci. 2009;12:602–610. doi: 10.1038/nn.2300. [DOI] [PMC free article] [PubMed] [Google Scholar]
- 49.Arain FM, Boyd KL, Gallagher MJ. Decreased viability and absence-like epilepsy in mice lacking or deficient in the GABAA receptor alpha1 subunit. Epilepsia. 2012;53:e161–e165. doi: 10.1111/j.1528-1167.2012.03596.x. [DOI] [PMC free article] [PubMed] [Google Scholar]
- 50.Zhang J, et al. MUFOLD: A new solution for protein 3D structure prediction. Proteins. 2010;78:1137–1152. doi: 10.1002/prot.22634. [DOI] [PMC free article] [PubMed] [Google Scholar]
- 51.Schneidman-Duhovny D, Inbar Y, Nussinov R, Wolfson HJ. Geometry-based flexible and symmetric protein docking. Proteins. 2005;60:224–231. doi: 10.1002/prot.20562. [DOI] [PubMed] [Google Scholar]
- 52.Pettersen EF, et al. UCSF Chimera--a visualization system for exploratory research and analysis. J Comput Chem. 2004;25:1605–1612. doi: 10.1002/jcc.20084. [DOI] [PubMed] [Google Scholar]
Associated Data
This section collects any data citations, data availability statements, or supplementary materials included in this article.
Supplementary Materials
Supplementary Figure 1. A docking model suggests that truncated γ2(Q390X) subunits are prone to aggregate and form dimers with themselves or other partnering subunits that are potentially stable.
a, b, Cartoons illustrate α1β2γ2 pentamers (a) and the protein topology of wild-type γ2 and mutant γ2(Q390X) subunits (b). c, Top 5 docking models for potential mutant γ2 subunit homodimers predicted by SymmDock are shown. In each panel, the two γ2 subunit chains are shown in red and green. d, Top 5 docking models of potential complexes between the mutant γ2 subunit (shown in green) and its wild-type partnering α1 subunit (shown in red) predicted by PatchDock are shown.
Supplementary Figure 2. Mutant γ2(Q390X) subunits accumulated in cortex and cerebellum in P0 Gabrg2+/Q390X KI mice.
Brains from P0 wild-type and KI mouse littermates (C57BL/6J strain) were paraffin embedded, sectioned at 5 μm and stained with rabbit anti-γ2 subunit antibody and visualized with DAB. The sections were counterstained with hematoxylin, and the equivalent areas in the cortices of both wt and heterozygous (het) KI mice were imaged under light microscopy. Large red boxes indicated the posterior lobe of the cerebellum (bottom).
Supplementary video. Gabrg2+/Q390X KI mice had generalized tonic clonic seizures and sudden death after seizures.
A 19 day old KI mouse had spontaneous generalized seizures during handling (tailing). The mouse was found dead the next day, reminiscent of SUDEP in epilepsy patients.
Supplementary Figure 3. EEGs were obtained from wild-type and Gabrg2+/Q390X KI littermates in the C57BL/6J background.
Representative EEG recordings from a two month old wild-type mouse in the C57BL/6J background demonstrated no epileptiform activity (1) while its mutant littermate had ictal discharges (3). The boxed areas in 1 and 3 were expanded and illustrated in 2 and 4.
Supplementary Figure 4. Full length gels.
Full-length gels for images are presented in Figures 5a–d, 6d–e, 8e and supplementary Figure 10. The boxed region in each gel is the image presented in each corresponding figure. The colored image is shown for those gels with double colored protein molecular weight standards. White boxed regions are designated regions for protein of interest while purple boxed regions are for loading control. In Figure 5a, 5c and Figure 6e, the loading control is in the same gel for protein of interest.
Supplementary Figure 5. Representative images showing that mutant γ2(Q390X) subunits formed caspase 3 positive aggregates in old, but not young, mice.
a, Images from cortices of 1 year old wild-type (wt) and heterozygous (het) KI littermates. The brains were paraffin embedded and stained with mouse anti-γ2 subunit antibody (red), rabbit cleaved caspase 3 (green) and cellular nucleus marker To-pro-3 (blue). b, The cortices of 1 year old wt and 2 month, 5 month and 1 year old het KI littermates were stained with rabbit cleaved caspase 3.
Supplementary Figure 6. Representative images showing that there was neuronal loss in cortical layers V and VI in the older Gabrg2+/Q390X KI mice.
a, b, Images from cortices of 18 month old wild-type (wt) and heterozygous (het) KI mouse littermates (C57BL/6J as well as in C57/BL/6J/S129/SvJ background). The brain sections were from paraffin embedded or short fixed tissues and stained with mouse anti-NeuN and rabbit anti-Er81 antibodies, the cortical layer V marker (Er81) (a) or rabbit anti Trb1, a layer VI marker, (b). To-pro-3 (blue) was used to stain cellular nuclei in both a and b. c, The average numbers of cells costained with NeuN and Er81 or with NeuN and Trb1 were reduced in the het mice. (Unpaired t test, p = 0.2071 for Er81+NeuN, p = 0.0318 for Tbr1+NeuN, n = 5 pair of mice from 14–18 months old) (* p < 0.05; vs wt).
Supplementary Figure 7. Representative images showing that there was neuronal loss in the somatosensory cortex in the older Gabrg2+/Q390X KI mice.
a, Images are presented showing a coronal brain section from a 16 month old heterozygous (het) KI mouse stained with anti-γ2 subunit (green), anti-NeuN (red) and To-pro-3 (blue) and the brain regions we surveyed for neuronal loss. (b). Enlarged image of cortex from a to demonstrate the cortical layers. c, d, The brain sections were from paraffin embedded tissues and stained with mouse anti-NeuN (c) or anti-NeuN and cellular nucleus marker To-pro-3 (blue) (d). e, The average number of cells stained with NeuN were reduced in the cortex in the het mice. (unpaired t test, p = 0.03 for cortex I–II/III, p = 0.0012 for cortex IV–VI, p = 0.0226 for thal). f, The average number of cells stained with To-pro-3 or NeuN were unchanged in the dentate gyrus (DG), CA1 and CA3 regions in the het mice. To-pro-3 positive cells were quantified in DG because the cells were packed, and it was difficult to distinguish cell boundaries with the NeuN staining used in hippocampus (unpaired t test, p = 0.3590 for dg, p = 0.3924 for CA1, p = 0.7008 for CA3). g, for unbiased tissue imaging and cell counting, 6–8 consecutive brain sections from each mouse were prepared, the images were acquired automatically by computer and the core personnel who was blind to the mouse genotype. The images were scanned at original magnification of 20X, the images were viewed at 7X and the total cell numbers were measured per 5×10⁵ um2 in the somatosensory cortex S1-2 region. For each mouse, the 6–8 consecutive sections were averaged and taken as n = 1 of 5 pairs. (Unpaired t test, p = 0.0074). (* p< 0.05; ** p< 0.01 vs wt, n = 5 pair of mice from 14–18 months old.).
Supplementary Figure 8. Representative images showing Purkinje neurons in the cerebellum in the older Gabrg2+/Q390X KI mice.
a, Image showing the sagittal section of cerebellum in the 16 month old heterozygous (het) KI mouse stained with anti-γ2 subunit (green), anti-NeuN (red) and To-pro-3 (blue). The white boxed region represented the area we surveyed for Purkinje cell loss, which was between cerebellar lobule VII–VIII. b, Enlarged image of the surveyed cerebellum region in c and d stained with anti-calbindin D-28K (green) and anti-NeuN (red) antibodies and with To-pro-3 (blue). We costained the cerebellar tissue with both anti-NeuN and anti-Calbindin D-28K antibody because we found that NeuN did not label Purkinje neurons well. c, Cerebellar sections from wild-type and het mice stained with mouse anti-NeuN (red) and anti-Calbindin D-28K. (d). The lobule VII in either wt or het cerebellar cortex was surveyed under 63X objective. The cell counts of the 6–8 consecutive sections were averaged and taken as one of 5 pairs of mice. Average numbers of cells stained with Calbindin D-28K were quantified (unpaired t test, p = 0.0515, n = 5 pair of mice from 14–18 months old.).
Supplementary Figure 9. Representative image showing that short fixed wild-type mouse brain tissues had good preservation of GABAA receptor γ2 subunit protein.
The image above shows the immunostaining of γ2 subunits (green) in the hippocampal CA1 region of a three month-old wild-type mouse with the short fix (30 min in 4% PFA) method. The blue staining in the image above is the nucleus marker, Topro-3. The γ2 subunit distribution pattern was similar to that of γ2YFP subunits in live cultured hippocampal neurons in the paper Figure 1f–g and Figure 6a–b.
Supplementary Figure 10. The old Gabrg2+/Q390X KI mice had increased caspase 3 expression.
The lysates of cytosolic fration from forebrain tissues of wild-type (wt) and heterozygous (het) KI littermates were fractionated by SDS-PAGE and immunoblotted with rabbit polyclonal anti-active caspase 3. LC stands for NA+/K+ATPase internal loading control. The full-length gel is provided in Supplementary fig. 4.
Supplementary Figure 11. Representative images showing no difference in caspase 3 expression in young wild-type and Gabrg2+/Q390X KI mice.
a, The brain sections from P0 old mice were stained with anti-caspase 3 (active form) antibody, and the nuclei were counterstained with hematoxylin. b, The caspase 3 positive cells in different brain regions were quantified. There was more positive caspase 3 staining in P0 old pups than in adult mice probably due to active neuronal pruning and apoptosis during early brain development (two way ANOVA and Bonferroni posttests, P>0.05 for all brain regions. Error bars are s.e.m. See Supplementary Mehods Checklist for full details of statistical tests.).
Supplementary Figure 12. Representative images showing that increased caspase 3 activation in the old mutant Gabrg2+/Q390X KI mice was likely due to mutant subunit accumulation.
a, Cortical brain sections from 1 year old mice were stained with anti-γ2 subunit (right panel) or anti-caspase 3 (left panel) antibodies, and nuclei were counterstained with hematoxylin. b, The caspase 3 positive cells in the cortex from mice at different ages were quantified. There were caspase 3 positive cells in the older KI mice but not in the young KI mice compared to the wild-type mice. There was more positive caspase 3 staining in P0 pups than in adult mice probably due to active neuronal pruning and apoptosis during early brain development (two way ANOVA and Bonferroni posttests, p>0.05 for p0, P>0.05 for 2–4 months, P>0.05 for 5–6 months, P<0.001 for ~12 months. Error bars are s.e.m. See Supplementary Mehods Checklist for full details of statistical tests.)..
Supplementary Figure 13. The GABRG2(Q390X) mutation produced more mutant subunit protein aggregates than the GABRG2(Q40X) mutation.
Total lysates from HEK 293T cells untransfected (con) or transfected with wild-type γ2 and two mutant γ2 subunits (Q40X and Q390X) alone associated with Dravet syndrome (DS) were analyzed by SDS-PAGE. The membrane was immunoblotted with rabbit polyclonal anti γ2 subunit antibody. LC stands for Na+/K+ ATPase loading control. There was much more mutant γ2(Q390X) subunit total protein than wild-type γ2 or mutant γ2(Q40X) subunit total protein in HEK 293T cells expressing the equal amounts of wild-type or mutant cDNAs.