Abstract
The in vitro study of liver functions and liver cell specific responses to external stimuli deals with the problem to preserve the in vivo functions of primary hepatocytes. In this study, we used the biochip OrganoPlateTM (MIMETAS) that combines different advantages for the cultivation of hepatocytes in vitro: (1) the perfusion flow is achieved without a pump allowing easy handling and placement in the incubator; (2) the phaseguides allow plating of matrix-embedded cells in lanes adjacent to the perfusion flow without physical barrier; and (3) the matrix-embedding ensures indirect contact of the cells to the flow. In order to evaluate the applicability of this biochip for the study of hepatocyte's functions, MatrigelTM-embedded HepG2 cells were cultured over three weeks in this biochip and compared to a static Matrigel culture (3D) and a monolayer culture (2D). Chip-cultured cells grew in spheroid-like structures and were characterized by the formation of bile canaliculi and a high viability over 14 days. Hepatocyte-specific physiology was achieved as determined by an increase in albumin production. Improved detoxification metabolism was demonstrated by strongly increased cytochrome P450 activity and urea production. Additionally, chip-cultured cells displayed increased sensitivity to acetaminophen. Altogether, the OrganoPlate seems to be a very useful alternative for the cultivation of hepatocytes, as their behavior was strongly improved over 2D and static 3D cultures and the results were largely comparable and partly superior to the previous reports on biochip-cultured hepatocytes. As for the low technical needs, this platform has the appearance of being highly applicable for further studies of hepatocytes' responses to external stimuli.
I. INTRODUCTION
The pivotal role of the liver in influencing almost every field of metabolism, such as fatty acid, lipid, and glucose metabolism, the immune and coagulation systems, detoxification mechanisms, as well as the acute phase response has aroused interest in analyzing the special hepatocytes' functions since decades.1 Nevertheless, the in vitro study of liver functions and liver cell specific responses to external stimuli still deals with the problem to preserve the in vivo functions of primary hepatocytes and to depict the in vivo situation with stable immortal hepatocyte cell lines. For example, isolated and cultured liver cells display altered transcriptional and translational profiles other than their in vivo counterparts resulting in modified metabolism and cellular responses.2 Hepatocytes' functions are strongly dependent on the appropriate morphology and polarization which are rarely achieved by conventional 2D culture.3 This might lead to misinterpretation and the lack of transferability to the in vivo situation and, therefore, strongly limits the validity of in vitro analysis of liver cell functionality. The embedding of hepatocytes in extracellular matrix (ECM) such as naturally derived MatrigelTM preserves cellular morphology and polarization.4 By using perfusion systems, cells can adequately be supplied with nutrients and oxygen, while wastes are removed permanently.5,6 The improvement of hepatocytes' proliferation and metabolism by a constant perfusion flow in a microfluidic reactor was shown previously.5 Nevertheless, a strong flow does not reflect the in vivo situation as a hepatocyte in the liver is not in direct contact to blood circulation for endothelial cells and the space of Disse acting as filters to the hepatocytes. The negative impact of strong shear stress on hepatocytes' metabolism has been shown before.7 Only few research groups have used artificial physical barriers to separate liver cells from flow such as tightly placed micropillars8,9 or micro scale walls10,11 using microfabrication techniques or commercial membrane filters.12,13 However, those artificial physical barriers might prevent intercellular communication and diffusion of nutrients, waste metabolites, and signaling molecules.
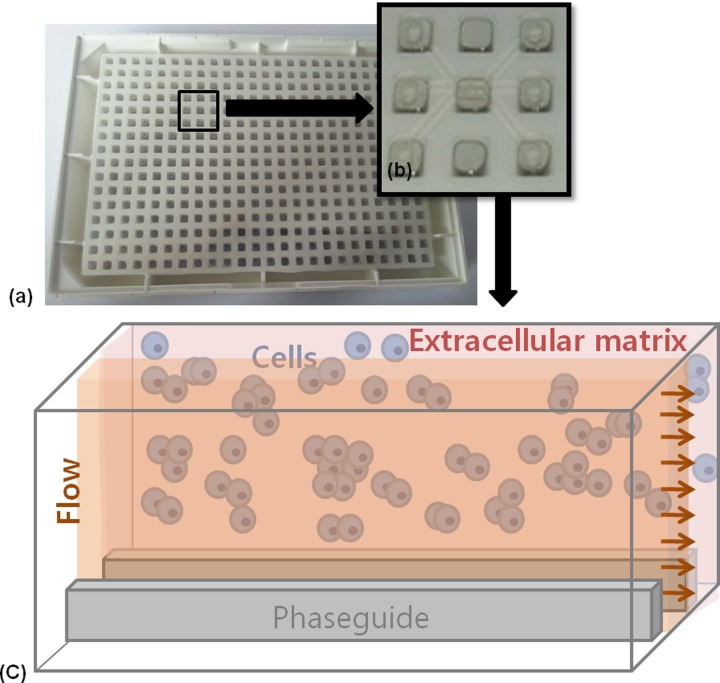
Recently, a technique called “phaseguide” has been developed to independently control the filling and emptying of each lane or chamber in a microfluidic structure.14 A microfluidic device with phaseguides called OrganoPlateTM was recently developed by MIMETAS and Leiden University (Leiden, The Netherlands) and first examples of cell culturing were published by Trietsch et al.15 Briefly, the cell culture chip is a commercial 364-well plate where microfluidic structures are embedded on the bottom resulting in 40 culture chambers. Each culture chamber consists of three lanes separated by phaseguides and allows the generation of a continuous passive perfusion without connection to an extra pump or tubing line. HepG2 cells were cultivated in the outer side lanes embedded in extracellular matrix patterned along the phaseguides without any overflow. Therefore, this ensured (1) the separation of the cells' culture area and the perfusion flow without any physical barrier, and (2) indirect contact of HepG2 cells to the flow due to the polymerization of the extra cellular matrix working as a filter for the cells. As to our knowledge, this is the first biochip combining these two advantages to hepatocyte culturing.
Although the principal suitability of hepatocyte cultivation in the OrganoPlate was demonstrated,15 a profound basic characterization of hepatocytes cultured in this biochip is still lacking. In order to make up for this and pave the way for further studies with clinical importance, the present study aimed to assess hepatocytes' behavior considering multiple performance criteria: cellular morphology and differentiation over two weeks (clustering, bile canaliculi formation, and viability), different metabolic endpoints (albumin, urea, and Cyp1A2 activity), and one clinically important toxicity assay (acetaminophen, APAP). The current study clearly demonstrates improved functioning of HepG2 cells in the microfluidic-based chip in comparison to static 2D and 3D cultures pertinent to normal hepatocyte metabolism and drug response.
II. EXPERIMENTS
A. Microfluidic chip fabrication
The microfluidic chip (product name: OrganoPlate) was produced by MIMETAS and Leiden University (Leiden, The Netherlands). The fabrication details have been described previously.15 The chosen design in the present study is shown in Figure 1 (Model No. 4001–200-W). Each culture chamber has three lanes with a size of 1.8 × 0.2 × 0.12 mm (length × width × height) including two phaseguides with 50 × 30 μm (width × height).
FIG. 1.
Schematic presentation of the microfluidic device. (a) The microfluidic structure is embedded on the bottom of 364-well plates. (b) Each culture chamber has three lanes with inlet and outlet, respectively. (c) Culture model for HepG2 cells in extracellular matrix separated from flow without any physical barrier using phaseguides. HepG2 cells have indirect contact to flow.
B. Cell culture conditions
The HepG2 (human hepatocellular carcinoma) cells were purchased from the German collection of microorganisms and cell cultures (DSMZ, Braunschweig, Germany). The cells were cultivated in William's E medium (Pan-Biotech GmbH, Aidenbach, Germany) supplemented with 10% FBS (fetal bovine serum), penicillin (100 U ml−1), and streptomycin (100 μg ml−1) (Sigma-Aldrich, Munich, Germany) in a 75 cm2 flask. They were incubated at 37 °C and 5% CO2 in a cell incubator (Binder, Tuttlingen, Germany). The number of cells was counted by using a hemocytometer and the cell viability was assessed by trypan blue exclusion. For monolayer culture (2D), the cells were seeded in conventional 96-well plates (2 × 10⁴ cells per well). For static 3D culture, cells were mixed with Matrigel in the same concentration as for chip culture and were layered in 96-well plates as well.
The perfused 3D cultivation of HepG2 cells was carried out in the microfluidic platform purchased from MIMETAS and Leiden University (Leiden, The Netherlands).15 Briefly, 50 μl PBS (phosphate-buffered saline) was added to the observation window to prevent evaporation. The number of HepG2 cells was counted and the appropriate amount was suspended with Matrigel (8.2 mg ml−1) at 4 °C on ice to concentrations of 1 × 10⁷, 5 × 10⁷, and 1 × 10⁸ ml−1. This mixture was injected and soaked into the inner channel along the phaseguide by capillary forces. The cells were incubated at 37 °C for 15 min to be gelled and 25 μl of the medium was added to the medium outlet. Further, incubation for 5–6 h allowed entire gelling. The perfusion was started by adding 100 μl of medium to the inlet well. The medium was renewed every day. For further analysis, the concentration of 8 × 10⁷ ml−1 was used. For experiment optimization, we tested also another perfusion setup: we cultivated HepG2 cells in the middle lane and generated the flow on the side lanes.
C. Cell morphology visualization
The cell clusters were monitored at day 1, 3, 7, and 14 by using a light microscope. Area and length of cell clusters were measured using the Image J program (http://imagej.nih.gov/ij). Cellular plasma membrane and nucleic acids were stained with CellMask plasma membrane stain (5 μg ml−1, C10046, Invitrogen, Paisley, UK) and DAPI (4,6-Diamidin-2-phenylindol) (200 ng ml−1, D9542, Sigma, Munich, Germany) in PBS, respectively. The cells were incubated with CellMask and DAPI working solution for 30 min at room temperature. Fluorescence was monitored using a Zeiss fluorescence microscope (excitation/emission: 365 nm/DAPI filter set for DAPI, 625 nm/Alexa Fluor 633 filter set for cellular plasma membrane stain).
D. Bile canaliculi visualization
Bile canaliculi were visualized by using 5-carboxyfluorescein diacetate (5-CFDA, Sigma-Aldrich, Munich). This non-fluorescent dye is converted by intracellular esterases to the fluorescent carboxyfluorescein (CF) which in turn is excreted via the multidrug resistance associated protein (MRP) transporter expressed in the bile canaliculi.16 The culture medium was exchanged, supplemented with 5 μM 5-CFDA, and the cells were incubated for 30 min in the incubator. The medium with 5-CFDA was aspirated; the cells were washed 3 times and incubated with a dye free medium for 50 min. The 5-CFDA/CF efflux was observed by using a Zeiss fluorescence microscope with a 470 nm excitation and FITC (Fluorescein isothiocyanate) filter set.
E. Lactate dehydrogenase (LDH) activity measurement
The LDH activity in the medium was measured using the colorimetric Lactate Dehydrogenase Assay Kit (ab102526, Abcam, Cambridge, UK) according to the manufacturer's instructions. By using a microplate reader, the optical density was measured at 450 nm immediately and after incubation at 37 °C for 30 min.
F. Live/dead staining/visualization
The cellular live/dead assay was performed by using Calcein Blue AM (eBioscience, Frankfurt, Germany) and Ethidium Homodimer III (EthD-III, Biotium, Hayward, USA) staining to determine cell viability. Briefly, the cells were washed three times with PBS buffer and incubated for 30 min with 4 μM calcein AM Blue and 1 μM EthD-III in PBS. Fluorescence images were taken by using a Zeiss fluorescence microscope (excitation/emission: 365 nm/DAPI filter set for Calcein Blue AM, 530 nm/PI (propidium iodide) filter set for Ethidium Homodimer III) and analyzed using the ImageJ software.
G. Albumin measurement
The cell culture medium from HepG2 cells was collected at indicated time points and stored at −80 °C immediately. Albumin secreted by cells to the medium was determined using a human albumin ELISA Kit (E88–129, Bethyl Laboratories, Montgomery, Texas, USA). All procedures were followed by the manufacturer's instructions. Optical density at 450 nm was measured with a microplate reader. Experiments were performed in triplicate.
H. Urea measurement
Culture medium was collected during the cultivation period every third day and stored at −80 °C. The amount of urea in the cell culture medium was determined by using a colorimetric urea assay kit (ab83362, Abcam, Cambridge, UK). The procedure was ensued according to the manufacturer's instructions. The optical density at 570 nm was measured with a microplate reader.
I. Cytochrome P450 1A induction assay
The CYP1A assay was performed with resorufin ethyl ether (Sigma-Aldrich, Munich, Germany) as substrate which is converted by the cytochrome P450 monooxygenases CYP1A1 and CYP1A2 to a fluorescent resorufin product.17 The HepG2 cells were cultivated with 5 μM 3-methylcholatren (3-MC, Sigma-Aldrich, Munich, Germany) dissolved in medium for 72 h to induce CYP1A activity. Control cultures were treated with a vehicle solution (dimethyl sulfoxide, DMSO). After the cultivation start, the cells were incubated with 10 μM resorufin ethyl ether in a serum-free medium for 3 h. Fluorescence was measured at 525/580–640 nm with a fluorescence microplate reader.
J. Acetaminophen treatment
For the evaluation of liver toxicity, the cells were treated with APAP (Sigma-Albrich, Munich, Germany). An APAP stock solution was prepared with DMSO and further diluted in growth medium to concentrations of 0.5–25 mM. As a control, DMSO was diluted in similar concentrations without APAP. 2D and perfused 3D HepG2 cells were cultured for 24 h and 10 days, respectively. Cells were treated with different concentrations of APAP for 72 h. Live and dead staining were performed as mentioned above. The measurement was performed in triplicate and a dose response analysis was done by using Origin Lab. The LC50 value was calculated based on the fitting curve equation in logarithmic scaling.
K. Statistical analysis
Statistical analysis was performed with SPSS by using One Way ANOVA and One Way ANOVA with repeated measures for normally distributed data. P < 0.05 was considered significant. For the CYP1A induction assay, independent Student's T-test was used. For reasons of clarity and comprehensibility, all data are expressed as means ± standard deviation (SD).
III. RESULTS
A. Cell and culture morphology under different conditions
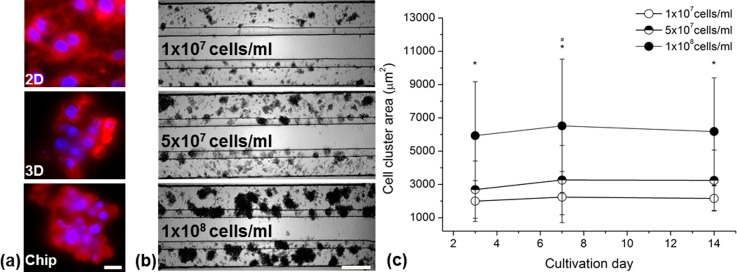
The cellular morphology was analyzed at day 7 after the cultivation start in the different culture models (Figure 2). In the 2D culture, HepG2 cells displayed an epithelial morphology with a spread membrane. In contrast to this, the cells in the static and the perfused 3D culture lay tightly together and their membranes did not spread, whereas the shape was more globular (Figure 2(a)). For experiment optimization, we tested the cultivation in the middle lane and perfusion flow at both side lanes. However, the spheroids of HepG2 cells did not retain their morphology. After one week, most of the cells resembled monolayer morphology (data not shown). Therefore, we proceeded to cultivate the cells in both side lanes to generate less contact area of flow to the extracellular matrix. The formation and increase of HepG2 cell clusters in the chip cultivation at different cell seeding concentrations are demonstrated in Figure 2(b). The cells aggregated and arranged themselves to clusters within three days and spheroids maintained more than two weeks.
FIG. 2.
Comparison of HepG2 culture morphology in 2D and chip culture after 7 days of cultivation and formation of cell clusters in the perfused microfluidic device. (a) Membrane and nuclei staining of HepG2 cells in different culturing systems visualized by fluorescence microscopy. Scale bar indicates 10 μm. (b) Representative images of HepG2 clustering in low (1 × 10⁷ cells/ml), middle (5 × 10⁷ cells/ml), and high (1 × 10⁸ cells/ml) concentrated cultures examined by light microscopy. Scale bar indicates 200 μm. (c) Aggregation area of variably concentrated HepG2 cultures over time. Data are shown as mean ± SD (n = 3). Significant differences (p < 0.05) are indicated as follows: * every concentration vs. the other two at the respective day and # within high-concentrated culture vs. day 3 and 14.
The cluster size differed between different cell seeding concentrations with a maximum size of 70–80 μm for the culture with 1 × 10⁷ cells/ml and up to 200 μm for 1 × 10⁸ cells/ml at day 7. The cell clusters were stable for more than two weeks of cultivation. To analyze the growth of each cluster, their area was measured at day 3, 7, and 14 for each concentration (Figure 2(c)). The cluster area of the 5 × 10⁷ cells/ml culture was slightly higher in comparison to the 1 × 10⁷ cells/ml culture (3000 μm2 vs. 2000 μm2). In contrast, the cluster area of the 1 × 10⁸ cells/ml cultured cells was considerably higher with approximately 6000 μm2. There were no significant changes between day 3 and day 14 for the 1 × 10⁷ cells/ml and 5 × 10⁷ cells/ml cultured cells. However, for the highest seeding concentration, we detected an increase of the cluster area between days 3 and 7. For reasons of augmented adherence of cells in the inlet channel when using the highest concentration, an intermediate concentration of 8 × 10⁷ ml−1 was chosen for further experiments.
B. Formation of bile canaliculi in static 2D, 3D, and chip culture
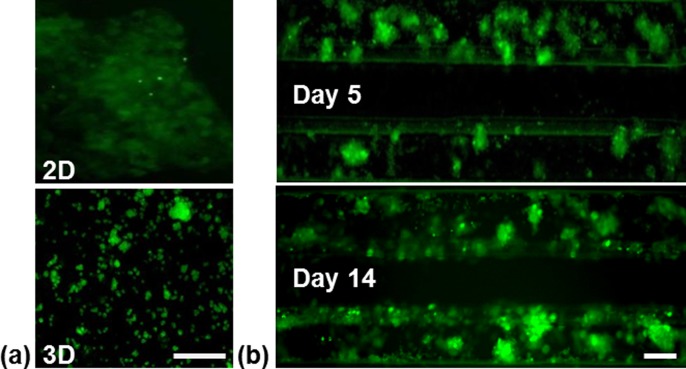
Figure 3 features the formation of bile canaliculi in the different culturing models. HepG2 cells in static 2D and 3D cultures showed diffuse weak fluorescence indicating intracellular location of the fluorescence dye carboxyfluorescein.
FIG. 3.
Representative images of bile canaliculi formation of HepG2 cells under different culturing conditions visualized by fluorescence microscopy (a) Static 2D and 3D cultures on day 5. (b) Perfused 3D culture on day 5 and 14. Scale bar indicates 100 μm.
Small spotted fluorescence was only seen infrequently in these culturing models. However, the 3D culture in the chip displayed with strong fluorescence within cell clusters indicating the frequent formation of bile canaliculi. This remained stable for more than two weeks.
C. Viability of HepG2 cells under different culturing conditions
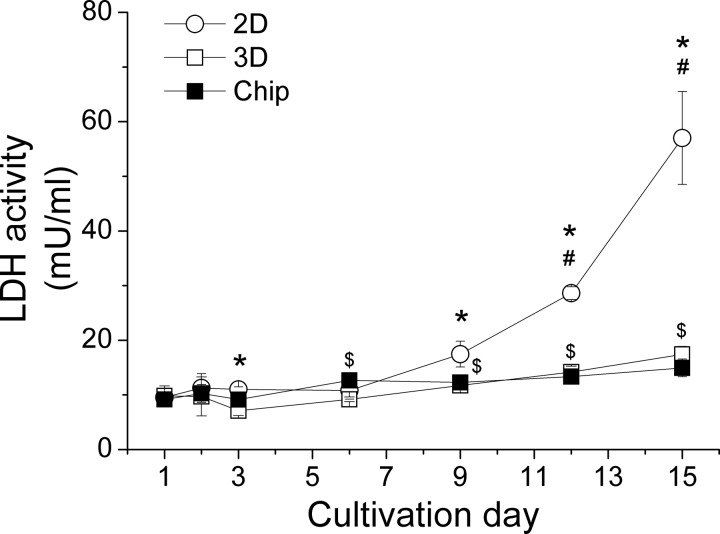
The LDH concentration in the medium of 2D cultured HepG2 cells started to increase after 9 days and reached 5-times higher levels after two weeks in comparison to the respective baseline (Figure 4). By contrast, the LDH concentration in the medium of static and perfused 3D cultured cells remained low within 15 days with a slight increase after day 6. There was no significant difference between static 3D and perfused 3D cultures during the two weeks of cultivation.
FIG. 4.
LDH release of HepG2 cells within two weeks in the different culture models. Data are shown as mean ± SD (n = 3). Significant differences (p < 0.05) are indicated as follows: * 2D vs. chip culture at the respective day, # within 2D culture vs. day 1, 2, 3, 6, and 9, $within chip culture vs. day 1 and 3, and & within static 3D culture vs. day 1, 2, 3, and 6.
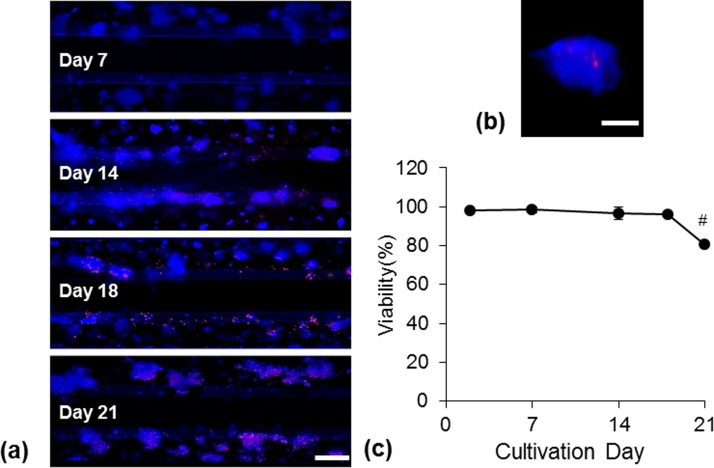
In order to determine dead cells in the perfused 3D culturing system, HepG2 cells were cultivated for a period of three weeks and analyzed on day 7, 14, 18, and 21 (Figure 5). Within the first two weeks, almost no EthD-III staining was visible. The cells in proximity to the perfused flow started to get damaged after two weeks of cultivation while the cells more distant to the flow survived a longer culturing time. We found only few dead cells inside the spheroids even after two weeks of cultivation (Figure 5(b)). The viability rate assessed by measuring the area of live and dead cells revealed that 80% of the cells were alive up to three weeks in perfused 3D cultivation.
FIG. 5.
Cell viability of HepG2 cells cultured in the microfluidic device. (a) Representative images of live/dead (blue/red) stained cells after three weeks of cultivation. Scale bar indicates 200 μm. (b) Representative image of a spheroid with live/dead staining after two weeks of cultivation. Scale bar indicates 50 μm. (c) Determination of viability from three independent experiments. Data are shown as mean ± SD (n = 3). Significant differences (p < 0.05) are indicated as follows: # vs. all other days.
D. Metabolic activity of HepG2 cells under different culturing conditions
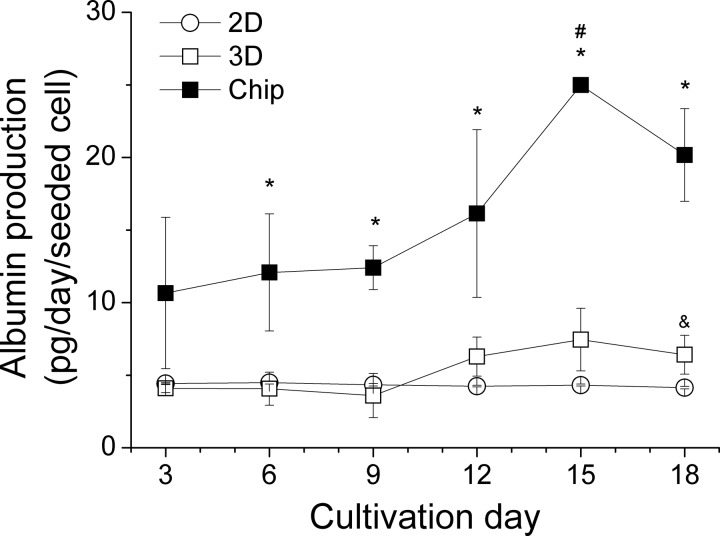
The amount of albumin production as a parameter of metabolic activity under different culturing conditions is shown in Figure 6. For the entire cultivation period, the albumin concentration in the medium of HepG2 cells in the chip was consistently higher than in the medium of the static 2D and 3D cultures.
FIG. 6.
Albumin production within 18 days under different culturing conditions. Data are shown as mean ± SD (n = 3). Significant differences (p < 0.05) are indicated as follows: * perfused 3D vs. static 2D and 3D cultures, & static 3D vs. 2D culture at the respective day, and # within chip culture vs. day 3, 6, 9.
Beginning with a concentration twice as much as in the static cultures (day 3), the albumin production raised strongly after 10 days of cultivation in the chip, reaching a maximum of 5-times higher levels on day 15 and a tendency to decrease on day 18. In comparison, the levels remained stable in the 2D culture over the whole observation period. In the static 3D culture, we measured a very low increase of albumin at day 12 and this elevated level remained until day 18.
E. Detoxification capacity of HepG2 cells under different culturing conditions
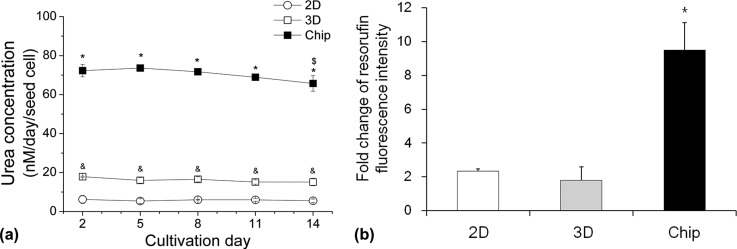
The urea concentration in the medium of 2D and static 3D cultured HepG2 cells was consistently low over two weeks with approximately 6 nM and 20 nM per seeded cell, respectively. In contrast to this, HepG2 cells in the perfused chip produced a twelve-times (to 2D culture) and a three-times (to static 3D culture) higher amount of urea within 2–14 days of cultivation. A slight decrease of urea production was seen in the chip culture system being significant at day 14 (Figure 7(a)).
FIG. 7.
Metabolism of HepG2 cells under different culturing conditions. (a) Urea production within 14 days under different culturing conditions. Data are shown as mean ± SD (n = 3). Significant differences (p < 0.05) are indicated as follows: * chip culture vs. static 2D and 3D cultures, & static 2D vs. 3D cultures at the respective day, and $within chip culture vs. day 2 and 5. (b) Cyp1a induction after 72 h under different culturing conditions. Fluorescence intensity was normalized to the uninduced control within each culturing model. Data are shown as mean ± SD (n = 3). Significant differences (p < 0.05) are indicated as follows: * vs. static 2D and 3D cultures.
The Cyp1a induction assay displayed doubled enzyme activity in the static 2D and 3D cultures in comparison to the respective uninduced control. In contrast, resorufin fluorescence intensity in the chip culture model increased 9-times, indicating higher Cyp1a activity in comparison to the other culture models (Figure 7(b)).
F. Drug-induced HepG2 damage under different culturing conditions
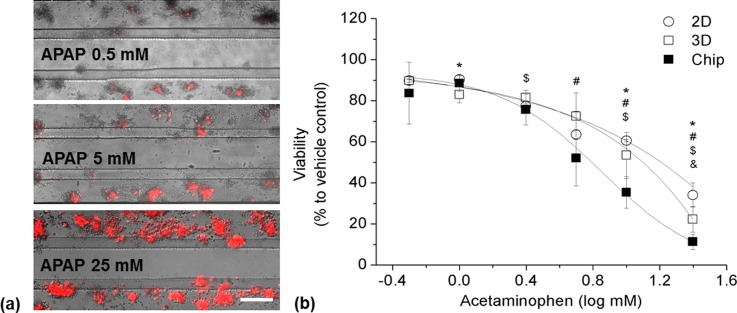
To evaluate the applicability of the microfluidic-based chip culture system for drug-induced cell damage assays, HepG2 cells were exposed to APAP; example pictures and a dose-response curve are presented in Figure 8.
FIG. 8.
Acetaminophen response of HepG2 cells under different culturing conditions. (a) Representative images of HepG2 cells cultured 10 days in the perfused chip and exposed to different concentrations of acetaminophen. (b) Dose-response curve of HepG2 cells exposed to acetaminophen under different culturing conditions. Data are shown as mean ± SD (n = 3). Significant differences (p < 0.05) are indicated as follows: * 2D vs. chip culture, $static 3D vs. chip culture, & 2D vs. static 3D culture at the respective concentration, and # within 2D, static 3D, and chip cultures vs. their respective baseline (0.5 mM).
LC50 of 2D, static 3D, and chip cultures at day 10 were determined at 15.8 mM, 11.8 mM, and 7.1 mM, respectively. At day 5, LC50 of the chip culture was determined at 11 mM (data not shown). Significantly reduced viability was observed at 5 mM for all culture systems and the treatment with 25 mM reduced the viability to 10% (chip culture), 20% (static 3D culture), and 30% (2D culture).
IV. DISCUSSION
The major challenge for the in vitro cultivation of hepatocytes is the maintenance of their typical morphological characteristics and cellular functions. The embedding of hepatocytes in ECM such as Matrigel has been demonstrated to prevent cellular dedifferentiation and to help maintain hepatocyte's characteristics.4 Furthermore, different microfluidic systems have been developed in the past in which constant growth conditions were achieved by a perfusion flow of cell culture medium providing permanent sustenance with nutrients and oxygen as well as removal of waste metabolites.18,19 However, to our knowledge, there is still no system described where hepatocytes are cultivated with indirect flow without any physical barrier which would reflect the in vivo situation even better. In order to establish a useful cultivation system for the analysis of hepatocellular functions, we tested the growth, differentiation, and metabolical behavior of HepG2 cells embedded in Matrigel in the OrganoPlate from MIMETAS and Leiden University that combines these unique characteristics.
In our study, the Matrigel-embedded hepatocytes aggregated to cell clusters (spheroids) early after plating while the cells in 2D culture grew in a uniform monolayer with an epithelial morphology. These spheroid-like structures in the 3D cultures did not exceed a diameter of 150 μm which should allow sufficient sustenance of the inner cells.20 The cluster area of the highest concentrated cells increased slightly within the first week of cultivation but the following week did not yield further augmentation which is rather likely due to reduced proliferation caused by contact inhibition.21 A similar behavior was published previously about HepG2 cells grown as an organotypic culture in spheroid-like structures.22 Nevertheless, the HepG2-cluster size in our study was not as uniform as the spheroid-size in the study from those authors.
The culture system seemed to preserve cellular viability and integrity over at least 15 days which we demonstrated with multiple performance criteria: (1) the constant low LDH in the medium of chip-cultured cells in comparison to a strong increase in the medium of the monolayer cells clearly demonstrates integrity of the chip cells; (2) live/dead staining revealed first dying cells after 14 days of chip culturing and only few dying cells within spheroids; and (3) the strong increase of albumin production until day 15 is not seen in the culture of the monolayer cells and less pronounced in the static 3D culture.
Albumin production has been shown to be influenced by the oxygen concentration and by flow-induced shear stress.23 Considering the increase of albumin production within days 12 to 15 as well as the good viability of the cells within at least two weeks of cultivation, we suggest that the cells do not suffer from oxygen or nutrient deprivation. In the literature, albumin secretion rates for hepatocytes cultivated in biochips range from 3.6 pg/cell/day (HepG2 cells) over 2.6–19 pg/cell/day (primary human hepatocytes) to 10–60 pg/cell/day (primary rat hepatocytes), and Török et al. estimated the in vivo secretion rate to 17.8 pg/cell/day.5,12,24 Thus, the levels of albumin secretion we determined for cells in the OrganoPlate appear to be in a physiological range and obviously higher than the secretion rates determined for HepG2 cells by Baudoin et al.5
Some studies have been conducted to find out the effect of shear stress to hepatocyte cultures, all of them demonstrating a decrease of normal hepatocytes' metabolism with increasing flow rates. For example, Tilles et al. presented better metabolism of hepatocytes cultivated in a microchannel bioreactor with a flow pressure of 0.01–0.33 dyn/cm2 in comparison to 5–21 dyn/cm2.7 Dash et al. estimated physiological flow pressure to 0.6 dyn/cm−2, and applying this in a collagen sandwich culture improved the functions of their rat hepatocytes over two weeks.25 Very low flow pressures were applied by Baudoin et al. with a range of 0.02–0.06 dyn/cm2 which resulted in improved metabolism of their hepatocytes in comparison to static cultures.5 In our experiments, the shear stress was determined within the channel to 0.3 dyn/cm−2 which is caused by the hydrodynamic resistance of the small connecting channels (unpublished information from Trietsch). Therefore, it is not likely that shear stress poses a problem in this microfluidic chip system and still the flow should be adequate to ensure sufficient nutrient supply and removal of waste metabolites. Nevertheless, in our study, live/dead staining revealed a premature dying of the cells in the proximity of the perfusion channel, clearly indicating a negative influence of the perfusion flow on the HepG2 cells. The more distant cells seemed to be protected against this, probably due to the Matrigel-embedding.
The strong positive staining of excreted 5-CF even for small clusters suggests differentiation of the chip-cultured hepatocytes in contrast to the static cultures. This is also supported by the higher capacity of nitrogen metabolism of the chip-cultured cells evidenced by considerably augmented urea concentration in the medium. Similar levels of urea secretion were also described by Khetani and Bhatia for primary rat hepatocytes, but only when the cells were cultured together with fibroblasts.26 Hegde et al. presented much lower levels of 10–60 pg/cell/day despite cocultivation conditions.12 The in vivo urea secretion rate was stated by Bhatia et al. to 120–190 pg/cell/day.27 Therefore, the culturing of HepG2 in this OrganoPlate seems to increase urea secretion to levels that in vitro were reached before only by cocultivation systems. Culturing the HepG2 cells in the microfluidic chip increased also their capacity of phase I metabolism (obvious by the increased activity of Cyp1a) in comparison to the conventional monolayer culture and static 3D system. Comparable results were recently described by Hegde et al. with six-times higher Cyp1a activity in a perfused biochip system in comparison to a static culture.12
Altogether, the results indicate optimal growth and differentiation of the HepG2 cells in the OrganoPlate between day 6 and 14, demonstrated by the slight increase of the cluster area until day 7, by the increase of bile canaliculi staining until day 14, by the decreased viability after day 18, by the increase of albumin production after day 12, and by the decrease of urea production at day 14.
As the toxicity of acetaminophen is one of the most frequent causes of drug-induced liver injuries world-wide,28,29 we used this model to evaluate the applicability of this microfluidic chip. Comparable to other literature,3 the chip-cultured cells presented a higher sensitivity for the toxic compound than the HepG2 cells grown in monolayer; this was obvious after five days of cultivation but more pronounced after ten days. This higher sensitivity is likely to be caused by the increased expression level of Cyp1a and other cytochrome P450 monooxygenases that are necessary for the bioactivation of APAP.30 In our study, significantly reduced viability was observed at 5 mM for both culture systems. Prot et al.31 determined first deteriorations of cell proliferation at 1 mM APAP within their respective microfluidic biochip cultivation system. In another microfluidic biochip used by Ma et al.,19 the viability was reduced to 30% with an APAP concentration of 10 mM which is similar to the results of our study. Xia et al.32 observed that the cells grown in a laminar flow perfusion bioreactor were more sensitive for APAP-induced hepatotoxicity than the cells grown in a static 2D culture, and 60% of cell death was shown after 24 h of treatment with 25 mM of APAP.
In summary, this is the first report of HepG2 cultivation with indirect flow but without physical barrier. Our finding suggests that HepG2 cells cultured in the OrganoPlate from MIMETAS mimicking an in vivo hepatocyte environment showed improved and stable hepatic functions for at least two weeks in comparison to 2D and static 3D cultures. The performance criteria were largely comparable to in vivo data and in some parts superior to the reports from other perfused culture systems. However, there are still some disadvantages (difficulties of retrieving the cells from the device) and future challenges (co-cultivation with other cell types) which need to be addressed.
V. CONCLUSION
The results of this study clearly demonstrate the superiority of culturing HepG2 cells in a perfused 3D culture system in comparison to a conventional static 2D and 3D culture. Moreover, the suitability of the applied microfluidic chip for the cultivation of HepG2 cells is evidenced. The presented culture method combines an easy handling with the advantages of 3D and microfluidic culturing. This system, therefore, provides a promising platform for further physiological and toxicological studies on hepatocytes.
ACKNOWLEDGMENTS
This study contains data of the thesis presented by Mi Jang toward her partial fulfilment of the requirements of the degree Doctor rer. nat. at KIST Europe. P. Neuzil acknowledges partial support by the Central European Institute of Technology (CEITEC), grant number CZ.1.05/1.1.00/02.0068. The authors would like to thank Karen Schneider for revising this work linguistically.
References
- 1. Ebrahimkhani M. R., Neiman J. A., Raredon M. S., Hughes D. J., and Griffith L. G., Adv. Drug Delivery Rev. 69–70, 132 (2014). 10.1016/j.addr.2014.02.011 [DOI] [PMC free article] [PubMed] [Google Scholar]
- 2. Godoy P., Hewitt N. J., Albrecht U., Andersen M. E., Ansari N., Bhattacharya S., Bode J. G., Bolleyn J., Borner C., Bottger J., Braeuning A., Budinsky R. A., Burkhardt B., Cameron N. R., Camussi G., Cho C. S., Choi Y. J., Rowlands J. C., Dahmen U., Damm G., Dirsch O., Donato M. T., Dong J., Dooley S., Drasdo D., Eakins R., Ferreira K. S., Fonsato V., Fraczek J., Gebhardt R., Gibson A., Glanemann M., Goldring C. E., Gomez-Lechon M. J., Groothuis G. M., Gustavsson L., Guyot C., Hallifax D., Hammad S., Hayward A., Haussinger D., Hellerbrand C., Hewitt P., Hoehme S., Holzhutter H. G., Houston J. B., Hrach J., Ito K., Jaeschke H., Keitel V., Kelm J. M., Park B. K., Kordes C., Kullak-Ublick G. A., LeCluyse E. L., Lu P., Luebke-Wheeler J., Lutz A., Maltman D. J., Matz-Soja M., McMullen P., Merfort I., Messner S., Meyer C., Mwinyi J., Naisbitt D. J., Nussler A. K., Olinga P., Pampaloni F., Pi J., Pluta L., Przyborski S. A., Ramachandran A., Rogiers V., Rowe C., Schelcher C., Schmich K., Schwarz M., Singh B., Stelzer E. H., Stieger B., Stober R., Sugiyama Y., Tetta C., Thasler W. E., Vanhaecke T., Vinken M., Weiss T. S., Widera A., Woods C. G., Xu J. J., Yarborough K. M., and Hengstler J. G., Arch. Toxicol. 87(8), 1315 (2013). 10.1007/s00204-013-1078-5 [DOI] [PMC free article] [PubMed] [Google Scholar]
- 3. Schyschka L., Sanchez J. J., Wang Z., Burkhardt B., Muller-Vieira U., Zeilinger K., Bachmann A., Nadalin S., Damm G., and Nussler A. K., Arch. Toxicol. 87(8), 1581 (2013). 10.1007/s00204-013-1080-y [DOI] [PubMed] [Google Scholar]
- 4. Kinasiewicz A., Kawiak J., and Werynski A., Biocybern. Biomed. Eng. 26(4), 47 (2006). [Google Scholar]
- 5. Baudoin R., Griscom L., Prot J. M., Legallais C., and Leclerc E., Biochem. Eng. J. 53, 172 (2011). 10.1016/j.bej.2010.10.007 [DOI] [Google Scholar]
- 6. Kim S. S., Sundback C. A., Kaihara S., Benvenuto M. S., Kim B. S., Mooney D. J., and Vacanti J. P., Tissue Eng. 6(1), 39 (2000). 10.1089/107632700320874 [DOI] [PubMed] [Google Scholar]
- 7. Tilles A. W., Baskaran H., Roy P., Yarmush M. L., and Toner M., Biotechnol. Bioeng. 73(5), 379 (2001). 10.1002/bit.1071 [DOI] [PubMed] [Google Scholar]
- 8. Goral V. N., Hsieh Y. C., Petzold O. N., Clark J. S., Yuen P. K., and Faris R. A., Lab Chip 10(24), 3380 (2010). 10.1039/c0lc00135j [DOI] [PubMed] [Google Scholar]
- 9. Toh Y. C., Lim T. C., Tai D., Xiao G., van Noort D., and Yu H., Lab Chip 9(14), 2026 (2009). 10.1039/b900912d [DOI] [PubMed] [Google Scholar]
- 10. Lee P. J., Hung P. J., and Lee L. P., Biotechnol. Bioeng. 97(5), 1340 (2007). 10.1002/bit.21360 [DOI] [PubMed] [Google Scholar]
- 11. Nakao Y., Kimura H., Sakai Y., and Fujii T., Biomicrofluidics 5(2), 22212 (2011). 10.1063/1.3580753 [DOI] [PMC free article] [PubMed] [Google Scholar]
- 12. Hegde M., Jindal R., Bhushan A., Bale S. S., McCarty W. J., Golberg I., Usta O. B., and Yarmush M. L., Lab Chip 14(12), 2033 (2014). 10.1039/C4LC00071D [DOI] [PMC free article] [PubMed] [Google Scholar]
- 13. Wagner I., Materne E. M., Brincker S., Sussbier U., Fradrich C., Busek M., Sonntag F., Sakharov D. A., Trushkin E. V., Tonevitsky A. G., Lauster R., and Marx U., Lab Chip 13(18), 3538 (2013). 10.1039/c3lc50234a [DOI] [PubMed] [Google Scholar]
- 14. Vulto P., Podszun S., Meyer P., Hermann C., Manz A., and Urban G. A., Lab Chip 11(9), 1596 (2011). 10.1039/c0lc00643b [DOI] [PubMed] [Google Scholar]
- 15. Trietsch S. J., Israels G. D., Joore J., Hankemeier T., and Vulto P., Lab Chip 13(18), 3548 (2013). 10.1039/c3lc50210d [DOI] [PubMed] [Google Scholar]
- 16. Watsky M. A., McDermott M. L., and Edelhauser H. F., Exp. Eye Res. 49(5), 751 (1989). 10.1016/S0014-4835(89)80036-3 [DOI] [PubMed] [Google Scholar]
- 17. Kennedy S. W., Lorenzen A., James C. A., and Collins B. T., Anal. Biochem. 211(1), 102 (1993). 10.1006/abio.1993.1239 [DOI] [PubMed] [Google Scholar]
- 18. Legendre A., Baudoin R., Alberto G., Paullier P., Naudot M., Bricks T., Brocheton J., Jacques S., Cotton J., and Leclerc E., J. Pharm. Sci 102(9), 3264 (2013). 10.1002/jps.23466 [DOI] [PubMed] [Google Scholar]
- 19. Ma B., Zhang G., Qin J., and Lin B., Lab Chip 9(2), 232 (2009). 10.1039/B809117J [DOI] [PubMed] [Google Scholar]
- 20. Török E., Pollok J. M., Ma P. X., Kaufmann P. M., Dandri M., Petersen J., Burda M. R., Kluth D., Perner F., and Rogiers X., Cells Tissues Organs 169(1), 34 (2001). 10.1159/000047858 [DOI] [PubMed] [Google Scholar]
- 21. Ramaiahgari S. C., den Braver M. W., Herpers B., Terpstra V., Commandeur J. N., van de Water B., and Price L. S., Arch. Toxicol. 88(5), 1083 (2014). 10.1007/s00204-014-1215-9 [DOI] [PubMed] [Google Scholar]
- 22. Mueller D., Koetemann A., and Noor F., J. Bioeng. Biomed. Sci. S2, 002 (2011). 10.4172/2155-9538.S2-002 [DOI] [Google Scholar]
- 23. Hsu M. N., Tan G. D., Tania M., Birgersson E., and Leo H. L., Biotechnol. Bioeng. 111(5), 885 (2014). 10.1002/bit.25157 [DOI] [PubMed] [Google Scholar]
- 24. Török E., Lutgehetmann M., Bierwolf J., Melbeck S., Dullmann J., Nashan B., Ma P. X., and Pollok J. M., Liver Transplant. 17(2), 104 (2011). 10.1002/lt.22200 [DOI] [PubMed] [Google Scholar]
- 25. Dash A., Simmers M. B., Deering T. G., Berry D. J., Feaver R. E., Hastings N. E., Pruett T. L., LeCluyse E. L., Blackman B. R., and Wamhoff B. R., Am. J. Physiol.: Cell Physiol. 304(11), C1053–C1063 (2013). 10.1152/ajpcell.00331.2012 [DOI] [PMC free article] [PubMed] [Google Scholar]
- 26. Khetani S. R. and Bhatia S. N., Nat. Biotechnol. 26(1), 120 (2008). 10.1038/nbt1361 [DOI] [PubMed] [Google Scholar]
- 27. Bhatia S. N., Balis U. J., Yarmush M. L., and Toner M., FASEB J 13(14), 1883 (1999). [DOI] [PubMed] [Google Scholar]
- 28. Blieden M., Paramore L. C., Shah D., and Ben-Joseph R., Expert Rev. Clin. Pharmacol. 7(3), 341 (2014). 10.1586/17512433.2014.904744 [DOI] [PubMed] [Google Scholar]
- 29. Mitka M., JAMA, J. Am. Med. Assoc. 311(6), 563 (2014). 10.1001/jama.2014.716 [DOI] [PubMed] [Google Scholar]
- 30. Ullrich A., Berg C., Hengstler J. G., and Runge D., ALTEX 24(1), 35 (2007). [DOI] [PubMed] [Google Scholar]
- 31. Prot J. M., Briffaut A. S., Letourneur F., Chafey P., Merlier F., Grandvalet Y., Legallais C., and Leclerc E., PLoS One 6(8), e21268 (2011). 10.1371/journal.pone.0021268 [DOI] [PMC free article] [PubMed] [Google Scholar]
- 32. Xia L., Ng S., Han R., Tuo X., Xiao G., Leo H. L., Cheng T., and Yu H., Biomaterials 30(30), 5927 (2009). 10.1016/j.biomaterials.2009.07.022 [DOI] [PubMed] [Google Scholar]


