

Abstract
Eosinophilic esophagitis (EoE) requires a peak count of 15 eosinophils per high-power field (hpf). Herein, the peak eosinophil count specified by a pathologist was compared to research assistant’s second review. Of 477 biopsies, 106 had a peak count between 1–14 eosinophils/hpf cited in the pathology report, and 23/106 (22%) had ≥15 eosinophils/hpf on second review. The pathology report detected potential EoE with 99% specificity, but 80% sensitivity. As such, additional review of esophageal biopsies yields higher eosinophil counts in ~5% of cases. We propose that biopsies with a count between 1–14 eosinophils/hpf require further investigation because ~22% may yield a potential EoE diagnosis.
Keywords: diagnosis, eosinophilic esophagitis, pathologist
Introduction
Eosinophilic esophagitis (EoE) is a chronic, relapsing, antigen-induced inflammatory disease characterized by numerous intraepithelial eosinophils in esophageal biopsies. Consensus recommendations for diagnosis include a threshold peak intraepithelial eosinophil count of 15 or more eosinophils per high-power field (hpf) in esophageal biopsies, with the exclusion of other causes of esophageal eosinophilia, such as eosinophilia responsive to a proton pump inhibitor (PPI), and the evaluation of both clinical and pathologic information (1,2).
Over the past decade, we have developed a research database of esophageal samples derived from endoscopic biopsies. For virtually all of our studies, we have re-reviewed esophageal biopsies for eosinophil levels to ensure data integrity. The second review process, conducted after the surgical pathology report has been issued, has progressed to include evaluation of esophageal biopsies by research personnel specifically trained to count intraepithelial eosinophils in esophageal biopsies. We became aware of discrepancies, significant in some cases, between peak intraepithelial eosinophil counts reported by pathologists in the surgical pathology reports and the counts obtained by systematic re-review. Herein, we report that secondary quantification of eosinophils in esophageal biopsies yields higher values, potentially affecting diagnostic outcome in ~5% of the total cases examined. Our data substantiate consideration that biopsies with eosinophil counts between 1–14 eosinophils/hpf may require further investigation because an additional ~22% may yield a potential EoE diagnosis after a second review.
Materials and Methods
Protocol
The full methods are provided in the Supplement. In brief, biopsies were examined by one trained research assistant, who generated a peak intraepithelial eosinophil count (second review) independent of and blinded to the count specified in the surgical pathology report. The research assistant was trained to examine every level of each biopsy present on a slide, identify the area with the greatest concentration of eosinophils, and count cells with nuclei and intensely red cytoplasmic granules to generate a peak eosinophil count. Granules without nuclei were not counted, and only intraepithelial eosinophils were counted; eosinophils in the lamina propria, papillae, and muscularis mucosa were excluded. The correlation between the count obtained by the research assistant and the count obtained by the training pathologist was very strong (rs = 0.99, P < 0.0001) (Supplemental Figure 1) with no significant median difference (P = 0.10).
Results
Reevaluation of esophageal biopsies
We identified 477 biopsies (429 from EoE patients, of which 316 were from PPI confirmed EoE patients) that met the inclusion criteria for this study. There was an overall strong correlation (rs = 0.89, P < 0.0001) between peak eosinophil counts recorded in the pathology report and the second review counts (Figure 1a). Ninety-seven of the 477 biopsies had a peak eosinophil count ≥15 eosinophils/hpf recorded in the pathology report, and 380 had a peak count of <15 eosinophils/hpf in the pathology report. We further divided the peak eosinophil counts in the pathology reports into ranges based on peak number of eosinophils/hpf to demonstrate a discrepancy that exists between pathology report counts and second review counts for all ranges, including small numbers of eosinophils and large numbers of eosinophils (Table 1). We noted that second review counts yielded statistically higher eosinophil counts (P < 0.0001) and that differences between the two reviews were particularly notable for pathology report values of 0–14 eosinophils/hpf and 30–44 eosinophils/hpf (Table 1, Supplemental Figure 2). Of the 274 samples that had a peak eosinophil count of 0 eosinophils/hpf in the pathology report, 212 also had a second review count of 0 eosinophils/hpf. We excluded the 212 samples with 0 eosinophils/hpf recorded in both the pathology report and in the second review and analyzed the pathology reports with values of 0–14 eosinophils/hpf and observed a lower correlation coefficient (0.62) that was still significant (P < 0.0001) for the remaining 168 samples (Figure 1b).
Figure 1. Correlation of pathology report eosinophil counts and second review eosinophil counts.
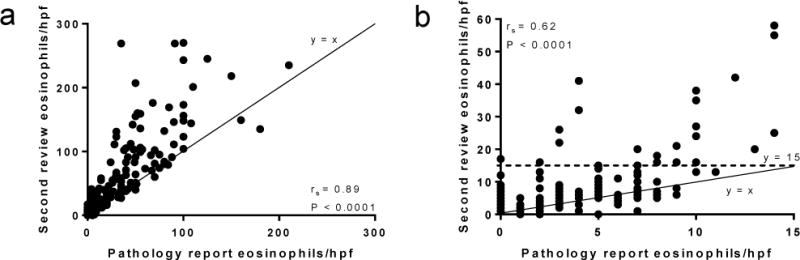
(a) The entire dataset (n = 477) is included. Line y = x represents where the values would be located if the pathology report count and second review count were equivalent. (b) Correlation of pathology report counts vs. second review counts for pathology reports that had counts <15 eosinophils/hpf that were not 0 eosinophils/hpf for both reviews (n = 168). Dotted line y = 15 represents the diagnostic threshold, for which 24 points were at or above after the second review. Line y = x represents where the values would be located if the pathology report count and second review count were equivalent. hpf, high-power field.
Table 1.
The Spearman correlation coefficient, Spearman P value, mean and standard deviation, and median and interquartile range for each range of pathology report counts and the corresponding range of second review counts. The Wilcoxon P value is the result of a matched-pairs signed-rank test.
| Pathology report count ranges (eosinophils/hpf) | Second review count ranges (eosinophils/hpf) | Biopsies1 (n) | Spearman correlation coefficient2 (rs) | Spearman P value2 | Pathology report count mean ± SD1 (eosinophils/hpf) | Second review count mean ± SD1 (eosinophils/hpf) | Pathology report count median (IQR)1 (eosinophils/hpf) | Second review count median (IQR)1 (eosinophils/hpf) | Wilcoxon P value2 |
|---|---|---|---|---|---|---|---|---|---|
| 0 | 0–17 | 274 | N/A3 | N/A3 | 0 ± 0 | 0.8 ± 2 | 0 (0–0) | 0 (0–0) | <0.0001 |
| 1–4 | 0–41 | 48 | 0.39 | 0.003 | 3 ± 1 | 7 ± 8 | 3 (2–4) | 3 (3–7) | <0.0001 |
| 5–14 | 0–58 | 58 | 0.61 | <0.0001 | 8 ± 2 | 13 ± 12 | 7 (6–9) | 8.5 (6–16) | <0.0001 |
| 15–29 | 12–111 | 21 | 0.69 | 0.0003 | 21 ± 4 | 37 ± 25 | 20 (19–25) | 28 (18–49) | 0.0007 |
| 30–44 | 27–269 | 24 | 7 × 10⁻⁴ | 0.50 | 36 ± 4 | 75 ± 51 | 35 (32–40) | 61 (40–99) | <0.0001 |
| 45–59 | 40–207 | 19 | 0.29 | 0.12 | 50 ± 4 | 103 ± 47 | 50 (48–55) | 103 (51–142) | 0.0001 |
| 60–89 | 60–176 | 16 | 0.28 | 0.14 | 75 ± 8 | 100 ± 35 | 75 (69–80) | 87.5 (75–125) | 0.004 |
| 90–210 | 104–270 | 17 | 0.17 | 0.26 | 119 ± 35 | 181 ± 56 | 100 (100–138) | 156 (140–239) | 0.0005 |
Of the specified range
Of pathology report counts and second review counts
Spearman correlation coefficients cannot be calculated for values located within a vertical line.
hpf, high-power field; IQR, interquartile range; SD, standard deviation.
Potential clinical relevance of eosinophil count discrepancies
We specifically focused on the 106 cases in which peak eosinophil counts were 1–14/hpf in the pathology report. Second review resulted in a count of ≥15 eosinophils/hpf for 23/106 biopsies (22%). Of the entire dataset (n = 477), only one (1%) of the 97 biopsies with pathology reports with ≥15 eosinophils/hpf had a second review count of <15 eosinophils/hpf (Supplemental Table 1). In contrast, 24/380 (6%) of the slides with pathology report counts <15 eosinophils/hpf had a second review count of ≥15 eosinophils/hpf (Supplemental Table 1), including one (0.4%) of the 274 biopsies with 0 eosinophils/hpf that had ≥15 eosinophils/hpf after the second review. Sixty-two slides with a pathology report count of 0 eosinophils/hpf had second review counts >0 ranging from 1–17 eosinophils/hpf.
Predictive value of final surgical pathology report counts
Pathology reports detected EoE with 80% sensitivity and 99% specificity (Supplemental Table 1). The positive predictive value was approximately 99%, whereas the negative predictive value was 94% (Supplemental Table 1). Inaccuracies between pathology report counts and second review counts were noted among pathology reports generated by all 9 pathologists.
Discussion
After retrospectively investigating a dataset comprised of esophageal biopsies, we determined that “negative” surgical pathology reports met the histologic criterion for EoE (i.e. ≥15 eosinophils/hpf) in approximately 5% of the total cases examined. This study emphasizes the degree of variation in eosinophil counts even at a major medical center where referral for and diagnosis of EoE is routinely made. Specifically examining counts close to the consensus diagnostic cutoff value of 15 eosinophils/hpf (1,2), we found a substantial percentage of false-negative results. Although biopsies with <15 eosinophils/hpf may be the result of GERD or PPI-responsive eosinophilia, these diagnostic inaccuracies may amount to a considerable number of undiagnosed cases in the patient population at large.
The focus of our study was the eosinophil counts and how discrepant counts could affect the diagnosis of EoE; we did not consider clinical criteria in this study but for many of the study subjects, the diagnosis was EoE based on both clinical and pathologic criteria. Since our focus was eosinophil counts, the only histologic information extracted from the pathology report was an exact peak eosinophil count; information about other histologic findings such as basal cell hyperplasia, increased lymphocytes and elongated papillae was not extracted.
It is important to point out that EoE is a clinicopathologic disease even though this study mainly focused on pathology. To determine the clinical significance of these findings, we examined the clinical characteristics of the patients who were shown to have eosinophils above the EoE diagnostic threshold of at least 15 eosinophils/hpf (SDC Table 1) even though their clinical counts did not. Of these cases, nearly all (22/24) were patients previously diagnosed with EoE. Of these 22 EoE cases, 19/22 cases (86%) had PPI confirmed EoE. It is interesting to note that the patients were treated as they were indeed in EoE remission (SDC Table 1). Thus, the identified cases in this study represent bona-fide EoE, adding clinical value to the findings.
The consensus guidelines have postulated a number of explanations for the interobserver discrepancies that have led to difficulties in standardizing the optimal method by which to make a histologic diagnosis (1–5). Causes of variability include size of the hpf, reporting of peak versus average eosinophils/hpf, selection of the region with the highest eosinophil density, and the number of areas per slide reviewed. While these variables may be significant causes of inter-institution variability, we attempted to minimize their affect in this study by addressing each potential cause for discrepancy individually in a single institution. Regarding the size of the hpf, the second review counts were obtained using an hpf with an area similar to, if not smaller than, that used to obtain the pathology report counts. Although recent consensus guidelines also recommend reporting densities in mm2 rather than eosinophils/hpf (3,5), we could not do so due to the retrospective nature of this study. We used peak eosinophils/hpf rather than mean values, as recent consensus guidelines recommend selecting the peak counts due to the patchy nature of eosinophil distribution in EoE (2,6,7). Selecting the region with highest eosinophil density and determining the number of areas per slide to review remain practical issues in that they are dependent upon observer judgment and time constraints. In some of the discrepant cases that we found through our review, only a few hpfs of esophageal sections had ≥15 eosinophils/hpf due to the patchy distribution of eosinophils. This characteristic patchiness of EoE can be particularly problematic during histologic review if not all of the sections or areas of the esophageal biopsies are examined to determine a true peak count from the most eosinophil-inflamed area. An alternative explanation for the observed discrepancies, which has not been extensively addressed in the literature, involves the volume of slides that pathologists are required to evaluate per day. With limited time to review multiple areas on each slide, a greater volume of samples may increase the error rate substantially. Furthermore, there is no pathology service solely dedicated to evaluating histologic samples from EoE patients.
In conclusion, additional review of esophageal biopsies yields higher eosinophil values, potentially affecting clinical diagnostic outcome in ~5% of the total slides examined. We propose that biopsies with eosinophil counts between 1–14 eosinophils/hpf should be considered for additional investigation because ~22% are likely to yield a diagnosis of EoE after additional review (Figure 2). Due to the considerable impact that peak eosinophil counts have both at diagnosis and during therapy, pathologists should strongly consider re-reviewing esophageal biopsies for which they report peak eosinophil counts from 1–14/hpf to confirm the accuracy of the count before issuing a final report. Furthermore, clinicians should not dismiss patients with eosinophil counts between 1–14 eosinophils/hpf, but rather flag them and consider both clinical and pathologic aspects of the individual case, including adequacy and compliance of PPI therapy, gross endoscopic findings, clinical symptoms and re-review of the pathologic specimens.
Figure 2. Potential testing algorithm for stratifying need of second review for eosinophilic esophagitis.
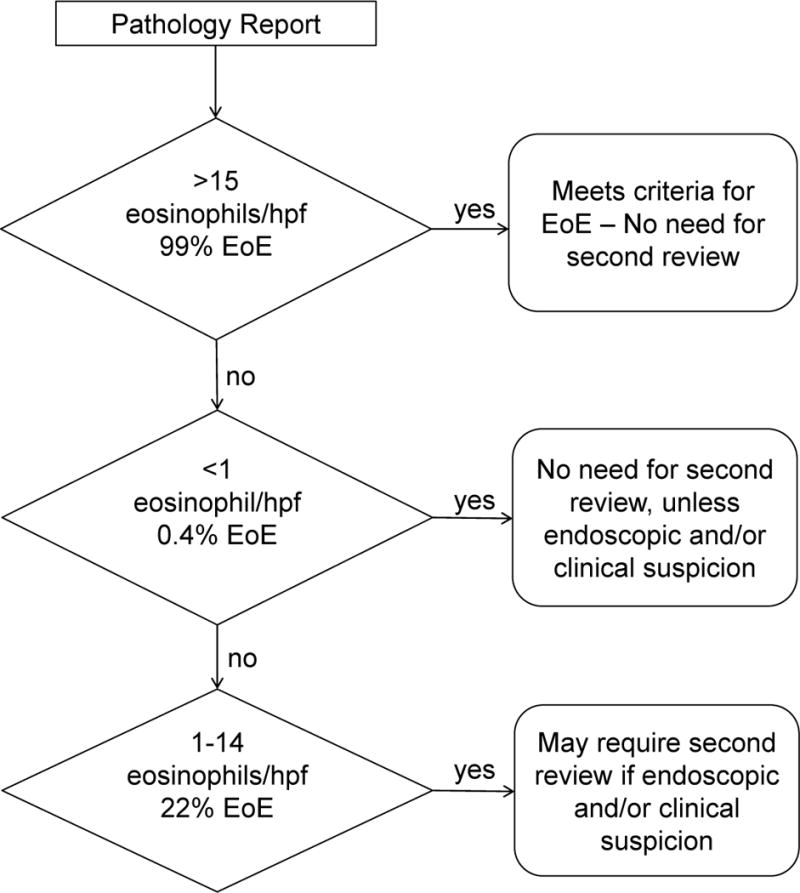
The percentage of cases found to be eosinophilic esophagitis (EoE) on second review are reported under the corresponding pathology report count ranges as shown.
Supplementary Material
Acknowledgments
We would like to thank all of the participating patients and Annette Ahrens, Michael Eby, and Tommie Grotjan for their assistance with patient enrollment and CCED database management. We also thank Shawna Hottinger for editorial assistance.
Sources of Funding: MER is a consultant for Immune Pharmaceuticals, Celsus Pharmaceuticals, Novartis, and Receptos; he has stock equity in Immune Pharmaceuticals, Celsus Pharmaceuticals, and Receptos and royalties from Teva Pharmaceuticals for reslizumab. MHC is a consultant for Meritage Pharma, Novartis, Receptos, Regeneron and Biogen Idec. This study was supported by the National Institutes of Health grants U19 AI070235 and U19 AI066738 and R37 A1045898, the Campaign Urging Research for Eosinophilic Disorders (CURED), Sunshine Charitable Foundation and its supporters, Denise A. Bunning and David G. Bunning, and the Buckeye Foundation.
Abbreviations used
- CCED
Cincinnati Center for Eosinophilic Disorders
- CCHMC
Cincinnati Children’s Hospital Medical Center
- EoE
eosinophilic esophagitis
- hpf
high-power field
- IQR
interquartile range
- PPI
proton pump inhibitor
- rs
Spearman correlation coefficient
Footnotes
Conflicts of Interest
No conflicts of interest were declared for the remaining authors.
Author Contributions: EMS, MHC and MER were involved in the study concept and design. EMS, KEC, MHC and CJH were involved in the acquisition of data. EMS, MHC, CJH, LJM and MER participated in the analysis of data. EMS, KEC, MHC and MER participated in the interpretation of data and writing the manuscript. MHC, CJH, LJM and MER were involved in the critical revision of the manuscript. MER supervised the study.
References
- 1.Liacouras CA, Furuta GT, Hirano I, et al. Eosinophilic esophagitis: updated consensus recommendations for children and adults. J Allergy Clin Immunol. 2011 Jul;128(1):3–20.e26. doi: 10.1016/j.jaci.2011.02.040. quiz 21–22. [DOI] [PubMed] [Google Scholar]
- 2.Furuta GT, Liacouras CA, Collins MH, et al. Eosinophilic esophagitis in children and adults: a systematic review and consensus recommendations for diagnosis and treatment. Gastroenterology. 2007 Oct;133(4):1342–1363. doi: 10.1053/j.gastro.2007.08.017. [DOI] [PubMed] [Google Scholar]
- 3.Sperry SL, Shaheen NJ, Dellon ES. Toward uniformity in the diagnosis of eosinophilic esophagitis (EoE): the effect of guidelines on variability of diagnostic criteria for EoE. Am J Gastroenterol. 2011 May;106(5):824–832. doi: 10.1038/ajg.2011.10. quiz 833. [DOI] [PubMed] [Google Scholar]
- 4.Dellon ES, Fritchie KJ, Rubinas TC, et al. Inter- and intraobserver reliability and validation of a new method for determination of eosinophil counts in patients with esophageal eosinophilia. Dig Dis Sci. 2010 Jul;55(7):1940–1949. doi: 10.1007/s10620-009-1005-z. [DOI] [PMC free article] [PubMed] [Google Scholar]
- 5.Dellon ES, Aderoju A, Woosley JT, et al. Variability in diagnostic criteria for eosinophilic esophagitis: a systematic review. Am J Gastroenterol. 2007 Oct;102(10):2300–2313. doi: 10.1111/j.1572-0241.2007.01396.x. [DOI] [PubMed] [Google Scholar]
- 6.Parfitt JR, Gregor JC, Suskin NG, et al. Eosinophilic esophagitis in adults: distinguishing features from gastroesophageal reflux disease: a study of 41 patients. Mod Pathol. 2006 Jan;19(1):90–96. doi: 10.1038/modpathol.3800498. [DOI] [PubMed] [Google Scholar]
- 7.Odze RD. Pathology of eosinophilic esophagitis: what the clinician needs to know. Am J Gastroenterol. 2009 Feb;104(2):485–490. doi: 10.1038/ajg.2008.40. [DOI] [PubMed] [Google Scholar]
Associated Data
This section collects any data citations, data availability statements, or supplementary materials included in this article.