

Abstract
Objective
HIF-1/HRE pathway is a promising target for the imaging and the treatment of intractable malignancy (HIF-1; hypoxia-inducible factor 1, HRE; hypoxia-responsive element). The purposes of our study are: (1) to assess the gene activation levels resulting from various numbers of HREs under various hypoxic conditions, (2) to evaluate the bidirectional activity of multiple HREs, and (3) to confirm whether multiple HREs can induce gene expression in vivo.
Methods
Human colon carcinoma HCT116 cells were transiently transfected by the constructs containing a firefly luciferase reporter gene and various numbers (2, 4, 6, 8, 10, and 12) of HREs (nHRE+, nHRE−). The relative luciferase activities were measured under various durations of hypoxia (6, 12, 18, and 24 h), O2 concentrations (1, 2, 4, 8, and 16 %), and various concentrations of deferoxamine mesylate (20, 40, 80, 160, and 320 µg/mL growth medium). The bidirectional gene activation levels by HREs were examined in the constructs (dual-luc-nHREs) containing firefly and Renilla luciferase reporter genes at each side of nHREs. Finally, to test whether the construct containing 12HRE and the NIS reporter gene (12HRE-NIS) can induce gene expression in vivo, SPECT imaging was performed in a mouse xenograft model.
Results
(1) gene activation levels by HREs tended to increase with increasing HRE copy number, but a saturation effect was observed in constructs with more than 6 or 8 copies of an HRE, (2) gene activation levels by HREs increased remarkably during 6–12 h of hypoxia, but not beyond 12 h, (3) gene activation levels by HREs decreased with increasing O2 concentrations, but could be detected even under mild hypoxia at 16 % O2, (4) the bidirectionally proportional activity of the HRE was confirmed regardless of the hypoxic severity, and (5) NIS expression driven by 12 tandem copies of an HRE in response to hypoxia could be visualized on in vivo SPECT imaging.
Conclusion
The results of this study will help in the understanding and assessment of the activity of multiple HREs under hypoxia and become the basis for hypoxia-targeted imaging and therapy in the future.
Keywords: Hypoxia-responsive element (HRE), Reporter genes, Tumor hypoxia, Molecular imaging, Gene therapy
Introduction
In tumor cells at low oxygen levels, genetic response to hypoxia is initiated by binding of hypoxia-inducible factor-1 (HIF-1), which is a major transcriptional activator of hypoxia-regulated genes, to hypoxia-responsive elements (HREs), which are transcription enhancers located in the promoter regions of hypoxia-regulated genes such as erythropoietin (Epo) and vascular endothelial growth factor (VEGF) genes [1, 2]. Tumor cells are thought to acquire resistance to radiotherapy and chemotherapy as the result of a cascade of expression of various hypoxia-regulated genes [3]. Therefore, the HIF-1/HRE system of gene regulation is a promising target for the imaging and treatment of intractable malignancy [4, 5].
Multiple copies of HREs have been synthesized and applied in in vivo experiments for imaging reporter gene expression in response to hypoxia [6–8] and for hypoxia-targeted gene therapy [9–11]. The correlation between hypoxia and gene activation levels by such multiple HREs has to rely upon in vitro experiments of cell cultures, because there is no appropriate method to evaluate hypoxia in essentially inhomogeneous tumor masses. However, basic reports on the in vitro assessment of gene activation levels by multiple HREs under various hypoxic conditions are limited (Table 1) [12–14]. Although the results of these studies agree that the VEGF HRE has the highest potential for gene activation, the effect of HRE copy number on gene activation remains controversial. Shibata et al. [12] have suggested that the saturated hypoxia responsiveness of ten copies of an HRE is similar to that of five copies, but Ruan et al. [13] reported that hypoxic induction of gene expression by nine copies was approximately three times higher than from six copies. Moreover, Post et al. [14] demonstrated that six copies had less than half the hypoxic activity of five copies in some experiments. Therefore, the primary purpose of our study was to assess gene activation levels resulting from various numbers of HREs (2, 4, 6, 8, 10, and 12). In addition, in contrast to the previous studies, which used single fixed hypoxia durations and, at most, O2 concentration of 5 or 10 %, we tested HRE gene activation under various durations of hypoxia (6, 12, 18, and 24 h) and hypoxic O2 concentrations (1, 2, 4, 8, and 16 % O2). Furthermore, Post et al. [14] investigated the bidirectional function of the HRE only as a classical enhancer element; however, their results seemed to be erroneous based on the wide variation in HRE background activity observed under normoxia.
Table 1.
Previous and current reports on in vitro assessment of gene activation levels by multiple HREs under various hypoxic conditions
| First author | HRE origin | HRE copy number | Direction of HRE | O2 concentration (%) | Hypoxia duration (h) |
|---|---|---|---|---|---|
| Dachs [4] | mPGK | 3 | Sense | 0, 0.1, 1, 2, 5 | 16 |
| Shibata [12] | hVEGF | 3, 5, 10 | Sense | 0.02, 0.2, 1, 2, 5 | 6 |
| Ruan [13] | hEPO | 3, 6, 9 | Sense | 0, 0.3, 1 | 16 |
| Post [14] | hVEGF, hEPO | 1, 2, 3, 4, 5, 6 | Bidirectional | 1, 3, 5, 10 | 48 |
| Current study | hVEGF | 2, 4, 6, 8, 10, 12 | Sense, antisense, bidirectional | 1, 2, 4, 8, 16 | 6, 12, 18, 24 |
HRE hypoxia-responsive element, mPGK mouse phosphoglycerate kinase-1, hVEGF human vascular endothelial growth factor, hEPO human erythropoietin
Therefore, in this study we aimed to assess the bidirectional activity of multiple HREs in tandem and to demonstrate the feasibility of SPECT imaging of tumor hypoxia in living mice using a plasmid containing 12 tandem copies of HREs (12HRE) combined with a human sodium/iodide symporter (NIS) reporter gene, which encodes a membrane protein that transports (radio)iodide and 99mTcO4− into cells [15].
Materials and methods
Plasmid construction
A 35-bp fragment containing an HIF-1 recognition sequence from the human VEGF gene was synthesized (5′-CCA CAG TGC ATA CGT GGG CTC CAA CAG GTC CTC TT-3′) [16]. Two copies of this fragment (2HRE) were tandemly ligated using a 5-nucleotide linker and were inserted up to six times into the pGL4.26 vector (Promega, Madison, WI, USA), which contains a synthetic firefly luciferase gene (Luc2), a minimal promoter (MinP), and a hygromycin B phosphotransferase gene, at a HindIII site in the multiple cloning site (MCS) in either a sense (nHRE+) or antisense (nHRE−) orientation with respect to the Luc2 gene (Figs. 1, 2, 3).
Fig. 1.

Relative luciferase activity of various numbers of HREs under various durations of hypoxia (1 % O2). Left HRE in sense orientation with respect to the Luc2 gene (nHRE+); right HRE (nHRE−) in antisense orientation with respect to the Luc2 gene. A schema of the constructs is attached on top
Fig. 2.

Relative luciferase activity of various numbers of HREs under various concentrations of DFO stress. Left HRE in sense orientation with respect to the Luc2 gene (nHRE+); right HRE in antisense orientation with respect to the Luc2 gene (nHRE−). A schema of the constructs is attached on top
Fig. 3.
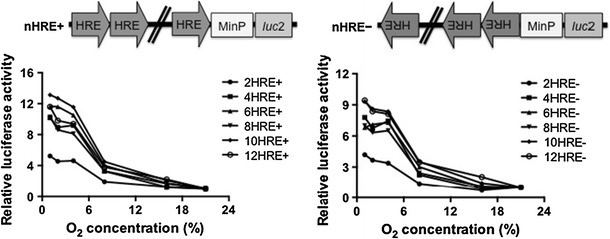
Relative luciferase activity of various numbers of HREs under various hypoxic O2 concentrations. Left HRE in sense orientation with respect to the Luc2 gene (nHRE+); right HRE in antisense orientation with respect to the Luc2 gene (nHRE−). A schema of the constructs is attached on top
It is difficult to directly compare the gene activation levels obtained from different experiments, because the Renilla luciferase activity used as a control for transfection efficiency to normalize firefly luciferase activity varied considerably among experiments. Thus, we also generated vector constructs (dual-luc-nHREs) containing firefly and Renilla luciferase reporter genes at each side of various numbers (2, 4, 6, 8, 10, and 12) of HREs to directly compare the bidirectional gene activation levels by multiple HREs. A Renilla luciferase gene (Rluc2) excised from pRL-TK vector (Promega) was first used to replace the Luc2 gene in the pGL4.26 vector, and then a HindIII-BamHI fragment from this construct containing the minimal promoter and Renilla luciferase gene was cloned into the HindIII site in the MCS of the nHRE− vectors, so that the two sequences from each end of the repeat HRE to the start codons of the two luciferase genes were identical (dual-luc-nHRE, Fig. 4).
Fig. 4.

Ratio of bidirectional activity of various numbers of HRE under various hypoxic conditions. Left DFO stress; Right hypoxic gas stress. Dotted lines indicate the regression line for data of 12HRE; y = 0.0004x + 1.06 (left), y = 0.0125x + 0.744 (right). A schema of the constructs is attached on top
To determine whether multiple HREs can induce gene expression in vivo in response to hypoxia, we generated a vector construct containing 12HRE and the NIS reporter gene (pGL4-12HRE-NIS). To construct pGL4-12HRE-NIS, a human NIS cDNA (GenBank: NM000453) was synthesized by polymerase chain reaction [17] and used to replace the firefly luciferase gene in the 12HRE− vector (Fig. 5). Sequence analysis was performed to confirm the nucleotide sequences and the directions of the inserted fragments in all vector constructs.
Fig. 5.

Results of in vitro 99mTcO4 − uptake assay (top right) and representative in vivo 99mTcO4 − SPECT images (bottom). In the bar graph, the numbers indicate the mean 99mTcO4 − uptake levels, and the error bars represent the standard deviations. In the bottom figure, fusion (coronal) and SPECT (MIP) views in each image set were made from the same mouse. A schema of the constructs is attached on the top left
Cell culture and hypoxic conditions
Human colon carcinoma HCT116 cells (American Type Culture Collection, Manassas, VA, USA) were cultured in DMEM/F-12 (Life Technologies, Carlsbad, CA, USA) supplemented with 10 % fetal bovine serum and antibiotics (50 IU of penicillin and 50 µg/mL of streptomycin) in a humidified tri-gas incubator (HeraCell; Thermo Scientific, Waltham, MA, USA) at 37 °C with 5 % CO2. O2 concentrations were electronically controlled by the incubator. Hypoxia-like chemical stress was induced by DFO (Calbiochem, San Diego, CA, USA) dissolved in the culture medium.
Luciferase assay
Twenty-four hours after seeding at 2 × 10⁵ cells/well in 6-well plates, cells were transiently transfected using the Lipofectamine 2000 reagent (Life Technologies) according to the manufacturer’s protocol. The nHRE+ and nHRE− vectors were co-transfected with pRL-SV40 (Promega) as a control vector for transfection efficiency, because in preliminary experiments we found that the expression of pRL-SV40 was less influenced by hypoxia than pRL-TK (Promega) and pRL-CMV (Promega) were. On the other hand, dual-luc-nHRE vectors containing both firefly and Renilla luciferases were transfected on their own. Twelve hours later, the culture dishes were washed in growth medium twice and cells were exposed to hypoxic conditions (1, 2, 4, 8, and 16 % O2 or DFO 20, 40, 80, 160, and 320 µg/mL growth medium). Immediately after hypoxic stress, cell lysates were prepared with 250 µL of passive lysis buffer using the Dual Luciferase Assay kit (Promega), and luciferase activities were measured with a luminometer according to the manufacturer’s protocol. The results were expressed as the relative ratio of firefly luciferase activity to Renilla luciferase activity for correction of transfection efficiency in experiments using nHRE+ and nHRE−, and as the ratio of bidirectional activity in experiments using dual-luc-nHRE. These experiments were performed in triplicate.
Stable cell lines
The day after seeding a density of 1 × 10⁶ cells/10 cm dish, cells were transfected with pGL4-12HRE-NIS by the calcium phosphate coprecipitation method (pH 7.12) as previously described [18]. For clonal selection, cells were cultured in the presence of 1000 µg/mL of Hygromycin B (Life Technologies). Drug-resistant colonies were isolated and expanded for Western blotting for NIS protein as previously described [15]. Stable cell lines were established by the confirmation of significant NIS protein expression under hypoxia (1 % O2) for 12 h [19].
In vitro 99mTcO4− uptake assay
NIS protein function was tested by an in vitro 99mTcO4− uptake assay as previously described [19]. Briefly, 24 h after seeding at 5 × 10⁴ cells/well on 24-well plates, the cells were incubated under hypoxic (1 % O2) or normoxic (21 % O2) conditions for 12 h. Then the cells were incubated in medium supplemented with 3.7 kBq/well of 99mTcO4− for 30 min, washed gently and quickly twice with ice-cold HBSS (Life Technologies) after the medium was removed, and lysed with 0.5 mL of 0.1 N NaOH. In vitro 99mTcO4− uptake levels were measured with a gamma-counter and represented as the percentage of radioactivity in the cell lysates relative to the total radioactivity added. These experiments were performed in triplicate.
Mouse subcutaneous xenograft model
All animals were treated humanely in compliance with the “Guide for the Care and Use of Laboratory Animals” formulated by the US National Research Council [20], and this study was conducted in accordance with our institutional “Guide for the Care and Use of Laboratory Animals” (publication no. 7–35, revised in 2011). Twelve male BALB/c nu/nu nude mice (6 weeks old, Japan SLC, Hamamatsu, Japan) were fed the commercial diet MB-1 (Funabashi farm, Funabashi, Japan) that was not supplemented with iodine. Mice were injected subcutaneously into the right flank with a cell suspension (3 × 10⁶ cells/100 µL PBS) of either 12HRE-NIS stably transfected or non-transfected HCT116 cells. In vivo SPECT/computed tomography (CT) imaging was performed approximately 3 weeks later when the xenograft diameter reached 5 mm, because preliminary pathological examinations showed that the xenografts often showed central cell death, probably due to spontaneous intratumoral hypoxia, when the diameter exceeded 5 mm.
In vivo SPECT/CT imaging
In vivo SPECT imaging was performed in the mouse subcutaneous xenograft model to visualize the NIS expression induced by 12HRE in response to spontaneous intratumoral hypoxia in vivo. SPECT images were obtained for 90 min, starting at 30 min after the intravenous injection of 99mTcO4− (74 MBq) and pimonidazole (Hypoxyprobe-1; HPI Inc., Burlington, MA, USA) at a dose of 60 µg/g body weight, using a small-animal SPECT/CT system FX with a single-pinhole PH10 collimator (Gamma Medica-Ideas, Northridge, CA, USA) as described previously [21]. CT images were acquired for anatomical orientation with the same positioning as for the SPECT imaging. Both SPECT and CT image data were reconstructed as tomographic images without attenuation correction, coregistered automatically, and displayed using maker-supplied software. Fusion (coronal) view displayed coronal sections of a color-scaled SPECT image overlaid on a gray-scaled CT image. SPECT (MIP) view displayed a maximum intensity projection (MIP) of SPECT image coregistered with a 3D volume-rendering CT image of the bone density.
Immunohistochemistry
The specimens were fixed in formalin and sliced into 4 µm adjacent sections using a standard microtome. Paraffin sections were immunostained with mouse monoclonal Hypoxyprobe-1 MAb1 antibody (HPI Inc., Burlington, MA, USA), or mouse monoclonal anti-human NIS antibody (clone FP5A; Lab Vision, Fremont, CA, USA) after antigen retrieval. Then, the sections were washed in TBS, incubated with the secondary antibody (ENVISION mouse HRP; Dako Japan), and stained with 3,3′-diaminobenzidine (Dako Japan) according to the manufacturer’s instructions. Slides were counterstained with Mayer’s hematoxylin.
Statistical analysis
Linear regression analysis was used to assess correlations between hypoxic severity and the ratio of the bidirectional activities of multiple HREs. Two-way ANOVA and Bonferroni post-tests were used to compare 99mTcO4− uptake in cell lines under hypoxic and normoxic conditions. All statistical analyses were performed using Prism 6 for Mac OS X (GraphPad Software, La Jolla, CA, USA). A p value less than 0.05 was considered to be statistically significant.
Results
Gene activation levels by various numbers of HREs under various durations of hypoxia
The expression of the firefly luciferase reporter gene induced by various numbers (2, 4, 6, 8, 10, and 12) of HREs was assessed after hypoxic stress at 1 % O2 during four different test periods (6, 12, 18, and 24 h; Fig. 1). All the constructs were found to induce reporter gene expression in response to hypoxia. The relative luciferase activities under various durations of hypoxia ranged from three times to 85 times higher than those under normoxia and tended to gradually increase with increasing HRE copy number. The results may appear somewhat erroneous, probably due to various small unavoidable errors in the urgent experimental procedures, such as the volume of culture medium in each well, the number of harvested cells from each well, transient changes in oxygen levels of the hypoxic chamber by opening/closing the door, and so on. Yet, our results seem to be less erroneous compared with previous studies [12–14].
Regarding hypoxia duration, the relative luciferase activities of all the constructs increased remarkably during 6–12 h of hypoxia, but not beyond 12 h. This was probably because HREs responded to hypoxia rapidly, but the synthesis of luciferase took several hours.
Gene activation levels by various numbers of HREs under various concentrations of deferoxamine mesylate (DFO)
The gene activation levels by various numbers (0, 4, 6, 8, 10, and 12) of HREs were assessed under hypoxia-like chemical stress using various concentrations of DFO (20, 40, 80, 160, and 320 µg/mL growth medium) dissolved in the culture medium for 12 h. (Fig. 2). Gene activation levels by HREs showed similar patterns of response to the hypoxia-like chemical stress in both directions. The expression levels of the reporter gene tended to increase with increasing HRE copy number, but a saturation effect was seen in constructs with more than 6 or 8 copies of HREs. The expression levels of the reporter gene increased with increasing DFO concentration, although data were somewhat erroneous at 320 µg/mL of DFO concentration because some of the cells started to die at this concentration.
Gene activation levels by various numbers of HREs under various O2 concentrations
The gene activation levels by various numbers (0, 4, 6, 8, 10, and 12) of HREs were also assessed under hypoxic conditions with various O2 concentrations (1, 2, 4, 8, and 16 % O2) for 12 h (Fig. 3). The expression levels of the reporter gene decreased with increasing O2 concentration, but could be detected at low levels even under mild hypoxia at 16 % O2 with high numbers of HREs. Compared to the experiment using DFO, this result appeared much erroneous at low O2 concentration (e.g., 1, 2, 4 %). The reason is probably an indirect influence of hypoxic gas as mentioned above.
Bidirectional gene activation levels by various numbers of HREs under various hypoxic conditions
We measured the ratios of the bidirectional gene activation levels from the vector constructs containing firefly and Renilla luciferase reporter genes at each side of various numbers (2, 4, 6, 8, 10, and 12) of HREs (dual-luc-nHREs) under hypoxia-like chemical stress using various DFO concentrations (20, 40, 80, 160, 320 µg/mL growth medium) for 12 h and under hypoxic conditions with various O2 concentrations (1, 2, 4, 8, and 16 % O2) for 12 h (Fig. 4). Linear regression analyses indicate that the ratio of the bidirectional activity of HRE was almost a constant of 1, regardless of the hypoxic severity.
Application of a 12HRE-NIS reporter construct for in vivo SPECT imaging of tumor hypoxia
In a preliminary in vitro 99mTcO4− uptake assay, we confirmed that cells stably transfected with pGL4-12HRE-NIS show up to 17 times higher 99mTcO4− uptake under hypoxia as under normoxia, whereas the non-transfected negative control cells showed little 99mTcO4− uptake regardless of oxygen conditions (Fig. 5). In in vivo SPECT imaging of mouse subcutaneous xenograft models, NIS expression induced by 12HRE in response to spontaneous intratumoral hypoxia was visualized as a focal 99mTcO4− uptake in all xenografts of 12HRE-NIS transfected cells (SUVmax = 1.86 ± 0.11), but in none of the non-transfected negative control cells (SUVmax = 0.16 ± 0.02) (Fig. 5). We also performed immunohistochemical staining of the xenografts with NIS antibody and pimonidazole and confirmed expression of NIS in accordance with staining with pimonidazole as a conventional gold standard of tissue hypoxia at the central area of the xenograft sections (Fig. 6). No prominent central necrosis (cell death) was observed in any sections.
Fig. 6.

Representative staining images of xenograft. Left Hematoxylin–eosin staining; center immunohistochemical staining of pimonidazole; right immunohistochemical staining of NIS. Bars indicate 1 mm
Discussion
In the current study, we assessed gene activation levels by multiple HREs under various hypoxic conditions in vitro. The findings in this study were as follows: (1) gene activation levels tended to increase with increasing HRE copy number, but saturation was observed in constructs with more than 6 or 8 copies of the HRE, (2) gene activation levels by the HRE increased remarkably during 6–12 h of hypoxia, but not beyond 12 h, (3) gene activation levels by the HRE decreased with increasing O2 concentrations, but could be detected even under mild hypoxia in 16 % O2, (4) the bidirectionally proportional activity of the HRE was confirmed regardless of the hypoxic conditions, and (5) NIS expression upregulated by 12HRE in response to tumor hypoxia could be visualized in in vivo SPECT imaging.
These findings suggest that all the constructs containing 6 or 8–12 HREs could be candidates for in vivo SPECT imaging of genetic response to hypoxia. With regard to bidirectional gene activation of the HRE, enhancers are generally known to activate genes on both sides, unless an insulator between the enhancer and its target gene impedes the activation, but the mechanism has not been clarified yet [22]. Our findings (Figs. 1, 2, 3) suggested there were no big differences in the gene activation levels between HRE+ (sense orientation) and HRE− (antisense orientation). More importantly, our results guaranteed the proportionality of the bidirectional activity of the HRE, regardless of hypoxic severity, for its potential application to combinations of (1) a therapeutic gene and a reporter gene, for monitoring gene therapy [23] and (2) two different reporter genes, for multimodal imaging (e.g., optical imaging, single-photon emission computed tomography [SPECT], positron emission tomography [PET], and magnetic resonance imaging [MRI]) [24, 25], or (3) two different therapeutic genes for synergetic effect in multimodal therapy [26].
The reason for using the NIS radionuclide reporter gene instead of the firefly luciferase gene in in vivo imaging was that optical imaging is more affected by signal attenuation and tissue scattering, and thus is less sensitive and less quantitative in the living animal body than radionuclide imaging [27]. Among several radionuclide reporter genes, NIS has many advantages; various radioactive iodides (123I, 124I, 125I, 131I) and pertechnetate (99mTcO4−) are available as its reporter probe depending on imaging modalities; this avoids the troublesome problems of tracer synthesis, labeling stability, and metabolites. For future clinical applications of reporter gene imaging in humans, we believe such non-toxic and non-immunogenic methods using human-oriented genes will be essential [15].
The rationale for using 12HRE in SPECT imaging in spite of the saturation effect seen when using more than 6 or 8 copies of HREs was that tandem repeat DNA sequences are commonly known to be unstable and, consequently, the number of repeats may decrease during DNA replication, repair, and recombination in vivo [28, 29]. Therefore, we thought that a higher HRE copy number would be able to induce high gene activation more stably in vivo than 6HRE or 8HRE, even though the in vitro gene activation levels were the same.
One of the limitations of this study was the use of only a single cell line. Since it has been reported that the absolute expression levels of HIF-1 are different among cancer cell lines [30], further studies using different cell lines will be interesting to explore the relationship between the expression of HIF-1 and gene activation by HRE. In the current methodological study, however, we needed to compare the gene activation levels by various numbers of HRE under various hypoxic conditions in a constant experimental setting with a fixed cell line. Another limitation was lack of the measurement of HIF-1, for example, by immunohistochemistry or Western blotting. However, we did not assume that HIF-1 levels at the time of killing correlate with gene activation levels by multiple HREs, because (1) intratumoral blood flow and thus the HIF-1 levels must dynamically change, and (2) the gene activation by multiple HREs is a consequence for some duration of hypoxia with a time lag for protein synthesis [31, 32]. In addition, the measurement of HIF-1 is technically difficult due to the structural instability [18].
For future research into the use of multiple HREs, we have started a research project to characterize hypoxia-targeted radiotracers that have been used for PET imaging in humans. There are two categories of hypoxia-targeted PET tracers: the fluorine-radiolabeled nitroimidazole derivatives such as [18F]fluoromisonidazole (FMISO) [33] and the copper-radiolabeled dithiosemicarbazone complexes such as 60/62Cu-diacetyl-bis(N4-methylthiosemicarbazone) (ATSM) [34] These PET tracers are all retained in hypoxic cells because of their low redox potential, and the levels of their tumor accumulation are known to be related to the prognosis. Nevertheless, both categories of PET tracers have been also reported to show different intratumoral distributions [35, 36]. To realize an effective hypoxia-targeted intensity-modulated radiotherapy (IMRT), the intratumoral distributions of the two categories of PET tracers representing true tumor hypoxia related to treatment resistance need to be determined. Therefore, we are planning to utilize the mouse subcutaneous xenograft model of 12HRE-NIS for comparison of the uptake regions of the hypoxia PET tracers with those of 99mTcO4− (or 124I) as the gold standard of genetic response to hypoxia leading to therapy resistance.
In conclusion, the results of this study will help to achieve a multilateral understanding and assessment of the hypoxic activities of multiple HREs and will become the basis for hypoxia-targeted imaging and therapy in the future.
Acknowledgments
We thank Prof. Masanori Hatakeyama of the University of Tokyo and Prof. Hideaki Higashi of Hokkaido University for technical guidance in molecular biology. We also thank SII NanoTechnology Inc. for providing us the small-animal SPECT/CT system. This work was supported in part by KAKENHI Grants-in-Aid for Scientific Research (B) (General) (M.I: No. 18390326, 22390239, 26293282; Y.K: No. 22390377, 25293406) from the Ministry of Education, Culture, Sports, Science and Technology (MEXT), Japanese Government, and for Challenging Exploratory Research (M.I: No. 24659140) from Japan Society for the Promotion of Science (JSPS).
Conflict of interest
None.
Footnotes
Y. Takeuchi and M. Inubushi contributed equally to this work.
References
- 1.Semenza GL, Nejfelt MK, Chi SM, Antonarakis SE. Hypoxia-inducible nuclear factors bind to an enhancer element located 3′ to the human erythropoietin gene. Proc Natl Acad Sci USA. 1991;88:5680–5684. doi: 10.1073/pnas.88.13.5680. [DOI] [PMC free article] [PubMed] [Google Scholar]
- 2.Marignol L, Lawler M, Coffey M, Hollywood D. Achieving hypoxia-inducible gene expression in tumors. Cancer Biol Ther. 2005;4:359–364. doi: 10.4161/cbt.4.4.1646. [DOI] [PubMed] [Google Scholar]
- 3.Semenza GL. Targeting HIF-1 for cancer therapy. Nat Rev Cancer. 2003;3:721–732. doi: 10.1038/nrc1187. [DOI] [PubMed] [Google Scholar]
- 4.Dachs GU, Patterson AV, Firth JD, Ratcliffe PJ, Townsend KM, Stratford IJ, et al. Targeting gene expression to hypoxic tumor cells. Nat Med. 1997;3:515–520. doi: 10.1038/nm0597-515. [DOI] [PubMed] [Google Scholar]
- 5.Harris AL. Hypoxia: a key regulatory factor in tumor growth. Nat Rev Cancer. 2002;2:38–47. doi: 10.1038/nrc704. [DOI] [PubMed] [Google Scholar]
- 6.Hsieh CH, Kuo JW, Lee YJ, Chang CW, Gelovani JG, Liu RS. Construction of mutant TKGFP for real-time imaging of temporal dynamics of HIF-1 signal transduction activity mediated by hypoxia and reoxygenation in tumors in living mice. J Nucl Med. 2009;50:2049–2057. doi: 10.2967/jnumed.108.061234. [DOI] [PubMed] [Google Scholar]
- 7.Serganova I, Doubrovin M, Vider J, Ponomarev V, Soghomonyan S, Beresten T, et al. Molecular imaging of temporal dynamics and spatial heterogeneity of hypoxia-inducible factor-1 signal transduction activity in tumors in living mice. Cancer Res. 2004;64:6101–6108. doi: 10.1158/0008-5472.CAN-04-0842. [DOI] [PubMed] [Google Scholar]
- 8.Liu J, Qu R, Ogura M, Shibata T, Harada H, Hiraoka M. Real-time imaging of hypoxia-inducible factor-1 activity in tumor xenografts. J Radiat Res. 2005;46:93–102. doi: 10.1269/jrr.46.93. [DOI] [PubMed] [Google Scholar]
- 9.Cowen RL, Williams KJ, Chinje EC, Jaffar M, Sheppard FC, Telfer BA, Wind NS, et al. Hypoxia targeted gene therapy to increase the efficacy of tirapazamine as an adjuvant to radiotherapy: reversing tumor radioresistance and effecting cure. Cancer Res. 2004;64:1396–1402. doi: 10.1158/0008-5472.CAN-03-2698. [DOI] [PubMed] [Google Scholar]
- 10.Ozawa T, Hu JL, Hu LJ, Kong EL, Bollen AW, Lamborn KR, et al. Functionality of hypoxia-induced BAX expression in a human glioblastoma xenograft model. Cancer Gene Ther. 2005;12:449–455. doi: 10.1038/sj.cgt.7700814. [DOI] [PubMed] [Google Scholar]
- 11.Ogura M, Shibata T, Yi J, Liu J, Qu R, Harada H, et al. A tumor-specific gene therapy strategy targeting dysregulation of the VHL/HIF pathway in renal cell carcinomas. Cancer Sci. 2005;96:288–294. doi: 10.1111/j.1349-7006.2005.00044.x. [DOI] [PMC free article] [PubMed] [Google Scholar]
- 12.Shibata T, Giaccia AJ, Brown JM. Development of a hypoxia-responsive vector for tumor-specific gene therapy. Gene Ther. 2000;7:493–498. doi: 10.1038/sj.gt.3301124. [DOI] [PubMed] [Google Scholar]
- 13.Ruan H, Wang J, Hu L, Lin CS, Lamborn KR, Deen DF. Killing of brain tumor cells by hypoxia-responsive element mediated expression of BAX. Neoplasia. 1999;1:431–437. doi: 10.1038/sj.neo.7900059. [DOI] [PMC free article] [PubMed] [Google Scholar]
- 14.Post DE, Van Meir EG. Generation of bidirectional hypoxia/HIF-responsive expression vectors to target gene expression to hypoxic cells. Gene Ther. 2001;8:1801–1807. doi: 10.1038/sj.gt.3301605. [DOI] [PubMed] [Google Scholar]
- 15.Inubushi M, Tamaki N. Radionuclide reporter gene imaging for cardiac gene therapy. Eur J Nucl Med Mol Imaging. 2007;34:S27–S33. doi: 10.1007/s00259-007-0438-x. [DOI] [PubMed] [Google Scholar]
- 16.Liu Y, Cox SR, Morita T, Kourembanas S. Hypoxia regulates vascular endothelial growth factor gene expression in endothelial cells. Identification of a 5′ enhancer. Circ Res. 1995;77:638–643. doi: 10.1161/01.RES.77.3.638. [DOI] [PubMed] [Google Scholar]
- 17.Smanik PA, Liu Q, Furminger TL, Ryu K, Xing S, Mazzaferri EL, et al. Cloning of the human sodium iodide symporter. Biochem Biophys Res Commun. 1996;226:339–345. doi: 10.1006/bbrc.1996.1358. [DOI] [PubMed] [Google Scholar]
- 18.Vordermark D, Brown JM. Evaluation of hypoxia-inducible factor-1alpha (HIF-1alpha) as an intrinsic marker of tumor hypoxia in U87 MG human glioblastoma: in vitro and xenograft studies. Int J Radiat Oncol Biol Phys. 2003;56:1184–1193. doi: 10.1016/S0360-3016(03)00289-X. [DOI] [PubMed] [Google Scholar]
- 19.Jin YN, Inubushi M, Masamoto K, Odaka K, Aoki I, Tsuji AB, et al. Long-term effects of hepatocyte growth factor gene therapy in rat myocardial infarct model. Gene Ther. 2012;19:836–843. doi: 10.1038/gt.2011.128. [DOI] [PubMed] [Google Scholar]
- 20.National Research Council (US) Guide for the care and use of laboratory animals. 8. Washington: National Academies Press (US); 2011. [PubMed] [Google Scholar]
- 21.Inubushi M, Jin YN, Murai C, Hata H, Kitagawa Y, Saga T. Single-photon emission computed tomography of spontaneous liver metastasis from orthotopically implanted human colon cancer cell line stably expressing human sodium/iodide symporter reporter gene. EJNMMI Res. 2012;2:46. doi: 10.1186/2191-219X-2-46. [DOI] [PMC free article] [PubMed] [Google Scholar]
- 22.Riethoven JJ. Regulatory regions in DNA: promoters, enhancers, silencers, and insulators. Methods Mol Biol. 2010;674:33–42. doi: 10.1007/978-1-60761-854-6_3. [DOI] [PubMed] [Google Scholar]
- 23.Kizaka-Kondoh S, Itasaka S, Zeng L, Tanaka S, Zhao T, Takahashi Y, et al. Selective killing of hypoxia-inducible factor-1-active cells improves survival in a mouse model of invasive and metastatic pancreatic cancer. Clin Cancer Res. 2009;15:3433–3441. doi: 10.1158/1078-0432.CCR-08-2267. [DOI] [PubMed] [Google Scholar]
- 24.Brader P, Riedl CC, Woo Y, Ponomarev V, Zanzonico P, Wen B, et al. Imaging of hypoxia-driven gene expression in an orthotopic liver tumor model. Mol Cancer Ther. 2007;6:2900–2908. doi: 10.1158/1535-7163.MCT-07-0432. [DOI] [PubMed] [Google Scholar]
- 25.Carlin S, Pugachev A, Sun X, Burke S, Claus F, O’Donoghue J, et al. In vivo characterization of a reporter gene system for imaging hypoxia-induced gene expression. Nucl Med Biol. 2009;36:821–831. doi: 10.1016/j.nucmedbio.2009.06.006. [DOI] [PMC free article] [PubMed] [Google Scholar]
- 26.Greco O, Joiner MC, Doleh A, Powell AD, Hillman GG, Scott SD. Hypoxia- and radiation-activated Cre/loxP ‘molecular switch’ vectors for gene therapy of cancer. Gene Ther. 2006;13:206–215. doi: 10.1038/sj.gt.3302640. [DOI] [PubMed] [Google Scholar]
- 27.Brader P, Serganova I, Blasberg RG. Noninvasive molecular imaging using reporter genes. J Nucl Med. 2013;54:167–172. doi: 10.2967/jnumed.111.099788. [DOI] [PubMed] [Google Scholar]
- 28.Debrauwere H, Gendrel CG, Lechat S, Dutreix M. Differences and similarities between various tandem repeat sequences: minisatellites and microsatellites. Biochimie. 1997;79:577–586. doi: 10.1016/S0300-9084(97)82006-8. [DOI] [PubMed] [Google Scholar]
- 29.Pearson CE. Nichol Edamura K, Cleary JD. Repeat instability: mechanisms of dynamic mutations. Nat Rev Genet. 2005;6:729–742. doi: 10.1038/nrg1689. [DOI] [PubMed] [Google Scholar]
- 30.Blancher C, Moore JW, Talks KL, Houlbrook S, Harris AL. Relationship of hypoxia-inducible factor (HIF)-1alpha and HIF-2alpha expression to vascular endothelial growth factor induction and hypoxia survival in human breast cancer cell lines. Cancer Res. 2000;60:7106–7113. [PubMed] [Google Scholar]
- 31.Janssen HL, Haustermans KM, Sprong D, Blommestijn G, Hofland I, Hoebers FJ, et al. HIF-1A, pimonidazole, and iododeoxyuridine to estimate hypoxia and perfusion in human head-and-neck tumors. Int J Radiat Oncol Biol Phys. 2002;54:1537–1549. doi: 10.1016/S0360-3016(02)03935-4. [DOI] [PubMed] [Google Scholar]
- 32.Li XF, Carlin S, Urano M, Russell J, Ling CC, O’Donoghue JA. Visualization of hypoxia in microscopic tumors by immunofluorescent microscopy. Cancer Res. 2007;67:7646–7653. doi: 10.1158/0008-5472.CAN-06-4353. [DOI] [PubMed] [Google Scholar]
- 33.Nunn A, Linder K, Strauss HW. Nitroimidazoles and imaging hypoxia. Eur J Nucl Med. 1995;22:265–280. doi: 10.1007/BF01081524. [DOI] [PubMed] [Google Scholar]
- 34.Fujibayashi Y, Taniuchi H, Yonekura Y, Ohtani H, Konishi J, Yokoyama A. Copper-62-ATSM: a new hypoxia imaging agent with high membrane permeability and low redox potential. J Nucl Med. 1997;38:1155–1160. [PubMed] [Google Scholar]
- 35.O’Donoghue JA, Zanzonico P, Pugachev A, Wen B, Smith-Jones P, Cai S, et al. Assessment of regional tumor hypoxia using 18F-fluoromisonidazole and 64Cu(II)-diacetyl-bis(N4-methylthiosemicarbazone) positron emission tomography: comparative study featuring microPET imaging, Po2 probe measurement, autoradiography, and fluorescent microscopy in the R3327-AT and FaDu rat tumor models. Int J Radiat Oncol Biol Phys. 2005;61:1493–1502. doi: 10.1016/j.ijrobp.2004.12.057. [DOI] [PubMed] [Google Scholar]
- 36.Valtorta S, Belloli S, Sanvito F, Masiello V, Di Grigoli G, Monterisi C, et al. Comparison of 18F-fluoroazomycin-arabinofuranoside and 64Cu-diacetyl-bis (N4-methylthiosemicarbazone) in preclinical models of cancer. J Nucl Med. 2013;54:1106–1112. doi: 10.2967/jnumed.112.111120. [DOI] [PubMed] [Google Scholar]