

Abstract
Changes in the functional connectivity of the subgenual anterior cingulate cortex (SGC) have been linked with depressive symptoms. The aim of this study was to map this relationship across mid to late adolescence. Employing a longitudinal functional magnetic resonance imaging (fMRI) design, associations between patterns of resting-state SGC functional connectivity and symptoms of depression were examined at two time points in an initial sample of 72 adolescents. Using a region-of-interest approach, these associations were evaluated cross-sectionally and longitudinally. Cross-sectionally, weaker SGC functional connectivity with the posterior cingulate cortex (PCC), angular gyrus and dorsal prefrontal cortex at baseline, and weaker SGC connectivity with the dorsomedial prefrontal cortex (DMPFC) and ventromedial prefrontal cortex at follow-up, were associated with higher depressive symptoms. Longitudinally, a decrease in SGC functional connectivity with DMPFC, PCC, angular gyrus and middle temporal gyrus was associated with higher depressive symptoms at follow-up. The observation of weaker SGC connectivity predicting increased symptoms contrasts with the majority of resting-state fMRI studies in clinically depressed populations. Taken together with these past studies, our findings suggest depression-related changes in SGC functional connectivity may differ across developmental and illness stages.
Keywords: adolescence, fMRI, depression, subgenual cingulate cortex, functional connectivity
INTRODUCTION
First episodes of depression usually occur during adolescence and young adulthood (Blazer et al., 1994), with such episodes tending to recur later in life (Costello et al., 2006). Adolescent onset depression is associated with increased risk of anxiety and suicidal behaviors (Fergusson et al., 2007), as well as reduced attainment of educational and vocational goals (Berndt et al., 2000). Consequently, understanding the etiology of the development of depression in this age group will likely be particularly effective in tackling the significant burden of the disorder (Patel et al., 2007).
Neurobiological accounts of depression have emphasized the role of the subgenual anterior cingulate cortex (SGC), with accumulating evidence for alterations in its structure, function and larger-scale brain network connectivity (see Drevets et al., 2008a, for a review). One influential model characterizes the SGC as a critical hub in a depression-related brain network—the so-called ‘extended medial network’—which also encompasses anatomically connected cingulate, prefrontal and subcortical regions (Mayberg, 2003; Drevets et al., 2008a; Johansen-Berg et al., 2008; Price and Drevets, 2012). Of note, this network has substantial overlap with the concept of the ‘default-mode network’ (DMN; Raichle et al., 2001), particularly with regard to contributions from medial prefrontal and cingulate cortices. The DMN demonstrates high levels of organized activity and functional connectivity under resting-state imaging conditions, and has been broadly associated with self-referential cognition during task performance (Buckner et al., 2008; Harrison et al., 2008).
Consistent with its hypothesized importance in depression, primary alterations of the SGC have been reported in resting-state functional magnetic resonance imaging (fMRI) studies of depressed populations. In adults, the SGC shows abnormally increased functional connectivity with putative DMN regions, including the posterior cingulate cortex (PCC; Berman et al., 2011) and dorsomedial prefrontal cortex (DMPFC; Sheline et al., 2010; Hamilton et al., 2011a), as well as with DMN connectivity as a whole (Greicius et al., 2007). Increased connectivity between the SGC and PCC has also been reported in preschool-onset depression (Gaffrey et al., 2012), and between the SGC and DMPFC in depressed young adults (Davey et al., 2012). Conversely, other studies have reported decreased connectivity between the SGC and DMN components, such as the precuneus in adolescent depression (Connolly et al., 2013), and DMPFC in both pre-school (Gaffrey et al., 2010) and adolescent depression (Cullen et al., 2009); however, it should be noted that the latter study was not strictly performed under resting-state conditions as participants listened to music during scanning. In addition to patient-control differences, correlations between SGC connectivity strength and depressive symptom severity have also been reported (Sheline et al., 2010; Davey et al., 2012; Connolly et al., 2013), suggesting that there may be a dimensional component to the alterations in SGC connectivity in depression.
Plausibly, the differences across studies of child, adolescent and adult depression may partly reflect developmentally mediated influences on SGC functional connectivity (Connolly et al., 2013). The DMN, including SGC, undergoes subtle but significant changes in its connectivity over the course of development, especially during adolescence (Kelly et al., 2009; Supekar et al., 2010; Barber et al., 2013). This involves increased overall integration of the network (Fair et al., 2008), with apparent strengthening of long-range connections between anterior and posterior cortical regions (Supekar et al., 2010; Uddin et al., 2011; Barber et al., 2013), such as the SGC and PCC (Kelly et al., 2009). The dynamic nature of DMN functional connectivity in adolescence suggests that its corresponding alteration in depression or relationship to depressive symptoms may differ substantially across this critical developmental period; however, no studies to our knowledge have examined these possibilities with appropriate longitudinal designs.
Employing such a design, we aimed to comprehensively map the relationship between SGC functional connectivity and depressive symptoms at two time points across mid to late adolescence, as well as change in these associations over this time period. Our focus on depressive symptoms is important for a number of reasons, including the fact that subclinical depressive symptoms are highly prevalent in adolescence, and are associated with a range of negative outcomes, similar to those in clinically depressed individuals (Gotlib et al., 1995; Allen et al., 2014). This relationship occurs on a continuum, with increasing symptoms associated with poorer outcomes, and even mild to moderate symptomatology associated with impaired functioning (Lewinsohn et al., 2000; Allen et al., 2014). Furthermore, depressive symptoms in adolescence are also a well-established risk factor for later disorder (Horwath et al., 1992), with a greater number of symptoms associated with increased risk (Pine et al., 1999). Finally, our dimensional, rather than categorical, approach reflects a growing trend in depression research (e.g. Ayuso-Mateos et al., 2010) and is supported by previous findings of correlations between SGC connectivity and depressive symptom severity (Sheline et al., 2010; Davey et al., 2012; Connolly et al., 2013).
Based on the most consistent findings in depressed populations (Sheline et al., 2010; Berman et al., 2011; Hamilton et al., 2011a; Davey et al., 2012; Gaffrey et al., 2012), we hypothesized that greater SGC functional connectivity with other components of the DMN, such as the PCC and DMPFC, would be associated with higher depressive symptoms in mid and late adolescence. However, our primary aim was to examine how these associations may change over time, given reported maturational influences on DMN functional connectivity (Kelly et al., 2009; Supekar et al., 2010; Uddin et al., 2011; Barber et al., 2013). To address our primary aim, we (i) compared correlation maps of SGC functional connectivity and depressive symptoms across the two time points and (ii) examined whether changes in such connectivity over time predicted depressive symptoms in late adolescence. We hypothesized that SGC functional connectivity development would be associated with higher depressive symptoms during late adolescence.
MATERIALS AND METHODS
Participants and assessment
Adolescent participants were drawn from a broader longitudinal study of adolescent development (see Whittle et al., 2011, for an expanded description). Participants did not meet criteria for any past or present axis I disorder (based on the Schedule for Affective Disorder and Schizophrenia for School-Aged Children: Epidemiologic Version, K-SADS-E; Orvaschel, 1994) at the time of the baseline resting-state fMRI scan (Time 1; mean age = 16.47 years, s.d. = 0.59). Eleven adolescents developed an episode of depression between baseline (Time 1) and follow-up (Time 2; mean age = 18.75 years, s.d. = 0.48); however, none were currently depressed at Time 2. Further exclusion criteria are detailed in Supplementary Material, with final samples of n = 72 at Time 1 and n = 56 at Time 2. Resting-state fMRI, ratings of current depressive symptoms, using the Centre for Epidemiological Studies-Depression Scale (CES-D; Radloff, 1977), and anxiety symptoms, using the Beck Anxiety Inventory (BAI; Beck and Steer, 1993), were obtained at both time points. CES-D scores sampled a range of symptom severity, including two individuals at Time 1 and six at Time 2 with significant symptomatology (scores ≥24, Roberts et al., 1991; Chabrol et al., 2002). Informed consent was obtained from all participants (and their parent/guardian if they were under 18) in accordance with the guidelines of the Human Research Ethics Committee of the University of Melbourne, Australia. Participant demographic information is displayed in Table 1.
Table 1.
Participant characterization: demographics and clinical rating scales
| Variable | Mean (s.d.) |
|---|---|
| Time 1 age (n = 72) | 16.47 (0.59) |
| Time 2 age (n = 56) | 18.75 (0.48) |
| Time 1 gender M/F (n = 72) | 39/33 |
| Time 2 gender M/F (n = 56) | 30/26 |
| Time 1 CES-D (n = 72) | 7.45 (6.07) (range = 0–32) |
| Time 2 CES-D (n = 56) | 9.05 (8.93) (range = 0–41) |
MRI acquisition and preprocessing
Whole-brain functional T2*-weighted echo-planar images were acquired using a 3 T Siemens Magnetom Trio B15 magnetic resonance scanner. Functional sequences consisted of gradient-recalled acquisition in the steady state (repetition time = 1400 ms, echo time = 30 ms, pulse angle = 90°) corresponding to 24 interleaved slices within a field of view of 120 mm and voxel size of 3.3 × 3.3 × 5.0 mm. Complex fieldmaps were obtained to correct for distortion caused by magnetic field inhomogeneities. For each participant, a single 12 min continuous functional sequence was acquired, generating 510 whole-brain echo-planar imaging volumes. In addition, a high-resolution T1-weighted anatomical image was acquired for each participant to aid registration of the functional images to standard space. During scanning participants were instructed to relax, stay awake and lie still without moving while keeping their eyes closed.
Images were processed on a Linux platform running MATLAB version 7 and using Statistical Parametric Mapping 8 (SPM8, www.fil.ion.ucl.ac.uk/spm/). Motion correction involved the alignment of each participant’s time series to their first image using least squares minimization with a six-parameter (rigid-body) spatial transformation. Translation and rotation estimates (x, y, z) were required to be <2 mm or 2°, respectively, for all participants. Mean inter-volume displacement for each participant did not significantly differ between the two time points, t(55) = 0.59, P = 0.56. The realigned and unwarped (i.e. fieldmap corrected) functional sequences were then co-registered to each participant’s respective anatomical scan. Using the unified segmentation method, anatomical scans were segmented and spatially normalized to the International Consortium for Brain Mapping template, and the normalization parameters were applied to the co-registered functional images, which were then resliced to 2 mm isotropic resolution. Functional images were smoothed with a 6 mm (full-width at half-maximum) Gaussian filter. Pre-processing ensured functional scans were in the same stereotaxic (Montreal Neurological Institute) space as the anatomical segments of gray matter, white matter and cerebrospinal fluid (CSF). All time series were routinely inspected for potential normalization artifacts.
Functional connectivity analysis
A detailed seed-based functional connectivity analysis of the resting-state time-series was conducted to assess patterns of cortical and subcortical functional connectivity of the SGC at each time point. To establish specificity of the results to the SGC, other subregions of the cingulate cortex were included as control regions in analyses (Supplementary Figure S1). The SGC was defined based on the methods of Margulies et al. (2007), and employed by Davey et al. (2012) (x = ±5, y = 25, z = −10), with a 3.5 mm radius sphere created around this location using the MarsBaR region-of-interest (ROI) toolbox (http://marsbar.sourceforge.net/). Time courses were extracted for the SGC in each hemisphere for each participant. In addition to the signals of interest and the six head motion parameters, estimates of white matter, CSF and global brain signal fluctuations were also derived to include in regression analyses. The segmented white matter and CSF images were thresholded at 50% tissue-probability type and binarized to create nuisance masks, together with a binary mask of the global brain volume (summed from the gray matter, white matter and CSF segments). Nuisance signals were then extracted for each mask. These are routinely adjusted for in resting-state functional connectivity studies as they reflect global signal fluctuations of non-neuronal origin, such as physiological artifacts associated with respiratory and cardiac cycles, CSF motion and scanner drift (see Fox et al., 2006).
Statistical analysis
At each time point, functional connectivity maps were estimated for each participant by including SGC seed and nuisance signals as predictors of interest and no interest, respectively, in first-level (i.e. single-participant) whole-brain, linear regression analyses in SPM8. Prior to model estimation, each of the three nuisance covariates were orthogonalized (using an iterative Gram-Schmidt method; Harrison et al., 2009), and then removed from the SGC time series by linear regression. This resulted in a general linear model for each hemisphere, comprising the now ‘noise-cleaned’ SGC seed, three orthogonal nuisance variables and the six head motion parameters. A high-pass filter set at 128 s was used to remove low-frequency drifts of less than ∼0.008 Hz. Contrast images for each participant were generated by estimating the regression coefficient between all brain voxels and the SGC time series, separately for each hemisphere.
To assess cross-sectional associations between depressive symptoms and SGC functional connectivity, participants’ connectivity maps were included in second-level (i.e. group-based) random-effects analyses, separately for each time point. These involved a full factorial design, including CES-D score as the primary regressor of interest. In addition to Time 1 and Time 2 cross-sectional analyses, we also explored whether Time 1 functional connectivity predicted Time 2 CES-D scores, controlling for Time 1 CES-D score.
To assess change in SGC connectivity over time, change images were calculated for each participant (n = 56) by subtracting their connectivity map at Time 1 from that at Time 2. Both change in connectivity at a whole-group level, and its associations with Time 2 CES-D scores, were examined. Time 1 CES-D score was included as a covariate in the latter analysis.
Participants’ CES-D scores were significantly correlated with BAI scores at each time point (Time 1: r = 0.45, P < 0.001; Time 2: r = 0.64, P < 0.001). Therefore, to explore the specificity of the results to depressive symptoms, analyses were conducted both including and not including BAI scores as a covariate.
To explore the potential influence of head motion on the connectivity and correlation results, analyses were conducted both including and not including the mean level of motion for each participant as a covariate. This was calculated by taking the mean absolute displacement of each volume compared to the previous volume in the x, y and z directions (Van Dijk et al., 2012).
Spatial extent thresholds for the above statistical comparisons were determined by 2000 Monte Carlo simulations using 3dClustSim (AFNI, http://afni.nimh.nih.gov). Input parameters to 3dClustSim included a cluster-forming threshold of P < 0.01, and image masks for the two types of analyses: (i) a mask created by significant whole-group effects for the cross-sectional analyses and (ii) a combined mask of the significant whole-group effects from each time point for the longitudinal analyses. Minimum spatial cluster extents satisfied a family-wise error (FWE) rate correction of PFWE < 0.05.
RESULTS
Depressive symptoms
There was a significant increase in depressive symptoms between Time 1 and Time 2, t(71) = 1.997, P = 0.05. The change in depressive symptoms was not significantly different between males and females, t(70) = 0.07, P = 0.94. Individuals who experienced a depressive episode between Time 1 and Time 2 had significantly higher depressive symptoms at Time 2 [t(8)1 = −2.99, P = 0.02] [but not at Time 1: t(70) = −1.697, P = 0.09], than those who did not.
SGC functional connectivity at Time 1 and 2
Whole-brain analyses revealed robust and highly overlapping patterns of SGC connectivity at each time point (Figure 1), closely resembling the connectivity maps reported by Margulies et al. (2007), Kelly et al. (2009) and Davey et al. (2012). Such connectivity remained almost identical when head motion was included as a covariate. These functional connectivity patterns strongly recapitulate known anatomical gradients of local and distributed connectivity of the SGC (Vogt, 2009), involving putative DMN regions including medial prefrontal and cingulate cortices, angular gyrus and temporal cortex.
Fig. 1.
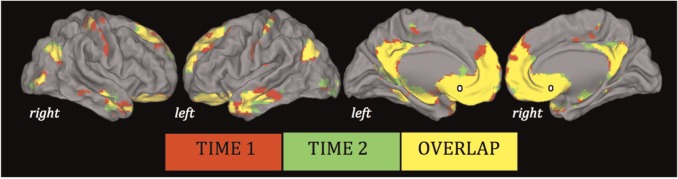
Significant whole-group SGC functional connectivity maps (SGC shown in white). Results are displayed on the cortical surface of the Population Average Landmark and Surface-Based Atlas (Van Essen, 2005), and thresholded at P < 0.01 uncorrected.
Cross-sectional associations with depressive symptoms
At Time 1, there was a significant negative correlation between CES-D scores and connectivity strength between the SGC and the PCC, right dorsal prefrontal cortex (DPFC) and right angular gyrus. In other words, weaker SGC functional connectivity with these regions was associated with higher depressive symptoms (Figure 2; Table 2).
Fig. 2.

Significant negative correlations between CES-D scores and SGC connectivity at Time 1 (top) and Time 2 (bottom). Orthogonal slice planes are: x = 8, y = −61, z = 26 (top); x = 7, y = 50, z = −10 (bottom).
Table 2.
Negative correlations between SGC connectivity and CES-D scores at each time point [thresholded at P < 0.01, cluster-wise corrected (PFWE < 0.05)]
| Brain region | x | y | z | Ke | Peak Z | PFWE |
|---|---|---|---|---|---|---|
| Time 1 (age ∼16) | ||||||
| Right angular gyrus | 60 | −60 | 24 | 201 | 3.54 | 0.04 |
| Right DPFC | 18 | 36 | 34 | 296 | 3.47 | 0.007 |
| PCC | 10 | −56 | 30 | 211 | 3.29 | 0.03 |
| Time 2 (age ∼18) | ||||||
| DMPFC | 10 | 46 | 30 | 236 | 4.22 | 0.02 |
| VMPFC | 2 | 50 | −6 | 439 | 3.33 | 0.001 |
| PCCa | 10 | −56 | 32 | 53 | 3.10 | >0.05 |
Notes. Ke, number of voxels in cluster. aThis cluster failed to reach the minimum spatial extent, which for the Time 2 analysis was 192 voxels.
At Time 2, there was a significant negative correlation between CES-D scores and connectivity strength between the SGC and the DMPFC and ventromedial prefrontal cortex (VMPFC) (Figure 2; Table 2). That is, similar to Time 1, weaker SGC functional connectivity with these regions was associated with higher depressive symptoms.
There were no significant positive correlations at either time point—that is, there was no evidence that increased SGC functional connectivity predicted heightened depressive symptoms. In addition, there were no significant correlations, positive or negative, between Time 1 SGC functional connectivity and Time 2 CES-D.
When BAI scores were included as covariates at each time point, results were predominantly similar. At Time 2, however, the DMPFC cluster failed to reach the minimum cluster extent.
When head motion was included as a covariate at Time 1, the results of the correlation analyses did not change. At Time 2, however, there was a significant moderate positive correlation between head motion and CES-D scores (r = 0.43, P = 0.001). Consequently, after controlling for head motion, the results of the correlation analyses were no longer significant (i.e. the cluster sizes failed to reach the minimum extent).
ROI analyses were conducted to assess similarities between the correlation findings at the two time points. At Time 2, within the significantly correlated clusters from Time 1, there was a negative correlation between SGC–PCC connectivity and Time 2 CES-D (Table 2). However, this PCC cluster failed to reach the minimum spatial extent threshold when masked with the significant whole-group effects. At Time 1, within the significantly correlated clusters from Time 2, there were no significant correlations with Time 1 CES-D.
Longitudinal change and associations with depressive symptoms
At a whole-group level, SGC functional connectivity with a single neighboring area of the VMPFC significantly increased between Time 1 and Time 2 (x = −2, y = 24, z = −10; Ke = 208; peak Z = 3.85; PFWE = 0.04; Figure 3): reflecting a strengthening of positive functional connectivity (Supplementary Figure S2). This change in connectivity remained almost identical when Time 1 and Time 2 head motion were included as covariates. No other regions were identified as demonstrating significant changes in functional connectivity between the two time points.
Fig. 3.

Significant increase in SGC connectivity with the VMPFC between Time 1 to Time 2. Orthogonal slice planes are x = −9, y = 24, z = −15.
There was a significant negative correlation between change in SGC connectivity between Time 1 and Time 2 with the DMPFC, PCC, right angular gyrus and left middle temporal gyrus (MTG) and Time 2 CES-D scores (Supplementary Figure S3; Supplementary Table S1). In other words, decreased SGC functional connectivity with these regions was associated with higher depressive symptoms at Time 2.
When Time 2 BAI scores were included as a covariate in the longitudinal analyses, results were predominantly similar; however, the right angular gyrus and left MTG failed to reach the minimum cluster extent.
When Time 1 and Time 2 head motion were included as covariates, the results of the longitudinal correlation analyses were no longer significant (i.e. the cluster sizes failed to reach the minimum extent).
DISCUSSION
This study has examined developmental associations between SGC functional connectivity and depressive symptoms across the mid to late adolescent period. Against a broadly consistent pattern of SGC functional connectivity with other major DMN regions across the two time points, both common and distinct regional associations with depressive symptoms were identified. Weaker SGC connectivity with the DPFC/DMPFC and PCC was generally apparent during both mid and late adolescence, whereas associations with the angular gyrus and VMPFC were only apparent at ages 16 and 18, respectively. Longitudinally, participants demonstrated a significant increase in SGC functional connectivity with the VMPFC, and changes in SGC functional connectivity with other DMN regions predicted the emergence of depressive symptoms at age 18.
The association between weaker SGC connectivity with the DPFC/DMPFC and higher depressive symptoms in both mid and late adolescence contrasts with previous studies in depressed young adult and adult populations (Sheline et al., 2010; Hamilton et al., 2011a; Davey et al., 2012), which have consistently implicated increased SGC–DMPFC connectivity in the disorder. Decreased SGC–DMPFC connectivity has previously been found in depressed adolescents (Cullen et al., 2009), however, as noted earlier, this study was not strictly performed under resting-state conditions, and therefore it is difficult to compare to the current findings. Nevertheless, reduced SGC–DMPFC connectivity has also been found in pre-school onset depression (Gaffrey et al., 2010). Therefore, the pattern observed in this study of reduced SGC–DMPFC connectivity may predominantly be associated with depression/depressive symptoms in younger individuals.
Weaker SGC connectivity with the PCC was associated with higher depressive symptoms in mid-adolescence, as well as during late-adolescence (albeit less robustly). These findings are similar to the pattern of decreased connectivity between SGC and precuneus (a structure that is anatomically related to, and often functionally covariant with the PCC; e.g. Fransson and Marrelec, 2008) reported in depressed adolescents (Connolly et al., 2013). However, in pre-school aged and adult populations, the reverse pattern of increased SGC–PCC connectivity in depression has been found (Berman et al., 2011; Gaffrey et al., 2012). These findings suggest that the association between weaker SGC connectivity with PCC/precuneus and depression/depressive symptoms may be unique to adolescents, and become less important over the transition to adulthood: a notion supported by our observation of a decrease in the significance of the relationship between SGC–PCC connectivity and depressive symptoms by late adolescence.
In addition to the overlapping findings described earlier, there were also notable distinct associations between SGC connectivity and depressive symptoms across mid and late adolescence. This included weaker connectivity with angular gyrus at age 16, and VMPFC at age 18. These associations were unexpected, as they have not previously been reported in clinical depression. However, it is possible that these patterns of SGC connectivity are uniquely associated with subclinical depressive symptoms at different stages of adolescence. Such findings support the notion of a developmental influence on the relationship between SGC functional connectivity and depressive symptoms.
With regard to longitudinal changes in SGC connectivity, we identified an increase with a single neighboring area of the VMPFC between age 16 and 18, with connectivity patterns being otherwise broadly similar across the two time points. This finding is in contrast to previous studies comparing functional connectivity of the DMN (including SGC) in children, adolescents and adults, which have predominantly reported a strengthening of distal functional connections over the course of development (Kelly et al., 2009; Supekar et al., 2010; Uddin et al., 2011; Barber et al., 2013). This discrepancy between past and present findings may be due to differences in the methodologies employed. Previous studies have assessed DMN connectivity changes over longer periods (e.g. between childhood and adulthood) than the strict 2-year interval studied here. In addition, whereas previous studies employed cross-sectional designs to analyze separate age groups at various time points, this study followed up the same participants longitudinally. Our more precise approach may explain the comparatively subtle changes in SGC connectivity observed across mid to late adolescence.
Longitudinal decreases in SGC connectivity with DMPFC, PCC, right angular gyrus and left MTG between age 16 and 18 predicted increased depressive symptoms at age 18. As these patterns of longitudinal change were not significant at a whole-group level, nor were they identified in the aforementioned developmental studies of SGC functional connectivity, we propose that individual differences in the development of DMN functional connectivity may play a role in predicting depressive symptoms in late adolescence. The substantial overlap between the regions implicated in the cross-sectional and longitudinal analyses suggests that both reduced and decreasing SGC connectivity with these DMN regions are associated with adolescent depressive symptoms. This gives further support for the notion that depressive symptom-related patterns of SGC functional connectivity are dynamic across adolescence.
While this study adopted a dimensional approach to depression, exploring relationships in terms of depressive symptomatology, our results do potentially have some clinical implications. The adolescents who experienced a major depressive episode between Time 1 and Time 2 had significantly higher depressive symptoms at Time 2 than those who did not: suggesting that these individuals may have been somewhat driving the results at this time point (both cross-sectionally and longitudinally). This indicates that the patterns of SGC functional connectivity associated with depressive symptoms at Time 2 may also be associated with previous depressive disorder in adolescence.
The consistent association between SGC connectivity with the DMPFC and PCC and adolescent depressive symptoms in our study, both cross-sectionally and longitudinally, reinforces the importance of connectivity between these DMN regions in the experience of depression and its symptoms (Cullen et al., 2009; Gaffrey et al., 2010; Sheline et al., 2010; Berman et al., 2011; Hamilton et al., 2011a; Davey et al., 2012; Gaffrey et al., 2012; Connolly et al., 2013). The directionality of these findings differs across studies, but in general (with the notable exception of Gaffrey et al., 2012) they seem to predominantly link decreased SGC connectivity with depression and its symptoms early in development, and increased SGC connectivity later in development. However, factors other than age may also be contributing to the disparity in findings. Younger depressed individuals have likely had shorter illness durations than their older counterparts, and are thus less likely to be affected by the prolonged, cumulative effects of their depression. We propose that in individuals with shorter illness durations, or who have higher levels of subclinical symptoms, decreased SGC functional connectivity may represent a neurobiological marker of vulnerability to depression. Then, with increased illness duration and cumulative effects of the illness, SGC connectivity may become pathophysiologically elevated as a compensatory or disorder-progressive mechanism. The positive correlation between increased SGC connectivity with the DMN and duration of depressive episode found by Greicius et al. (2007) supports the notion that different stages of illness are associated with different patterns of SGC connectivity. Our proposal may be examined by future longitudinal studies tracking the first onset of depression in adolescence and concurrent changes in SGC connectivity.
One limitation of resting-state functional connectivity studies is that, in the absence of task related data, the functions of the regions or networks delineated must be inferred (Greicius, 2008). However, there is compelling evidence to suggest that a close correspondence exists between resting-state and task-based characterizations of large-scale brain functional networks (Smith et al., 2009). As the SGC is thought to be a critical brain region in the modulation of emotional behavior (Drevets et al., 2008b), and the DMPFC is proposed to be involved in decision-making (Kennerley et al., 2006) and self-monitoring (Brown and Braver, 2005), depression-related elevations in SGC–DMPFC connectivity have been suggested to reflect aberrations in the cognitive control of emotions (Gaffrey et al., 2010). In addition, the DMN has been implicated in self-referential cognition (Buckner et al., 2008; Harrison et al., 2008), particularly rumination (Kross et al., 2009; Hamilton et al., 2011b; Zhu et al., 2012), which is a mode of responding to distress that is characteristic of depression, involving repeated and passive focus on self-relevant negative information (Nolen-Hoeksema et al., 2008). An association between rumination and increased SGC–DMN (specifically PCC) connectivity in depression was associated with behavioral ratings of rumination in one study (Berman et al., 2011), suggesting such hyper-connectivity in depression may be reflective of this particular symptom domain. It remains to be explored whether the present findings of decreased connectivity between SGC and other DMN components (including DMPFC and PCC) may also be related to the depressive symptoms of impaired emotional control and pathological self-referential cognitions. Regardless of the functional implications of the found associations, this study suggests that there may be different neurobiological underpinnings of depression and its symptoms at different ages and illness stages, potentially indicating the need for varying treatment approaches.
There are several confounding factors that may explain the current associations between SGC functional connectivity and depressive symptoms in adolescence. One of these potential factors is anxiety symptoms, which were highly correlated with depressive symptoms in our study. When anxiety was controlled for, results were predominantly similar, however, some of the findings no longer reached significance: namely the DMPFC at Time 2, and the right angular gyrus and left MTG in the longitudinal analysis. This suggests that these results may be partly attributable to anxiety symptoms. The mid to late adolescent period also involves changes in other factors that may be related to depressive symptoms and therefore could partially explain our findings: including alcohol and substance use, family and peer group stressors and hormonal changes, to name but a few. Future studies should examine the effects of these variables on SGC functional connectivity to establish specificity of our findings to depressive symptoms.
Recent research has raised concern about the influence of head motion during fMRI acquisition on measures of resting-state functional connectivity, with evidence of a distortion effect (e.g. Power et al., 2012; Satterthwaite et al., 2012; Van Dijk et al., 2012). Consequently, we controlled for this variable at both the single-subject and group levels. Overall, at a whole-group level, SGC functional connectivity did not change after controlling for head motion, and therefore, we chose to focus on the results when it was not included as a covariate. However, interestingly, there was an association between head motion and CES-D scores at age 18. This finding supports the suggestion that individual differences in head motion may be related to specific psychological and/or clinical factors (Kong et al., 2014; Pujol et al., 2014). More research is clearly necessary to further understand this relationship, but it should be considered by future studies exploring associations between functional connectivity and psychological variables.
In sum, this study has examined associations between SGC functional connectivity and depressive symptoms across mid to late adolescence. Overall, taken together with previous findings, our results suggest that the changes in SGC functional connectivity associated with depression and its symptoms may differ both with respect to directionality and precise neuroanatomy across development and across different stages of the disorder (including subclinical phases). Due to these proposed differences, caution should be taken in generalizing findings of altered SGC functional connectivity in depression across maturationally distinct groups. Given the continuous association between depressive symptoms during adolescence and risk for later clinical depression and other poor outcomes (Horwath et al., 1992; Gotlib et al., 1995; Pine et al., 1999; Allen et al., 2014), our findings may have broader implications for understanding the neurobiological correlates of risk and resilience mechanisms for depression.
SUPPLEMENTARY DATA
Supplementary data are available at SCAN online.
Acknowledgments
This work was supported by grants from the Colonial Foundation, the National Health and Medical Research Council (program grant 350241, career development fellowship 1061757 to C.G.D. and 1007716 to S.W., clinical career development award 628509 to B.J.H.) and the Australian Research Council (discovery grant DP0878136, DP1092637).
Neuroimaging analysis was facilitated by the Neuropsychiatry Imaging Laboratory at the Melbourne Neuropsychiatry Centre. The authors thank the Royal Children’s Hospital for support in acquiring the neuroimaging data, and the families that participated in this study.
Footnotes
1 Equal variances not assumed.
REFERENCES
- Allen JP, Chango J, Szwedo D, Schad M. Long-term sequalae of subclinical depressive symptoms in early adolescence. Development and Psychopathology. 2014;26:171–80. doi: 10.1017/S095457941300093X. [DOI] [PMC free article] [PubMed] [Google Scholar]
- Ayuso-Mateos JL, Nuevo R, Verdes E, Naidoo N, Chatterji S. From depressive symptoms to depressive disorders: the relevance of thresholds. British Journal of Psychiatry. 2010;196:365–71. doi: 10.1192/bjp.bp.109.071191. [DOI] [PubMed] [Google Scholar]
- Barber AD, Caffo BS, Pekar JJ, Mostofsky SH. Developmental changes in within- and between-network connectivity between late childhood and adulthood. Neuropsychologia. 2013;51:156–67. doi: 10.1016/j.neuropsychologia.2012.11.011. [DOI] [PMC free article] [PubMed] [Google Scholar]
- Beck AT, Steer RA. Beck Anxiety Inventory Manual. San Antonion, Texas: Psychological Corporation; 1993. [Google Scholar]
- Berman MG, Peltier S, Nee DE, Kross E, Deldin PJ, Jonides J. Depression, rumination and the default network. Social Cognitive & Affective Neuroscience. 2011;6:548–55. doi: 10.1093/scan/nsq080. [DOI] [PMC free article] [PubMed] [Google Scholar]
- Berndt ER, Koran LM, Finkelstein SN, et al. Lost human capital from early-onset chronic depression. American Journal of Psychiatry. 2000;157(6):940–7. doi: 10.1176/appi.ajp.157.6.940. [DOI] [PubMed] [Google Scholar]
- Blazer DG, Kessler RC, McGonagle KA, Swartz MS. The prevalence and distribution of major depression in a national community sample: the national comorbidity survey. American Journal of Psychiatry. 1994;151:979–86. doi: 10.1176/ajp.151.7.979. [DOI] [PubMed] [Google Scholar]
- Brown JW, Braver TS. Learned predictions of error likelihood in the anterior cingulate cortex. Science. 2005;307:1118–21. doi: 10.1126/science.1105783. [DOI] [PubMed] [Google Scholar]
- Buckner RL, Andrews-Hanna JR, Schacter DL. The brain's default network: anatomy, function, and relevance to disease. Annals of the New York Academy of Sciences. 2008;1124:1–38. doi: 10.1196/annals.1440.011. [DOI] [PubMed] [Google Scholar]
- Chabrol H, Montovany A, Chouicha K, Duconge E. Study of the CES-D on a sample of 1,953 adolescent students. L'encéphale. 2002;28(5):429–32. [PubMed] [Google Scholar]
- Connolly CG, Wu J, Ho TC, et al. Resting-state functional connectivity of subgenual anterior cingulate cortex in depressed adolescents. Biological Psychiatry. 2013;74(12):898–907. doi: 10.1016/j.biopsych.2013.05.036. [DOI] [PMC free article] [PubMed] [Google Scholar]
- Costello EJ, Foley DL, Angold A. 10-Year research update review: the epidemiology of child and adolescent psychiatric disorders: II. Developmental epidemiology. Journal of the American Academy of Child & Adolescent Psychiatry. 2006;45(1):8–25. doi: 10.1097/01.chi.0000184929.41423.c0. [DOI] [PubMed] [Google Scholar]
- Cullen KR, Gee DG, Klimes-Dougan B, et al. A preliminary study of functionalconnectivity in comorbid adolescent depression. Neuroscience Letters. 2009;460:227–31. doi: 10.1016/j.neulet.2009.05.022. [DOI] [PMC free article] [PubMed] [Google Scholar]
- Davey CG, Harrison BJ, Yucel M, Allen NB. Regionally specific alterations in functional connectivity of the anterior cingulate cortex in major depressive disorder. Psychological Medicine. 2012;42(10):2071–81. doi: 10.1017/S0033291712000323. [DOI] [PubMed] [Google Scholar]
- Drevets WC, Price JL, Furey ML. Brain structural and functional abnormalities in mood disorders: implications for neurocircuitry models of depression. Brain Structure and Function. 2008a;213:93–118. doi: 10.1007/s00429-008-0189-x. [DOI] [PMC free article] [PubMed] [Google Scholar]
- Drevets WC, Savitz J, Trimble M. The subgenual anterior cingulate cortex in mood disorders. CNS Spectrums. 2008b;13(8):663–81. doi: 10.1017/s1092852900013754. [DOI] [PMC free article] [PubMed] [Google Scholar]
- Fair DA, Cohen AL, Dosenbach NUF, et al. The maturing architecture of the brain's default network. Proceedings of the National Academy of Sciences of the United States of America. 2008;105(10):4028–32. doi: 10.1073/pnas.0800376105. [DOI] [PMC free article] [PubMed] [Google Scholar]
- Fergusson DM, Boden JM, Horwood LJ. Recurrence of major depression in adolescence and early adulthood, and later mental health, educational and economic outcomes. British Journal of Psychiatry. 2007;191:335–42. doi: 10.1192/bjp.bp.107.036079. [DOI] [PubMed] [Google Scholar]
- Fox MD, Corbetta M, Snyder AZ, Vincent JL, Raichle ME. Spontaneous neuronal activity distinguishes human dorsal and ventral attention systems. Proceedings of the National Academy of Sciences of the United States of America. 2006;103(26):10046–51. doi: 10.1073/pnas.0604187103. [DOI] [PMC free article] [PubMed] [Google Scholar]
- Fransson P, Marrelec G. The precuneus/posterior cingulate cortex plays a pivotal role in the default mode network: evidence from a partial correlation network analysis. NeuroImage. 2008;42:1178–84. doi: 10.1016/j.neuroimage.2008.05.059. [DOI] [PubMed] [Google Scholar]
- Gaffrey MS, Luby JL, Botterton K, Repovs G, Barch DM. Default mode network connectivity in children with a history of preschool onset depression. Journal of Child Psychology and Psychiatry. 2012;53(9):964–72. doi: 10.1111/j.1469-7610.2012.02552.x. [DOI] [PMC free article] [PubMed] [Google Scholar]
- Gaffrey MS, Luby JL, Repovs G, et al. Subgenual cingulate connectivity in children with a history of preschool-depression. Neuroreport. 2010;21(18):1182–8. doi: 10.1097/WNR.0b013e32834127eb. [DOI] [PMC free article] [PubMed] [Google Scholar]
- Gotlib IH, Lewinsohn PM, Seeley JR. Symptoms versus a diagnosis of depression: differences in psychosocial functioning. Journal of Consulting and Clinical Psychology. 1995;63(1):90–100. doi: 10.1037//0022-006x.63.1.90. [DOI] [PubMed] [Google Scholar]
- Greicius M. Resting-state functional connectivity in neuropsychiatric disorders. Current Opinion in Neurology. 2008;21(4):424–30. doi: 10.1097/WCO.0b013e328306f2c5. [DOI] [PubMed] [Google Scholar]
- Greicius MD, Flores BH, Menon V, et al. Resting-state functional connectivity in major depression: abnormally increased contributions from subgenual cingulate cortex and thalamus. Biological Psychiatry. 2007;62:429–37. doi: 10.1016/j.biopsych.2006.09.020. [DOI] [PMC free article] [PubMed] [Google Scholar]
- Hamilton JP, Chen G, Thomason ME, Schwartz ME, Gotlib IH. Investigating neural primacy in Major Depressive Disorder: multivariate Granger causality analysis of resting-state fMRI time-series data. Molecular Psychiatry. 2011a;16:763–72. doi: 10.1038/mp.2010.46. [DOI] [PMC free article] [PubMed] [Google Scholar]
- Hamilton JP, Furman DJ, Chang C, et al. Default-mode and task-positive network activity in Major Depressive Disorder: implications for adaptive and maladaptive rumination. Biological Psychiatry. 2011b;70(4):327–33. doi: 10.1016/j.biopsych.2011.02.003. [DOI] [PMC free article] [PubMed] [Google Scholar]
- Harrison BJ, Pujol J, Lopez-Sola M, et al. Consistency and functional specialisation in the default mode brain network. Proceedings of the National Academy of Sciences of the United States of America. 2008;105(28):9781–6. doi: 10.1073/pnas.0711791105. [DOI] [PMC free article] [PubMed] [Google Scholar]
- Harrison BJ, Soriano-Mas C, Pujol J, et al. Altered corticostriatal functional connectivity in obsessive-compulsive disorder. Archives of General Psychiatry. 2009;66(11):1189–200. doi: 10.1001/archgenpsychiatry.2009.152. [DOI] [PubMed] [Google Scholar]
- Horwath E, Johnson J, Klerman GL, Weissman MM. Depressive symptoms as relative and attributable risk factors for first-onset major depression. Archives of General Psychiatry. 1992;49:817–23. doi: 10.1001/archpsyc.1992.01820100061011. [DOI] [PubMed] [Google Scholar]
- Johansen-Berg H, Gutman DA, Behrens TEJ, et al. Anatomical connectivity of the subgenual cingulate region targeted with deep brain stimulation for treatment-resistant depression. Cerebral Cortex. 2008;18:1374–83. doi: 10.1093/cercor/bhm167. [DOI] [PMC free article] [PubMed] [Google Scholar]
- Kelly AMC, Di Martino A, Uddin LQ, et al. Development of anterior cingulate functional connectivity from late childhood to early adulthood. Cerebral Cortex. 2009;19:640–57. doi: 10.1093/cercor/bhn117. [DOI] [PubMed] [Google Scholar]
- Kennerley SW, Walton ME, Behrens TEJ, et al. Optimal decision making and the anterior cingulate cortex. Nature Neuroscience. 2006;9(7):940–7. doi: 10.1038/nn1724. [DOI] [PubMed] [Google Scholar]
- Kong X-Z, Zhen Z, Li X, et al. Individual differences in impulsivity predict head motion during magnetic resonance imaging. PLoS ONE. 2014;9(8):e104989. doi: 10.1371/journal.pone.0104989. [DOI] [PMC free article] [PubMed] [Google Scholar]
- Kross E, Davidson M, Weber J, Oschner K. Coping with emotions past: the neural bases of regulating affect associated with negative autobiographical memories. Biological Psychiatry. 2009;65(5):361–6. doi: 10.1016/j.biopsych.2008.10.019. [DOI] [PMC free article] [PubMed] [Google Scholar]
- Lewinsohn PM, Solomon A, Seeley JR, Zeiss A. Clinical implications of “subthreshold” depressive symptoms. Journal of Abnormal Psychology. 2000;109(2):345–51. [PubMed] [Google Scholar]
- Margulies DS, Kelly AMC, Uddin LQ, Biswal BB, Castellanos FX, Milham MP. Mapping the functional connectivity of anterior cingulate cortex. NeuroImage. 2007;37:579–88. doi: 10.1016/j.neuroimage.2007.05.019. [DOI] [PubMed] [Google Scholar]
- Mayberg HS. Positron emission tomography imaging in depression: a neural systems perspective. Neuroimaging Clinics of North America. 2003;13:805–15. doi: 10.1016/s1052-5149(03)00104-7. [DOI] [PubMed] [Google Scholar]
- Nolen-Hoeksema S, Wisco BE, Lyubomirsky S. Rethinking rumination. Perspectives of Psychological Science. 2008;3(5):400–24. doi: 10.1111/j.1745-6924.2008.00088.x. [DOI] [PubMed] [Google Scholar]
- Orvaschel H. Schedule for Affective Disorders and Schizophrenia for School Aged Children-Epidemiologic Version 5 (K-SADS-E) Ft Lauderdale, Florida: Nova Southeastern University; 1994. [Google Scholar]
- Patel V, Flisher AJ, Hetrick S, McGorry P. Mental health of young people: a global public health challenge. Lancet. 2007;369:1302–13. doi: 10.1016/S0140-6736(07)60368-7. [DOI] [PubMed] [Google Scholar]
- Pine DS, Cohen E, Cohen P, Brook J. Adolescent depressive symptoms as predictors of adult depression: moodiness or mood disorder? American Journal of Psychiatry. 1999;156:133–5. doi: 10.1176/ajp.156.1.133. [DOI] [PubMed] [Google Scholar]
- Price JL, Drevets WC. Neural circuits underlying the pathophysiology of mood disorders. Trends in Cognitive Sciences. 2012;16(1):61–71. doi: 10.1016/j.tics.2011.12.011. [DOI] [PubMed] [Google Scholar]
- Power JD, Barnes KA, Snyder AZ, Schlaggar BL, Petersen SE. Spurious but systematic correlations in functional connectivity MRI networks arise from subject motion. NeuroImage. 2012;59(3):2142–54. doi: 10.1016/j.neuroimage.2011.10.018. [DOI] [PMC free article] [PubMed] [Google Scholar]
- Pujol J, Macià D, Blanco-Hinojo L, et al. Does motion-related brain functional connectivity reflect both artifacts and genuine neural activity? NeuroImage. 2014;101:87–95. doi: 10.1016/j.neuroimage.2014.06.065. [DOI] [PubMed] [Google Scholar]
- Radloff LS. The CES-D scale: a self-report depression scale for research in the general population. Applied Psychological Measurement. 1977;1:385. [Google Scholar]
- Raichle ME, MacLeod AM, Snyder AZ, Powers WJ, Gusnard DA, Shulman GL. A default mode of brain function. Proceedings of the National Academy of Sciences of the United States of America. 2001;98(2):676–82. doi: 10.1073/pnas.98.2.676. [DOI] [PMC free article] [PubMed] [Google Scholar]
- Roberts RE, Lewinsohn PM, Seeley JR. Screening for adolescent depression: a comparison of depression scales. Journal of the American Academy of Child & Adolescent Psychiatry. 1991;30(1):58. doi: 10.1097/00004583-199101000-00009. [DOI] [PubMed] [Google Scholar]
- Satterthwaite TD, Wolf DH, Loughead J, et al. Impact of in-scanner head motion on multiple measures of functional connectivity: relevance for studies of neurodevelopment in youth. NeuroImage. 2012;60(1):623–32. doi: 10.1016/j.neuroimage.2011.12.063. [DOI] [PMC free article] [PubMed] [Google Scholar]
- Sheline YI, Price JL, Yan Z, Mintun MA. Resting-state functional MRI in depression unmasks increased connectivity between networks via the dorsal nexus. Proceedings of the National Academy of Sciences of the United States of America. 2010;107(24):11020–5. doi: 10.1073/pnas.1000446107. [DOI] [PMC free article] [PubMed] [Google Scholar]
- Smith SM, Fox PT, Miller KL, et al. Correspondence of the brain's functional architecture during activation and rest. Proceedings of the National Academy of Sciences of the United States of America. 2009;106(31):13040–5. doi: 10.1073/pnas.0905267106. [DOI] [PMC free article] [PubMed] [Google Scholar]
- Supekar K, Uddin LQ, Prater K, Amin H, Greicius MD, Menon V. Development of functional and structural connectivity within the default mode network in young children. NeuroImage. 2010;52:290–301. doi: 10.1016/j.neuroimage.2010.04.009. [DOI] [PMC free article] [PubMed] [Google Scholar]
- Uddin LQ, Supekar KS, Ryali S, Menon V. Dynamic reconfiguration of structural and functional connectivity across core neurocognitive brain networks with development. The Journal of Neuroscience. 2011;31(50):18578–89. doi: 10.1523/JNEUROSCI.4465-11.2011. [DOI] [PMC free article] [PubMed] [Google Scholar]
- Van Dijk KRA, Sabuncu MR, Buckner RL. The influence of head motion on intrinsic functional connectivity MRI. NeuroImage. 2012;59(1):431–8. doi: 10.1016/j.neuroimage.2011.07.044. [DOI] [PMC free article] [PubMed] [Google Scholar]
- Van Essen DC. A population-average, landmark- and surface-based (PALS) atlas of human cerebral cortex. NeuroImage. 2005;28:635–62. doi: 10.1016/j.neuroimage.2005.06.058. [DOI] [PubMed] [Google Scholar]
- Vogt BA. Cingulate Neurobiology and Disease. New York: Oxford University Press; 2009. [Google Scholar]
- Whittle S, Yap MBH, Sheeber L, et al. Hippocampal volume and sensitivity to maternal aggressive behavior: a prospective study of adolescent depressive symptoms. Development and Psychopathology. 2011;23:115–29. doi: 10.1017/S0954579410000684. [DOI] [PubMed] [Google Scholar]
- Zhu X, Wang X, Xiao J, et al. Evidence of a dissociation pattern in resting-state default mode network connectivity in first-episode, treatment-naive major depression patients. Biological Psychiatry. 2012;71:611–7. doi: 10.1016/j.biopsych.2011.10.035. [DOI] [PubMed] [Google Scholar]
Associated Data
This section collects any data citations, data availability statements, or supplementary materials included in this article.