

Abstract
Sirtuin 2 (SIRT2), a NAD+-dependent histone deacetylase, is involved in carcinogenesis and genomic instability and modulates proinflammatory immune responses. However, its role in renal inflammatory injury has not been demonstrated. In this study, we explored the expression patterns of CXCL2 and CCL2 in kidney tissue from Sirt2−/− and Sirt2+/+ mice and in mouse proximal tubular epithelial (MPT) cells. CXCL2 and CCL2 were significantly downregulated at both the mRNA and the protein levels in kidneys of LPS-treated Sirt2−/− mice compared with those of LPS-treated Sirt2+/+ mice. Furthermore, SIRT2 deficiency ameliorated LPS-induced infiltration of neutrophils and macrophages, acute tubular injury, and decrease of renal function. Supporting these observations, CXCL2 and CCL2 expression levels were lower in MPT cells treated with SIRT2-siRNA than in cells treated with control-siRNA, and adenovirus-mediated overexpression of SIRT2 in MPT cells significantly increased the LPS-induced expression of CXCL2 and CCL2 at the mRNA and protein levels. In addition, SIRT2 interacted with mitogen-activated protein kinase (MAPK) phosphatase-1 (MKP-1), and SIRT2-knockdown increased the acetylation of MKP-1 and suppressed the phosphorylation of p38 MAPK and c-Jun N-terminal kinase in LPS-treated MPT cells. SIRT2 also regulated p65 binding to the promoters of CXCL2 and CCL2. Taken together, these findings indicate that SIRT2 is associated with expression of renal CXCL2 and CCL2 and that regulation of SIRT2 might be an important therapeutic target for renal inflammatory injury.
Keywords: SIRT2, CXCL2, CCL2, mitogen-activated protein kinase (MAPK), phosphatase-1 acetylation
Sirtuin (SIRT) is a family of NAD+-dependent histone deacetylases. There are seven known mammalian sirtuins, SIRT1–SIRT7.1 Several nonhistone substrates of the sirtuins, such as p53,2 NF-κ-light-chain–enhancer of activated B cells (NF-κB),3 Forkhead box protein O34 have been demonstrated. These sirtuins are involved in several age-related pathologies, diabetes, cancer, and neurodegenerative diseases.1 Among SIRTs, SIRT2 plays important biologic roles in histone deacetylation,5 tumorigenesis,6 genomic instability,7 and bacterial infection.8 SIRT2 overexpression with PEP-1-SIRT2 suppresses inflammatory responses and reactive oxygen species–induced macrophage cytotoxicity.9 Recently, investigators reported that SIRT2 helps regulate the inflammatory process in brain microglial cells.10 Those authors have demonstrated that a decrease of SIRT2 potentiates the LPS and TNF-α–induced expression of proinflammatory cytokines, such as IL-6, macrophage activating 2 like, and IFN-γ–induced protein 10, in brain microglial cells.
Renal inflammatory injury induces inflammatory cell infiltration through the regulation of chemokines. There are four subfamilies of chemokines: CCL, CXCL, CX3CL, and CL.11,12 Neutrophils are the target of CXCL chemokines such as CXCL2, also known as macrophage inflammatory protein (MIP)-2α.12 Neutralization of CXC chemokines, including MIP-2, suppresses infiltration of neutrophils into the kidney after ischemia-reperfusion injury and in the Shiga toxin type 2 and LPS-induced inflammatory models.13,14 A recent study showed that CXCL1/CXCL2 regulates the early phase of neutrophil recruitment in LPS-induced inflammation.15 CCL2, also known as monocyte chemoattractant protein-1, plays a critical role in inflammatory renal injury via recruitment and activation of monocytes and macrophages.16 Because an inflammatory effect of CCL2 is linked to renal inflammatory injury, downregulation of CCL2 can have beneficial therapeutic potential for renal injury. However, the biologic role of SIRT2 in CXCL2- and CCL2-induced renal inflammatory injury has not yet been reported.
LPS plays a critical role in renal inflammatory injury during sepsis. Mitogen-activated protein kinase (MAPK) is critically associated with the Toll-like receptor (TLR)-dependent signaling pathway. MAPK phosphatase-1 (MKP-1) suppresses the MAPK pathway by dephosphorylating phosphotyrosine and phosphothreonine residues and ameliorates TLR signaling.17,18 Acetylation of MKP-1 increases its phosphatase activity; thereby MAPK signaling is downregulated.19 However, the relationship between SIRT2 and MKP-1–MAPK signal pathway remains to be clarified. On the basis of above findings, we investigated the roles of SIRT2 in LPS-induced renal expression of CXCL2 and CCL2 using in vivo and in vitro models. The results showed that a decrease of SIRT2 downregulates LPS-induced CXCL2 and CCL2 expression in kidney and mouse proximal tubular epithelial (MPT) cells. SIRT2 deficiency also ameliorated renal neutrophil and macrophage infiltration and urine neutrophil gelatinase–associated lipocalin (NGAL) level while regulating MKP-1 acetylation-related p38/c-Jun N–terminal kinase (JNK) MAPK phosphorylation and CXCL2 and CCL2 expression.
Results
SIRT2 Is Expressed in the Normal Renal Proximal Tubular Epithelial Cells
To evaluate whether SIRT2 protein is expressed in renal tubular epithelial cells in the normal kidney, kidneys of SIRT2-wild type (Sirt2+/+) mice were coimmunostained with SIRT2 and Lotus tetragonolobus lectin (Lectin). SIRT2-positive renal tubule cells were observed and costained with Lectin, a proximal tubular epithelial cell marker (Figure 1A). SIRT2-positive renal tubule cells were not costained with aquaporin 2 (AQP2, a collecting duct marker) or Tamm–Horsfall glycoprotein (a marker of the thick ascending limb of the loop of Henle) (Supplemental Figure 1B). Immunofluorescence staining data showed that SIRT2 expression was dramatically lower in the kidney of SIRT2-deficient (Sirt2−/−) mice than in Sirt2+/+ mice (Figure 1A).
Figure 1.

Sirt2 and LPS-induced CXCL2/CCL2 are expressed in the proximal tubular epithelial cells. (A) Immunofluorescence staining of SIRT2 and Lectin in the kidney of Sirt2+/+ and Sirt2−/− mice. Kidney sections from Sirt2+/+ and Sirt2−/− mice were stained with SIRT2 antibody and Lectin. Lectin was used as a marker of proximal tubular epithelial cell. (B and C) Immunofluorescence findings of CXCL2 (B), CCL2 (C), and Lectin in the kidneys. After stimulation with LPS or control buffer (CB), kidney sections of mice were stained with a CXCL2 or CCL2 antibody. Scale bar=100 µm. G, glomerulus. SIRT2-, CXCL2- and CCL2-postive cells were also stained with Lectin.
LPS Increases Proximal Tubular Epithelial CXCL2 and CCL2 Expression in Sirt2+/+ Mice
Previous studies found that LPS increases CXCL2 expression in periglomerular renal tubules and that CCL2 expression is increased in mouse renal tubules after treatment with cisplatin.15,20 Immunofluorescence stain analyses revealed that immunoreactive CXCL2 and CCL2 significantly increased in the tubules in renal cortex after treatment with LPS compared with control buffer–treated Sirt2+/+ mice. The CXCL2- and CCL2-immunoreactive cells were costained with Lectin. However, there was a scanty expression of CXCL2 and CCL2 in glomeruli of Sirt2+/+ mice after LPS injection (Figure 1, B and C). These data show that SIRT2 is expressed in the normal renal proximal tubular epithelial cells and LPS increases proximal tubular epithelial CXCL2 and CCL2 expression in wild-type mice.
Renal CXCL2 and CCL2 Expression Is Decreased in Sirt2−/− Mice after LPS Treatment
Because SIRT2 is known to be involved in inflammation, an involvement of SIRT2 in CXCL2 and CCL2 expression was evaluated using Sirt2−/− and Sirt2+/+ mice. Western blot analysis showed that SIRT2 protein was dramatically decreased in the kidney of Sirt2−/− mice compared with the kidney of Sirt2+/+ mice (Supplemental Figure 1A). Immunohistochemical data demonstrated that expression of CXCL2 or CCL2 in renal tubules of LPS-treated Sirt2−/− mice was significantly lower than that of Sirt2+/+ mice at 3 hours after LPS injection (Figure 2, A–D). CXCL2 and CCL2 expression in the kidneys of Sirt2−/− mice treated with control buffer alone did not differ significantly from that of Sirt2+/+ mice. ELISA data also showed that LPS treatment significantly increased CXCL2 and CCL2 expression in the kidneys of Sirt2+/+ mice. The levels of CXCL2 and CCL2 in the kidneys from Sirt2−/− mice were significantly lower than those in the kidneys from Sirt2+/+ mice (Figure 2, E and F). We also found that renal CXCL2 and CCL2 mRNA expression in Sirt2−/− mice was significantly decreased compared with that in Sirt2+/+ mice after LPS treatment (Figure 2, G and H). Taken together, these results suggest that renal CXCL2 and CCL2 expression is decreased in SIRT2-deficient mice after LPS treatment.
Figure 2.

Knockout of SIRT2 decreases LPS-induced CXCL2 and CCL2 expression in the kidney. (A and B) Immunohistochemical findings of CXCL2 and CCL2. Kidneys were harvested at 3 hours after intraperitoneal LPS injection. Tissues were fixed in 4% formaldehyde solution and kidney sections were then stained with CXCL2 (A) or CCL2 (B) antibody. Scale bar=100 µm. (C and D) Quantitative score of CXCL2 (C) or CCL2-positive (D) area in the kidney. (E and F) Tissue levels of CXCL2 (E) and CCL2 (F) in the kidney. Cytokines were quantified by ELISA. n=5 per group. (G and H) CXCL2 (G) and CCL2 (H) mRNA expression analysis by qRT-PCR in the kidneys of Sirt2+/+ and Sirt2−/− mice at 1 and 3 hours after LPS or control buffer (CB) treatment. Fold changes of CXCL2 and CCL2 expression are relative to CB-treated kidneys. Bars represent the mean±SD from six mice per group. The relative ratio measured in the CB-treated kidney of Sirt2+/+ mice is arbitrarily presented as 1. Data are expressed as mean±SD. *P<0.05 versus CB-treated Sirt2+/+ mice; **P<0.01 versus CB-treated Sirt2+/+ mice; ***P<0.001 versus CB-treated Sirt2+/+ mice; ‡P<0.01 versus LPS-treated Sirt2+/+ mice. Closed arrows in A and open arrows in B indicate CXCL2 and CCL2 expression in tubular epithelial cells, respectively.
Decreased Renal Neutrophil and Macrophage Infiltration in Sirt2−/− Mice
It is well known that CXCL2 and CCL2 play critical roles in neutrophil and macrophage recruitment, respectively.12 We examined whether renal upregulation of CXCL2 and CCL2 is associated with infiltration of Gr-1–positive neutrophil and ER-HR3–positive macrophage in the kidneys using Sirt2+/+ and Sirt2−/− mice. As shown in Figure 3, LPS treatment significantly increased infiltration of neutrophil and macrophage in the kidneys of Sirt2+/+ mice compared with the infiltration in Sirt2−/− mice. Deficiency of SIRT2 reduced the number of Gr-1–positive neutrophils and ER-HR3–positive macrophages in the kidneys by 76.8% and 57.0%, respectively (Figure 3, A–D). The LPS-induced increase of myeloperoxidase (MPO) activity,21 a marker of neutrophil accumulation in the kidney, was also significantly lower in Sirt2−/− mice than in Sirt2+/+ mice (Figure 3E).
Figure 3.

Sirt2 deficiency decreases neutrophil and macrophage infiltration in the kidney and increases renal function after LPS administration. (A and B) Immunofluorescence staining of Gr-1 (A) and ER-HR3 (B) in the kidney of Sirt2+/+ and Sirt2−/− mice. Kidneys were harvested at 3 and 72 hours after LPS administration, and kidney sections were stained with Gr-1 or ER-HR3 antibody. Gr-1 was used as a marker of neutrophils and ER-HR3 was used as a marker of macrophages. Scale bar=100 µm. (C and D) Quantification of Gr-1–positive neutrophils (C) and ER-HR3–positive macrophages (D) in the kidneys of Sirt2+/+ and Sirt2−/− mice. Value is shown as number per high power field. n=6 per group. (E) MPO activity in the kidney measured at 3 hours after LPS treatment in Sirt2−/− and Sirt2+/+ mice. n=6 per group. (F) Urinary NGAL levels in Sirt2−/− and Sirt2+/+ mice. Urinary NGAL were measured at 3 hours after LPS treatment. n=6 per group. (G) Effect of SIRT2 deficiency on inulin clearance. Inulin clearance was measured with Sirt2+/+ and Sirt2−/− mice 18 hours after LPS treatment (10 mg/kg intraperitoneally). Inulin clearance was significantly higher in Sirt2−/− mice than in Sirt2+/+ mice after LPS administration. n=3 per group. Data are expressed as mean±SD. **P<0.01 versus control buffer (CB)–treated Sirt2+/+ mice; †P<0.01 versus LPS-treated Sirt2+/+ mice; ‡P<0.01 versus LPS-treated Sirt2+/+ mice. Opened arrows in A indicate Gr-1–positive neutrophils and closed arrows in B indicate ER-HR3–positive macrophages in kidney tissue.
SIRT2 Deficiency Ameliorates LPS-Induced Acute Tubular Injury and Decrease of Renal Function
Because urinary NGAL is known as a tubular injury marker, we evaluated the NGAL level in urine. LPS treatment increased urine level of NGAL in Sirt2+/+ mice. However, the LPS-induced increase in NGAL level among Sirt2−/− mice was significantly smaller than that in Sirt2+/+ mice (Figure 3F). To define the role of SIRT2 in renal function, we measured the GFR by inulin clearance in Sirt2−/− and Sirt2+/+ mice after LPS treatment. SIRT2 deficiency significantly attenuated the LPS-induced decrease in the inulin clearance 18 hours after LPS treatment (Figure 3G).
Knockdown of SIRT2 Suppresses LPS-Induced Expressions of CXCL2 and CCL2 in MPT Cells
To further ensure the effect of SIRT2 knockdown on LPS-induced CXCL2 and CCL2 expression, MPT cells were transiently transfected with SIRT2-small interfering RNA (siRNA) or control-siRNA and treated with LPS. SIRT2-siRNA transfection significantly decreased the SIRT2 mRNA expression in MPT cells (Supplemental Figure 2A). Quantitative real-time RT-PCR (qRT-PCR) analysis data showed that CXCL2 and CCL2 mRNA expression in SIRT2-siRNA–treated MPT cells was significantly reduced when compared with the control-siRNA treated group at 1 hour after LPS treatment (Supplemental Figure 3, A and D). ELISA analyses also showed that LPS-induced CXCL2 and CCL2 expression after transfection with SIRT2-siRNA was significantly lower than control-siRNA (Supplemental Figure 3, B and E). We further examined whether SIRT2 regulates CXCL2 protein production and release from MPT cells after LPS treatment. After transfection of MPT cells with SIRT2-siRNA or control-siRNA, the level of CXCL2 protein in cell culture media was measured by ELISA at 1, 3, and 6 hours after LPS treatment. We found that the level of CXCL2 protein in the culture media of SIRT2-siRNA and control-siRNA transfected cells was gradually increased with time after LPS treatment. However, LPS-induced increase of CXCL2 release from SIRT2-siRNA transfected cells was substantially lower than that from control-siRNA transfected cells (Supplemental Figure 3C).
SIRT2 Overexpression Increases CXCL2 and CCL2 Expression in LPS-Treated MPT Cells
To further examine the involvement of SIRT2 overexpression in CXCL2 and CCL2 expression in vitro, SIRT2 was overexpressed in MPT cells by infection with SIRT2 overexpressing adenovirus (Ad-SIRT2) or control adenovirus (Ad-control). The expression of SIRT2 was significantly higher in MPT cells transfected with Ad-SIRT2 than in that of Ad-control (Supplemental Figure 2B). qRT-PCR data showed that CXCL2 and CCL2 mRNA expression in MPT cells incubated with Ad-SIRT2 was significantly increased compared with that with Ad-control at 1 hour after LPS treatment (Supplemental Figure 4, A and D). The protein levels of CXCL2 and CCL2 in Ad-SIRT2–transfected cells were also significantly higher than those in Ad-control–transfected cells (Supplemental Figure 4, B and E). We further evaluated whether SIRT2 overexpression regulates CXCL2 protein production and release from MPT cells after LPS treatment. After transfection of MPT cells with Ad-SIRT2 or Ad-control, the level of CXCL2 protein in cell culture media was measured by ELISA at 1, 3, and 6 hours after LPS treatment. We found that the level of CXCL2 protein in the culture media of Ad-SIRT2 and Ad-control transfected cells was gradually increased with time after LPS treatment. However, CXCL2 release from Ad-SIRT2–transfected cells at 1 hour after LPS treatment was substantially higher than that from Ad-control–transfected cells (Supplemental Figure 4C). Our results suggest that SIRT2 regulates LPS-induced expression of CXCL2 and CCL2 in MPT cells.
SIRT2 Regulates Expression of Proinflammatory Cytokines
To further analyze the regulatory role of SIRT2 in inflammatory response, we investigated the expression of proinflammatory cytokines—TNF-α, IL-1β, IL-6, IL-12, and regulated upon activation, normal T cell expressed and secreted (RANTES)—in the kidneys and serum of Sirt2−/− and Sirt2+/+ mice. ELISA data showed that after LPS treatment, the kidneys of Sirt2+/+ mice showed significantly greater expression of TNF-α, IL-1β, and IL-6 than the kidneys of Sirt2−/− mice (Figure 4, A–C). ELISA data also demonstrated that at 3 and 6 hours after LPS injection, the serum levels of TNF-α, IL-1β, IL-12, and RANTES were significantly lower in Sirt2−/− mice than in Sirt2+/+ mice (Figure 4, D–G).
Figure 4.
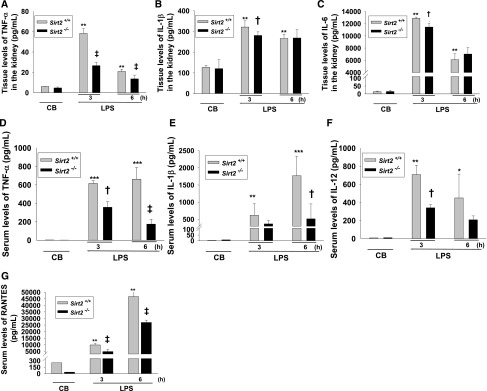
Sirt2 deletion suppresses pro-inflammatory cytokine production triggered by LPS. (A–C) Tissue levels of TNF-α (A), IL-1β (B), and IL-6 (C) in the kidney of Sirt2+/+ and Sirt2−/− mice. Kidney sections from Sirt2+/+ and Sirt2−/− mice were harvested at 3 and 6 hours after LPS or control buffer (CB) injection. Cytokines were quantified by ELISA. n=6 for each experimental group. (D–G) Serum levels of TNF-α (D), IL-1β (E), and IL-12 (F) and RANTES (G) from Sirt2+/+ and Sirt2−/− mice. Blood samples were harvested at 3 and 6 hours after LPS or CB injection. Cytokines were quantified by ELISA. n=6 per group. Data are expressed as mean±SD. *P<0.05 versus CB-treated Sirt2+/+ mice; **P<0.01 versus CB-treated Sirt2+/+ mice; ***P<0.001 versus CB-treated Sirt2+/+ mice; †P<0.01 versus LPS-treated Sirt2+/+ mice; ‡P<0.01 versus LPS-treated Sirt2+/+ mice.
LPS-Induced CXCL2 and CCL2 Expression Is Regulated by TLR4 Signaling
The increase of MKP-1 acetylation has been shown to suppress TLR-dependent MAPK signaling.19,22 We examined whether expression of CXCL2 and CCL2 depends on TLR4 receptor using transgenic mice carrying wild-type TLR4 (C3H/HeN) and mutant TLR4 (C3H/HeJ), which is an inactive form of TLR. Immunohistochemical data showed that LPS-induced CXCL2 and CCL2 expression was dramatically decreased in the kidney of C3H/HeJ mice compared with those in C3H/HeN mice (Figures 5, A–D). Data from qRT-PCR analysis showed that levels of CXCL2 and CCL2 mRNA expression in C3H/HeJ mice were significantly decreased compared with the levels C3H/HeN mice after LPS treatment (Figure 5, E and F).
Figure 5.

LPS-induced CXCL2 and CCL2 expression are decreased in the kidneys of C3H/HeJ mice. (A and B) Immunohistochemical study of CXCL2 (A) and CCL2 (B) in renal tissue of C3H/HeN (carrying wild-type TLR4) and C3H/HeJ (carrying mutated TLR4) mice after injection with LPS. Kidneys were harvested at 3 hours after intraperitoneal LPS injection. Tissues were fixed in 4% formaldehyde solution, and kidney sections were then stained with a CXCL2 or CCL2 antibody. Scale bar=100 µm. (C and D) Quantitative score of CXCL2 (C) or CCL2-positive (D) area in kidney sections. n=5 per group. (E and F) Analysis of CXCL2 (E) and CCL2 (F) mRNA expression by qRT-PCR in the kidney of C3H/HeN or C3H/HeJ mice at 1 and 3 hours after LPS or control buffer (CB) treatment. Fold changes of CXCL2 and CCL2 expression are relative to CB-treated kidney. Bars represent the mean±SD from six mice per group. The relative ratio measured in the CB-treated kidney of C3H/HeN mice is arbitrarily presented as 1. Bars represent the mean±SD. **P<0.01 versus CB-treated C3H/HeN mice; †P<0.05 versus LPS-treated C3H/HeN mice; ‡P<0.01 versus LPS-treated C3H/HeN mice.
SIRT2 Interacts with MKP-1 in MPT Cells
Acetylation of MKP-1 regulates inflammation.23 Therefore, we determined whether SIRT2 physically interacts with MKP-1 using MPT cells transfected with Ad-SIRT2 or Ad-control. To address this issue, we immunoprecipitated MKP-1 from the Ad-SIRT2- and Ad-control-transfected MPT cell lysates and immunoblotted precipitants for SIRT2. The results revealed that SIRT2 could be detected in the anti–MKP-1 antibody immunoprecipitation after Ad-control transfection. The level of SIRT2 protein coimmunoprecipitated by the MKP-1 antibody was significantly higher with SIRT2-overexpressing MPT cells than the level with control MPT cells (Figure 6A). These data indicate that SIRT2 directly interacts with MKP-1 in MPT cells.
Figure 6.
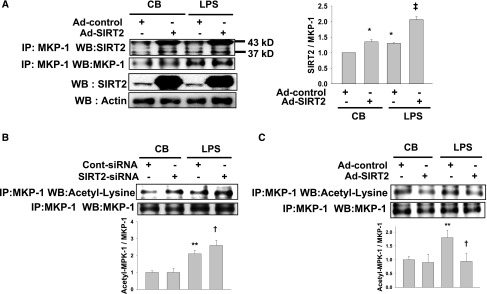
SIRT2 regulates the acetylation level of MKP-1 after LPS stimulation. (A) MPT cells were transfected with Ad-SIRT2 or Ad-control and treated with or without LPS (10 μg/ml). Cell lysates were immunoprecipitated with an MKP-1 antibody followed by SDS/PAGE and immunoblotted with an SIRT2 antibody. Representative immunoblots of total SIRT2 and actin are shown in the lower two panels. Endogenous actin was used as a loading control before immunoprecipitation. Band densities of SIRT2 are expressed as a percentage of MKP-1 in control buffer (CB) plus Ad-control transfected cells. (B and C) Western blot analysis of MKP-1 acetylation in SIRT2-siRNA or Cont-siRNA at 1 hour after LPS treatment (B). Western blot analysis of MKP-1 acetylation in Ad-SIRT2– or Ad-control–transfected MPT cells at 1 hour after LPS treatment (C). Transfected MPT cell lysates were immunoprecipitated against MKP-1 antibody, and immunoprecipitates were immunoblotted with an acetyl-lysine antibody. *P<0.05 versus MPT cells treated with CB plus Ad-control; **P<0.01 versus MPT cells treated with CB plus control-siRNA or Ad-control; †P<0.05 versus MPT cells treated with LPS plus control-siRNA or Ad-control; ‡P<0.01 versus LPS-treated MPT cells with Cont-siRNA or Ad-control.
SIRT2-Knockdown Increases MKP-1 Acetylation and Suppresses MAPK Signaling
In the next experiment, we evaluated whether acetylation of MKP-1 increases in SIRT2-knockdown or SIRT2-overexpressed MPT cells. Western blot analysis demonstrated that acetylation of MKP-1 was significantly increased in SIRT2-knockdown MPT cells and decreased in SIRT2-overexpressed MPT cells after LPS stimulation (Figure 6, B and C). Phosphorylation of JNK and p38 in SIRT2-siRNA–transfected MPT cells was significantly decreased compared with that of control-siRNA–transfected MPT cells after LPS treatment (Figure 7, A and C). Overexpression of SIRT2 by Ad-SIRT2 significantly increased the phosphorylation of JNK and p38 compared with those in Ad-control–transfected cells after LPS treatment (Figure 7, B and D). In addition, treatment of MPT cells with a p38 inhibitor, SB 203580 or a JNK inhibitor, SP600125 significantly suppressed LPS-induced CXCL2 and CCL2 mRNA expression (Figure 7, E and F). These results indicate that SIRT2 regulates MKP-1 acetylation and MAPK signaling through LPS/TRL4.
Figure 7.

SIRT2 regulates the phosphorylation level of JNK and p38 after LPS treatment. (A and B) Western blot analyses of JNK phosphorylation in SIRT2-siRNA– or Ad-SIRT2–transfected MPT cells. siRNA- or adenovirus-transfected MPT cells were treated with LPS for 15 minutes. Densitometric analyses are presented as the relative ratio of phospho-JNK to JNK. Bars represent the mean±SD from four independent experiments. (C and D) Western blot analyses of p38 phosphorylation in SIRT2-siRNA– (C) or Ad-SIRT2–transfected (D) MPT cells. siRNA- or adenovirus-transfected MPT cells were treated with LPS for 15 minutes. Densitometry analyses are presented as the relative ratio of phospho-p38 to p38. Bars represent the mean±SD from four independent experiments. (E and F) CXCL2 (E) and CCL2 (F) mRNA expression analysis by qRT-PCR in MPT cells after treatment with a p38 inhibitor, SB203580 (SB), or JNK inhibitor SP600125 (SP) at 1 hour after LPS treatment. Fold changes of CXCL2 and CCL2 expression are relative to control buffer (CB)–treated MPT cells. Bars represent the mean±SD from six independent experiments. The relative ratio measured in the CB-treated control-siRNA– or Ad-control–transfected MPT cells is arbitrarily presented as 1. **P<0.01 versus MPT cells treated with CB plus control-siRNA, Ad-control, or CB; †P<0.05 versus LPS-treated MPT cells with Cont-siRNA; ‡P<0.01 versus LPS-treated MPT cells with Cont-siRNA, Ad-control, or CB.
SIRT2 Regulates p65 Binding to CXCL2 and CCL2 Promoter
The promoter region of CXCL2 contains binding sites for p65 of NF-κB.24 To evaluate whether SIRT2 regulates p65 binding to CXCL2 and CCL2 promoters, we performed chromatin immunoprecipitation (ChIP) assays on CXCL2 and CCL2 promoters using MPT cells treated with SIRT2-siRNA or Ad-SIRT2. LPS-elicited p65 binding to the CXCL2 and CCL2 promoters was significantly reduced in SIRT2-siRNA cells (Figure 8, A and C). Supporting the data, p65 binding to the CXCL2 and CCL2 promoters was significantly increased in SIRT2 overexpressed cells (Figure 8, B and D). Immunoprecipitation with a nonspecific antibody (normal rabbit IgG) did not amplify the DNA fragments. These data demonstrate that SIRT2 regulates p65 binding to CXCL2 and CCL2 promoters.
Figure 8.
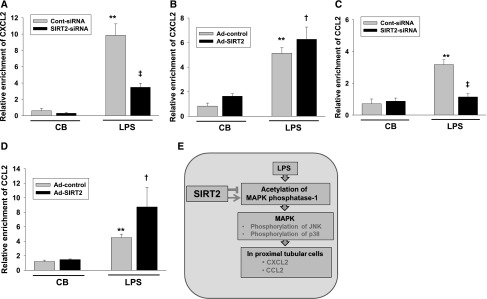
Binding of p65 at the CXCL2 and CCL2 gene promoter is regulated by SIRT2. SIRT2-siRNA or Cont-siRNA transfected MPT cells (A and C) were treated with LPS for 1 hour. Ad-SIRT2– or Ad-control–transfected MPT cells (B and D) were incubated with LPS for 1 hour. The ChIP assay was performed with an antibody against p65. qRT-PCR analysis was performed using primers to the mouse CXCL2 and CCL2 initiation site. The PCR amplification of input chromatin (INPUT 2%) before immunoprecipitation was used as a positive control. All results were normalized to input levels. Results are the mean enrichment levels relative to MPT cells treated with Cont-siRNA or Ad-control. Bars represent the means±SD from three independent experiments. **P<0.01 versus MPT treated with CB plus cont-siRNA or CB plus Ad-control; †P<0.05 versus MPT cells treated with LPS plus cont-siRNA or LPS plus Ad-control; ‡P<0.01 versus MPT cells treated with LPS plus cont-siRNA or LPS plus Ad-control. (E) Schematic diagram of signal pathway of SIRT2 on CXCL2 and CCL2 expression.
Discussion
SIRT2 is involved in several pathologic conditions, such as neuronal disease, cancer progression, cell cycle regulation, and diabetes. There are a few reports about the effects of SIRT2 on inflammatory response: SIRT2 displays an anti-inflammatory effect on bacterial infection and plays a suppressive role in brain microglial cell activation and microglial-induced neuronal toxicity through regulation of NF-κB.8,10 In this study, we demonstrated that deficiency of SIRT2 is crucially associated with LPS-induced renal inflammation. In particular, SIRT2 regulated inflammatory signaling through the MKP-1 and MAPK axis. This observation differs from the findings with brain microglia cells, in which an increase in SIRT2 reduced neuronal toxicity caused by microglial activation. We also found that SIRT2 protein expression level in the brain was higher than that in the kidney in SIRT2–wild type mice (data not shown). Thus, SIRT2 might have different effects on inflammation depending on the inflammatory model, organ, and signaling pathway.
CXCL2 expression in proximal renal tubular cells has also been observed in ischemic renal injury.25,26 CXCL2 could be a potential target molecule in the treatment of inflammatory injury. Treatment with a neutralizing antibody against CXCL2 ameliorates renal injury by decreasing neutrophil accumulation in the ischemic kidney.13 Dextran sodium sulfate-colitis–induced AKI is reduced in CXCR2 (receptor of CXCL2) knockout mice.27 In this study, our data demonstrated that LPS-induced CXCL2 expression in the renal proximal tubular epithelial cells was significantly decreased in SIRT2-deficient mice. These finding suggest that SIRT2 regulates renal CXCL2 expression induced by LPS.
Neutrophils are inflammatory cells that infiltrate the initiation sites of inflammation and play an important role in innate immune responses. Chemokines act as chemoattractants for neutrophils in acute inflammation. Among CXCL chemokines, CXCL2 is also involved in the infiltration of neutrophils. CXCL1 and CXCL2 are linked to the early stage of neutrophil recruitment induced by LPS.15 As neutrophils are involved in the early phase of inflammation, chemokines such as CXCL2 are usually associated with the early period before recruitment of neutrophils into the inflammatory sites. Thus, downregulation of CXCL2 can be a new avenue to treat or prevent LPS-induced inflammation. Neutrophil infiltration was suppressed in CXCR2-knockout mice in the dextran sodium sulfate-colitis–induced AKI animal model.27 In this study, we found that expression of LPS-induced CXCL2 increased at 3 hours (Figure 2). Sirt2−/− mice also showed significantly less LPS-induced renal MPO activity 3 hours after LPS injection than Sirt2+/+ mice (Figure 3). Together, these data suggest that SIRT2 regulates CXCL2 in the early stages of LPS-induced renal inflammatory response.
CCL2, also known as MCP-1, plays a critical role in inflammatory renal injury via recruitment and activation of monocytes and macrophages.16 Therefore, downregulation of CCL2 could have beneficial therapeutic potential for renal injury. Our data showed that SIRT2 deficiency in mice or MPT cells resulted in a significant decrease in CCL2 expression after LPS treatment. Our immunofluorescence data demonstrated that ER-HR3–positive macrophage or monocyte infiltration at 72 hours after LPS administration was significantly decreased in Sirt2−/− mice compared with Sirt2+/+ mice (Figure 3). Therefore, a decrease in SIRT2 exerts anti-inflammatory effects in the kidney through CCL2 signaling.
Our present study on signaling mechanism of LPS-mediated inflammation revealed that LPS-induced p65 binding to CXCL2 and CCL2 promoter was decreased in SIRT2 knockdown MPT cells. The data demonstrate a potential to increase our understanding of the epigenetic mechanism of SIRT2 in inflammatory kidney diseases. MKP-1 displays a regulatory effect on the phosphorylation of p38 MAPK in TLR signaling.22 An increase in MKP-1 acetylation generated by histone deacetylase inhibition decreases MAPK signaling.19 In this study, the results showed that MKP-1 acetylation increased in SIRT2-knockdown MPT cells and decreased the phosphorylation of p38 related to TLR signaling. However, further studies are needed to more precisely ascertain the role of SIRT2 in regulating the inflammatory signaling pathways associated with inflammatory kidney injury.
Our findings suggest that downregulation of SIRT2 be introduced as a new avenue to treat or prevent LPS-induced renal expression of CXCL2 and CCL2.
Concise Methods
Animal Experiments
Sirt2+/+ and Sirt2−/− mice were purchased from Jackson Laboratory (Bar Harbor, ME). C3H/HeN and C3H/HeJ mice were purchased from Japan SLC, Inc. (Shizuoka, Japan). Sirt2−/− mice are fertile and develop normally. At 1 and 2 months of age, Sirt2−/− mice show no overt phenotypic abnormality. There were no significant differences in kidney weight, kidney morphology, kidney histopathology, body temperature, or body weight between Sirt2+/+ and Sirt2−/− mice (data not shown). All animals were fed a standard normal diet ad libitum with free access to water. Male mice 7–8 weeks old were used for this study unless otherwise specifically indicated. The Institutional Animal Care and Use Committee of Chonbuk National University reviewed and approved the animal studies. Control buffer and LPS were injected intraperitoneally. At 1, 3, 6, 18, and 72 hours after injection of control buffer or LPS, mice were anesthetized with ketamine (100 mg/kg) and xylazine (10 mg/kg) and euthanized by cervical dislocation. Kidney, urine, and blood were harvested.
Immunofluorescence
Immunofluorescence staining was performed as described previously.28 Anti-SIRT2 (Abcam, Inc., Cambridge, MA), anti-AQP1 (Santa Cruz Biotechnology, Santa Cruz, CA), anti-AQP 2 (Santa Cruz Biotechnology), anti-Tamm–Horsfall glycoprotein (MP Biomedicals, Verona, Italy), anti–Gr-1 (BD Pharmingen Bioscience, San Diego, CA), anti–ER-HR3 (BMA Biomedical, Augst, Switzerland), and FITC-labeled Lotus tetragonolobus lectin (Vector Laboratories, Burlingame, CA) were used for frozen sections of mouse kidney.29,30 Secondary Alexa Fluor 488– or Alexa Fluor 555–conjugated antibodies against rat, rabbit, or mouse immunoglobulins (1:1000; Invitrogen, Carlsbad, CA) were used to visualize antigen-antibody complexes. Nuclei were stained with 4′, 6-diamidino-2-phenylindole. Digital images were obtained using a Zeiss LSM 510 confocal microscope (Carl Zeiss, Göttingen, Germany).
Immunohistochemistry
Immunohistochemistry was performed as described previously.31 Kidney sections were incubated overnight with primary antibodies against CCL2 (Fitzgerald, Acton, NJ) or CXCL2 (LifeSpan BioSciences, Seattle, WA). Visualization was achieved using 3-amino-9-ethyl carbazole high-sensitive substrate chromogen (Dako, Carpinteria, CA) chromogenic substrate. The positive area of CCL2 and CXCL2 was evaluated from the unit area (0.45 mm×0.45 mm) and expressed as a percentage per unit area using a digital image analysis program (AnalySIS, Soft Imaging System, Münster, Germany).
ELISA
Levels of CCL2 and CXCL2 in supernatant from MPT cells and kidneys were assessed using ELISA kits.32 The CCL2 ELISA kit from Invitrogen and the CXCL2 ELISA kit from Abcam, Inc. were used to determine these chemokines according to the manufacturers’ instructions. Mice were injected with LPS (10 mg/kg) and euthanized after 3 and 6 hours. Kidney tissue was homogenized and supernatants were used to determine levels of TNF-α, IL-1β, and IL-6. Plasma samples were collected by cardiac puncture and serum was used to evaluate levels of TNF-α, IL-1β, IL-12, and RANTES by multiplex ELISA (EMD Millipore, Billerica, MA) in accordance with the manufacturer’s guidelines.
Inulin Clearance
To measure GFR, inulin clearance was performed as described previously.33
Measurement of MPO Activity
Neutrophil sequestration in the kidney was quantified by measuring tissue MPO activity as described previously.34 Briefly, tissue samples were homogenized in 20 mM phosphate buffer (pH, 7.4) and then centrifuged at 13,000 g for 15 minutes at 4°C. The resulting pellets were suspended in 50 mM phosphate buffer (pH, 6.0) containing 0.5% vol/vol hexadecyltrimethylammonium bromide (Sigma-Aldrich, St. Louis, MO). The suspension centrifuged (15,000 g, 20 minutes, 4°C) and the supernatant was used for the MPO assay. The total incubation volume was 300 µL. Incubations were 10 minutes at room temperature. The absorbance was measured at 450 nm. Results were expressed as units of MPO per milligram protein.
Urine NGAL Concentrations
Urine samples were obtained from the mice at 3 hours after the LPS or control buffer treatment, and the concentration of urine NGAL was determined using a commercially available ELISA kit (R&D Systems, Minneapolis, MN) in accordance with the manufacturer’s instructions.
Cell Culture
MPT cells, an immortalized proximal tubular epithelial cell line from mice, were cultured in α-MEM medium supplemented with 10% FBS and antibiotics (100 U/ml penicillin G, 100 μg/ml streptomycin, and 0.25 μg/ml amphotericin). MPT cells were generously provided by Professor Lloyd G. Cantley (Yale University School of Medicine, New Haven, CT). LPS was purchased from Sigma-Aldrich, AGK2 from Tocris (Bristol, United Kingdom), AK-1 from Calbiochem (San Diego, CA), P38 inhibitor, SB 203580, and JNK inhibitor, SP600125 from Sigma-Aldrich.
Transfection of siRNA-Targeting SIRT2
MPT cells (5×10⁵ cells/dish) were plated in 6-cm dishes and allowed to grow overnight. Both siRNA (100 pmol; Dharmacon ON-TARGETplus SMART pool, Dharmacon Inc., Lafayette, CO) and 10 μl Lipofectamine RNAiMAX (Invitrogen) were diluted in Opti-MEM (Invitrogen) to a total volume of 2 ml. The diluted siRNA and Lipofectamine RNAiMAX were mixed and incubated at room temperature for 5 minutes to generate the transfection mixture. The cells were washed with Opti-MEM medium, and then the transfection mixture was added to the dish and incubated for 7 hours.
SIRT2-Adenovirus Infection
Replication-deficient recombinant adenovirus vectors containing the SIRT2 gene were purchased from ViraQuest, Inc. (North Liberty, IA). The efficiency of virus infection was 95%, as measured by green fluorescent protein expression. Cells were infected with Ad-CMVeGFP-SIRT2 or Ad-CMVeGFP (multiplicity of infection: 1) in 2% serum α-MEM medium for 24 hours and then cultured in α-MEM containing 10% FBS for another 48 hours. The cells were stimulated with LPS and collected for mRNA and protein analyses.
Cell Extracts, Immunoprecipitation, and Western Blot Analysis
Following transfection of siRNA-targeting SIRT2 or SIRT2-adenovirus, MPT cell extracts were collected. Whole cell extracts were prepared as described previously.31 MPT cells were collected and resuspended in cell lysis buffer (500 mM HEPES [pH, 7.6], 250 mM NaCl, 0.1% Nonidet P-40, 5mM EDTA) containing protease inhibitors (Sigma-Aldrich). Cell extracts (200 μg protein) were subjected to immunoprecipitation with an anti-MPK1 antibody. The immunoprecipitated proteins were subjected to SDS/PAGE and Western blot analyses were performed as described previously.31 Kidney tissues were also homogenized and used for Western blot analysis. The primary antibodies against SIRT2 (Abcam, Inc.) and phospho-p65, acetyl-p65, p65 (Cell Signaling Technology, Danvers, MA), JNK1/2 (Santa Cruz Biotechnology), acetyl-lysine antibody (Cell Signaling Technology), phospho-p38, p38 and phospho-JNK1/2 (Cell Signaling Technology) were used.
qRT-PCR Analysis of CCL2 and CXCL2
Total RNA was extracted from MPT cells and kidneys using TRI Reagent (MRC, Cincinnati, OH). After reverse transcription, qRT-PCR was performed using a SYBR Green PCR Master Mix (Applied Biosystems, Carlsbad, CA) on a 7900HT Fast Real-Time RT-PCR System (Applied Biosystems) to measure CCL2 and CXCL2. The PCR program was as follows: 2 minutes at 50°C, 10 minutes at 95°C, then 95°C for 15 seconds, and 60°C for 1 minute for 40 cycles. The average threshold cycle was determined from triplicate reactions and expression levels were normalized to the housekeeping gene, glyceraldehyde 3-phosphate dehydrogenase, as previously described.31 Table 1 summarizes the primer sequences of mouse CCL2, CXCL2, and glyceraldehyde 3-phosphate dehydrogenase.
Table 1.
Primers for Quantitative RT-PCR
| CCL2 | Forward | 5′- TTAAAAACCTGGATCGGAACCAA -3′ |
| Reverse | 5′- GCATTAGCTTCAGATTTACGGGT -3′ | |
| CXCL2 | Forward | 5′- CCAACCACCAGGCTACAGG -3′ |
| Reverse | 5′- GCGTCACACTCAAGCTCTG -3′ | |
| Glyceraldehyde-3-phosphate dehydrogenase | Forward | 5′- AGGTCGGTGTGAACGGATTTG -3′ |
| Reverse | 5′- TGTAGACCATGTAGTTGAGGTCA -3′ |
Chromatin Immunoprecipitation Assay
The ChIP assay was done using the Simple ChIP Enzymatic Chromatin IP Kit (Magnetic Beads; Cell Signaling Technology) according to manufacturer’s instructions. Briefly, SIRT2-siRNA or control-siRNA–transfected MPT cells (1×10⁷/ml) were treated with LPS (10 μg/ml) for 1 hour. Antibody against p65 from Cell Signaling and a negative control, rabbit IgG, were used for the ChIP assay. Inputs consisted of 2% chromatin before immunoprecipitation. qRT-PCR was performed as described above using the following primer sets: for mouse CXCL2 promoter, 5′-caacagtgtacttacgcagacg-3′ and 5′-ctagctgcctgcctcattctac-3′ and mouse CCL2 promoter, 5′-taccaaattccaacccacagtttc-3′ and 5′-gagagctggcttcagtgagag-3′.
Statistical Analyses
Data are expressed as mean±SD. The t test was used to compare the means of normally distributed continuous variables. Multiple comparisons were examined for significant differences using ANOVA, followed by individual comparisons with the Tukey post hoc test. Statistical significance was set at a P value <0.05.
Disclosures
None.
Supplementary Material
Acknowledgments
This research was supported by the Basic Science Research Program through the National Research Foundation of Korea (NRF) funded by the Ministry of Education, Science and Technology (NRF-2011-0016712 and NRF-2014R1A2A2A01002545), and the Bio & Medical Technology Development Program of the NRF (MSIP 2012M3A9C6050368) and by a grant (CUHBRI-2012- 02-003) of the CNUH-BRI.
Footnotes
Published online ahead of print. Publication date available at www.jasn.org.
This article contains supplemental material online at http://jasn.asnjournals.org/lookup/suppl/doi:10.1681/ASN.2014030226/-/DCSupplemental.
References
- 1.Yamamoto H, Schoonjans K, Auwerx J: Sirtuin functions in health and disease. Mol Endocrinol 21: 1745–1755, 2007 [DOI] [PubMed] [Google Scholar]
- 2.Kim DH, Jung YJ, Lee JE, Lee AS, Kang KP, Lee S, Park SK, Han MK, Lee SY, Ramkumar KM, Sung MJ, Kim W: SIRT1 activation by resveratrol ameliorates cisplatin-induced renal injury through deacetylation of p53. Am J Physiol Renal Physiol 301: F427–F435, 2011 [DOI] [PubMed] [Google Scholar]
- 3.Yeung F, Hoberg JE, Ramsey CS, Keller MD, Jones DR, Frye RA, Mayo MW: Modulation of NF-kappaB-dependent transcription and cell survival by the SIRT1 deacetylase. EMBO J 23: 2369–2380, 2004 [DOI] [PMC free article] [PubMed] [Google Scholar]
- 4.Giannakou ME, Partridge L: The interaction between FOXO and SIRT1: Tipping the balance towards survival. Trends Cell Biol 14: 408–412, 2004 [DOI] [PubMed] [Google Scholar]
- 5.Finnin MS, Donigian JR, Pavletich NP: Structure of the histone deacetylase SIRT2. Nat Struct Biol 8: 621–625, 2001 [DOI] [PubMed] [Google Scholar]
- 6.Kim HS, Vassilopoulos A, Wang RH, Lahusen T, Xiao Z, Xu X, Li C, Veenstra TD, Li B, Yu H, Ji J, Wang XW, Park SH, Cha YI, Gius D, Deng CX: SIRT2 maintains genome integrity and suppresses tumorigenesis through regulating APC/C activity. Cancer Cell 20: 487–499, 2011 [DOI] [PMC free article] [PubMed] [Google Scholar]
- 7.Serrano L, Martínez-Redondo P, Marazuela-Duque A, Vazquez BN, Dooley SJ, Voigt P, Beck DB, Kane-Goldsmith N, Tong Q, Rabanal RM, Fondevila D, Muñoz P, Krüger M, Tischfield JA, Vaquero A: The tumor suppressor SirT2 regulates cell cycle progression and genome stability by modulating the mitotic deposition of H4K20 methylation. Genes Dev 27: 639–653, 2013 [DOI] [PMC free article] [PubMed] [Google Scholar]
- 8.Eskandarian HA, Impens F, Nahori MA, Soubigou G, Coppée JY, Cossart P, Hamon MA: A role for SIRT2-dependent histone H3K18 deacetylation in bacterial infection. Science 341: 1238858, 2013 [DOI] [PubMed] [Google Scholar]
- 9.Kim MJ, Kim DW, Park JH, Kim SJ, Lee CH, Yong JI, Ryu EJ, Cho SB, Yeo HJ, Hyeon J, Cho SW, Kim DS, Son O, Park J, Han KH, Cho YS, Eum WS, Choi SY: PEP-1-SIRT2 inhibits inflammatory response and oxidative stress-induced cell death via expression of antioxidant enzymes in murine macrophages. Free Radic Biol Med 63: 432–445, 2013 [DOI] [PubMed] [Google Scholar]
- 10.Pais TF, Szegő EM, Marques O, Miller-Fleming L, Antas P, Guerreiro P, de Oliveira RM, Kasapoglu B, Outeiro TF: The NAD-dependent deacetylase sirtuin 2 is a suppressor of microglial activation and brain inflammation. EMBO J 32: 2603–2616, 2013 [DOI] [PMC free article] [PubMed] [Google Scholar]
- 11.Galliera E, Corsi MM, Bonecchi R, Locati M, Mantovani A: Chemokines as pharmacological targets. Mini Rev Med Chem 8: 638–646, 2008 [DOI] [PubMed] [Google Scholar]
- 12.Chung AC, Lan HY: Chemokines in renal injury. J Am Soc Nephrol 22: 802–809, 2011 [DOI] [PubMed] [Google Scholar]
- 13.Miura M, Fu X, Zhang QW, Remick DG, Fairchild RL: Neutralization of Gro alpha and macrophage inflammatory protein-2 attenuates renal ischemia/reperfusion injury. Am J Pathol 159: 2137–2145, 2001 [DOI] [PMC free article] [PubMed] [Google Scholar]
- 14.Roche JK, Keepers TR, Gross LK, Seaner RM, Obrig TG: CXCL1/KC and CXCL2/MIP-2 are critical effectors and potential targets for therapy of Escherichia coli O157:H7-associated renal inflammation. Am J Pathol 170: 526–537, 2007 [DOI] [PMC free article] [PubMed] [Google Scholar]
- 15.De Filippo K, Dudeck A, Hasenberg M, Nye E, van Rooijen N, Hartmann K, Gunzer M, Roers A, Hogg N: Mast cell and macrophage chemokines CXCL1/CXCL2 control the early stage of neutrophil recruitment during tissue inflammation. Blood 121: 4930–4937, 2013 [DOI] [PubMed] [Google Scholar]
- 16.Anders HJ, Vielhauer V, Schlöndorff D: Chemokines and chemokine receptors are involved in the resolution or progression of renal disease. Kidney Int 63: 401–415, 2003 [DOI] [PubMed] [Google Scholar]
- 17.Keyse SM: Protein phosphatases and the regulation of MAP kinase activity. Semin Cell Dev Biol 9: 143–152, 1998 [DOI] [PubMed] [Google Scholar]
- 18.Camps M, Nichols A, Arkinstall S: Dual specificity phosphatases: A gene family for control of MAP kinase function. FASEB J 14: 6–16, 2000 [PubMed] [Google Scholar]
- 19.Cao W, Bao C, Padalko E, Lowenstein CJ: Acetylation of mitogen-activated protein kinase phosphatase-1 inhibits Toll-like receptor signaling. J Exp Med 205: 1491–1503, 2008 [DOI] [PMC free article] [PubMed] [Google Scholar]
- 20.Kang KP, Kim DH, Jung YJ, Lee AS, Lee S, Lee SY, Jang KY, Sung MJ, Park SK, Kim W: Alpha-lipoic acid attenuates cisplatin-induced acute kidney injury in mice by suppressing renal inflammation. Nephrol Dial Transplant 24: 3012–3020, 2009 [DOI] [PubMed] [Google Scholar]
- 21.Kobayashi Y: Neutrophil infiltration and chemokines. Crit Rev Immunol 26: 307–316, 2006 [DOI] [PubMed] [Google Scholar]
- 22.Chi H, Barry SP, Roth RJ, Wu JJ, Jones EA, Bennett AM, Flavell RA: Dynamic regulation of pro- and anti-inflammatory cytokines by MAPK phosphatase 1 (MKP-1) in innate immune responses. Proc Natl Acad Sci U S A 103: 2274–2279, 2006 [DOI] [PMC free article] [PubMed] [Google Scholar]
- 23.Chi H, Flavell RA: Acetylation of MKP-1 and the control of inflammation. Sci Signal 1: pe44, 2008 [DOI] [PMC free article] [PubMed] [Google Scholar]
- 24.Ha J, Lee Y, Kim HH: CXCL2 mediates lipopolysaccharide-induced osteoclastogenesis in RANKL-primed precursors. Cytokine 55: 48–55, 2011 [DOI] [PubMed] [Google Scholar]
- 25.Winterberg PD, Wang Y, Lin KM, Hartono JR, Nagami GT, Zhou XJ, Shelton JM, Richardson JA, Lu CY: Reactive oxygen species and IRF1 stimulate IFNα production by proximal tubules during ischemic AKI. Am J Physiol Renal Physiol 305: F164–F172, 2013 [DOI] [PMC free article] [PubMed] [Google Scholar]
- 26.Lemay S, Rabb H, Postler G, Singh AK: Prominent and sustained up-regulation of gp130-signaling cytokines and the chemokine MIP-2 in murine renal ischemia-reperfusion injury. Transplantation 69: 959–963, 2000 [DOI] [PubMed] [Google Scholar]
- 27.Ranganathan P, Jayakumar C, Manicassamy S, Ramesh G: CXCR2 knockout mice are protected against DSS-colitis-induced acute kidney injury and inflammation. Am J Physiol Renal Physiol 305: F1422–F1427, 2013 [DOI] [PMC free article] [PubMed] [Google Scholar]
- 28.Lee AS, Kim DH, Lee JE, Jung YJ, Kang KP, Lee S, Park SK, Kwak JY, Lee SY, Lim ST, Sung MJ, Yoon SR, Kim W: Erythropoietin induces lymph node lymphangiogenesis and lymph node tumor metastasis. Cancer Res 71: 4506–4517, 2011 [DOI] [PubMed] [Google Scholar]
- 29.Kwon TH, Frøkiærx J, Nielsenx S: Regulation of aquaporin-2 in the kidney: A molecular mechanism of body-water homeostasis. Kidney Res Clin Pract 32: 96–102, 2013 [DOI] [PMC free article] [PubMed] [Google Scholar]
- 30.Schnermann J, Huang Y, Mizel D: Fluid reabsorption in proximal convoluted tubules of mice with gene deletions of claudin-2 and/or aquaporin1. Am J Physiol Renal Physiol 305: F1352–F1364, 2013 [DOI] [PMC free article] [PubMed] [Google Scholar]
- 31.Lee AS, Lee JE, Jung YJ, Kim DH, Kang KP, Lee S, Park SK, Lee SY, Kang MJ, Moon WS, Kim HJ, Jeong YB, Sung MJ, Kim W: Vascular endothelial growth factor-C and -D are involved in lymphangiogenesis in mouse unilateral ureteral obstruction. Kidney Int 83: 50–62, 2013 [DOI] [PubMed] [Google Scholar]
- 32.Kim SH, Jung YJ, Lee S, Park SK, Lee JH, Kim NH, Kim W: Decreased serum level and increased urinary excretion of vascular endothelial growth factor-C in patients with chronic kidney disease. Kidney Res Clin Pract 32: 66–71, 2013 [DOI] [PMC free article] [PubMed] [Google Scholar]
- 33.Kim DH, Jung YJ, Lee AS, Lee S, Kang KP, Lee TH, Lee SY, Jang KY, Moon WS, Choi KS, Yoon KH, Sung MJ, Park SK, Kim W: COMP-angiopoietin-1 decreases lipopolysaccharide-induced acute kidney injury. Kidney Int 76: 1180–1191, 2009 [DOI] [PubMed] [Google Scholar]
- 34.Li L, Bhatia M, Zhu YZ, Zhu YC, Ramnath RD, Wang ZJ, Anuar FB, Whiteman M, Salto-Tellez M, Moore PK: Hydrogen sulfide is a novel mediator of lipopolysaccharide-induced inflammation in the mouse. FASEB J 19: 1196–1198, 2005 [DOI] [PubMed] [Google Scholar]
Associated Data
This section collects any data citations, data availability statements, or supplementary materials included in this article.