

Abstract
Genomic imprinting is an important regulatory mechanism that silences one of the parental copies of a gene. To systematically characterize this phenomenon, we analyze tissue specificity of imprinting from allelic expression data in 1582 primary tissue samples from 178 individuals from the Genotype-Tissue Expression (GTEx) project. We characterize imprinting in 42 genes, including both novel and previously identified genes. Tissue specificity of imprinting is widespread, and gender-specific effects are revealed in a small number of genes in muscle with stronger imprinting in males. IGF2 shows maternal expression in the brain instead of the canonical paternal expression elsewhere. Imprinting appears to have only a subtle impact on tissue-specific expression levels, with genes lacking a systematic expression difference between tissues with imprinted and biallelic expression. In summary, our systematic characterization of imprinting in adult tissues highlights variation in imprinting between genes, individuals, and tissues.
Imprinting is an epigenetic mechanism that leads to parent-of-origin effects via imbalanced expression of maternally and paternally inherited copies of a gene. It plays a role in several Mendelian diseases and there is growing evidence for its role in common diseases as well as cancer. It is a dynamic mechanism with varying degrees of monoallelic expression between tissues and developmental stages (Wolf et al. 2008; Kong et al. 2009; Skaar et al. 2012; Lawson et al. 2013; Peters 2014). While previous studies have catalogued imprinted genes and shed light on patterns and mechanisms of imprinting, these data are derived from heterogeneous sources, often covering only specific loci, tissues, and developmental stages, especially in humans. Systematic estimation of differences between tissues and developmental phases are thus far known mostly from model organisms (Prickett and Oakey 2012).
Effective high-throughput screening of imprinted genes has been a continuing challenge for the community, due to both the biological complexity of the phenomenon and technical caveats. Most of our knowledge about imprinting therefore originates from special breeding designs in mouse, comparing transcription between parthenogenotes and androgenotes (Nikaido et al. 2003; Morison et al. 2005; Ruf et al. 2006) and from transcriptome sequencing of embryos resulting from reciprocal crosses (Babak et al. 2008; Gregg et al. 2010; Crowley et al. 2015), but some of this work has been shown to suffer from a high false-positive rate (DeVeale et al. 2012). This highlights the need to guard against biological and experimental artifacts when studying monoallelic expression in sequencing data.
In humans, genome-scale approaches have been even more challenging, since the ideal data sets of large family samples with allelic epigenome and transcriptome data from multiple tissues and developmental stages currently do not exist. Sequence-based computational screens for features characteristic for imprinted genes (Luedi et al. 2007) have rarely been validated experimentally, and they cannot detect stage-specific or tissue-specific imprinting patterns. Genome-wide scans for epigenetic signatures of imprinting, such as chromatin marks (Nag et al. 2013) and DNA methylation (Court et al. 2014) have provided valuable information of imprinted loci, but the relationship between parental epigenetic modifications and monoallelic expression is not fully known, and the genomic resolution can be low. Additionally, the tissue diversity in epigenetic studies has been limited. Finally, the monoallelic expression in imprinted loci can be detected from allele-specific transcription levels, estimated from hybridization of both DNA and cDNA to chips (Lo et al. 2003; Pant et al. 2006; Bjornsson et al. 2008; Morcos et al. 2011; Barbaux et al. 2012), by allele-specific binding of RNA polymerase II (Maynard et al. 2008), and more recently by analysis of RNA-sequencing data (Li et al. 2012), which is the approach of this study as well.
In this study, we characterized imprinting in a diverse set of adult human tissues by examining allele-specific expression (ASE) data from three studies with mRNA-sequencing (RNA-seq) and genotype data from population samples (Table 1; Supplemental Table S1). The Genotype-Tissue Expression data (GTEx) (The GTEx Consortium 2015) contains 1582 RNA-seq samples from 46 tissues from 178 adult post-mortem donors. The GenCord (GC) data set (Gutierrez-Arcelus et al. 2013) has three cell types from 179 individuals and also methylation array data. The Geuvadis data set (GD) (Lappalainen et al. 2013) has lymphoblastoid cell line (LCL) data from 462 individuals (Methods). These data were complemented by validation data from three tissues of family samples, microfluidics-multiplex PCR followed by sequencing, long-read RNA-seq, and methylation array data. In order to identify imprinted genes from ASE data, we developed a novel statistical framework that addresses known biological and technical issues with previous approaches that might otherwise lead to false positives (DeVeale et al. 2012). This method and software provides a practical tool for future analysis of imprinting in systematic large-scale studies of the imprintome from population-scale RNA-seq data. Together, these data allowed for characterization of imprinting in an unprecedented diversity of adult tissues. In addition to identifying novel imprinted genes and characterizing tissue specificity of imprinting, our imprinting map of adult human tissues adds to the understanding of imprinting as a biological phenomenon.
Table 1.
Tissue abbreviations

Results
We first retrieved RNA-seq allelic counts over heterozygous SNPs identified from genetic data (Lappalainen et al. 2013). In principle, imprinting (silencing or repression) of one parental copy will result in monoallelic expression of the other copy, and for each individual, RNA-seq reads would all contain the reference or nonreference allele depending on which allele was inherited from the expressed parent (Fig. 1A). We analyzed allelic counts via a filtering and likelihood-based approach based on probabilistic generative models for the different scenarios of allelic balance, imbalance, and monoallelic expression (Methods). We modeled and filtered for confounding factors (Supplemental Table S2; Proudhon and Bourc'his 2010; DeVeale et al. 2012), including biological processes of strong cis-eQTLs (The GTEx Consortium 2015) or nonsense-mediated decay (Rivas et al. 2015), and technical biases including genotyping error, phasing error, and allelic mapping bias of RNA-seq reads (Fig. 1; Supplemental Figs. S2–S4; Lappalainen et al. 2013; Panousis et al. 2014).
Figure 1.

Examples of allelic expression patters. In panels A and B, each dot represents RNA-seq haplotype counts of an individual, summed up over phased heterozygous sites across the gene, and in C–E, each dot is a SNP in an individual. (A) The strong monoallelic expression of DLK1 supports its previously known status as an imprinted gene. (B) MEST is almost fully imprinted in lung but biallelic in testis. (C) In PAX8, some individuals show (nearly) monoallelic expression, while others are biallelic. It is an example of a gene that has been excluded from our list of imprinted genes due to the high heterogeneity of allelic expression, which could be due to variable imprinting, cis-regulatory variants, or other effects. (D) MAP2K3 in Geuvadis LCLs has substantial monoallelic expression without additional genotype quality filters on 1000 Genomes data. In fact, many of the SNPs are likely to be truly homozygous, since they fail the HWE test, and are removed from the final analysis. (E) UQCRFS1 in Geuvadis LCLs shows a pattern where all monoallelic sites have only the alternative allele present. This pattern is not consistent with imprinting, and the gene will be filtered out by the “flip test” requiring observation of monoallelic expression of both alleles.
Random monoallelic expression (RME) suppresses expression in one of the two haplotypes of a cell without regard to parent of origin, and over a heterogeneous collection of cells, both haplotypes are likely to be expressed (Chess 2012). In clonal cell lines, RME can cause monoallelic expression (Morcos et al. 2011), and we observed increased clonality (estimated from the X Chromosome) in a substantial proportion of LCL samples but not in GTEx primary tissues (Supplemental Fig. S5). To avoid a false positive call due to the increased clonality, the HM13 gene that was imprinted only in Geuvadis LCLs was omitted from our list of imprinted genes. Otherwise, we included LCLs in our analyses but placed little weight on them in interpretation of the results, and known RME genes such as antigen and olfactory receptor genes (Gimelbrant et al. 2007) were filtered from consideration (Supplemental Fig. S2). These results demonstrate the importance of primary tissues compared to cell line samples in imprinting analyses.
To identify genes with a pattern of monoallelic expression inconsistent with technical or biological factors other than imprinting, we looked for strong monoallelic expression that is consistent among individuals, evenly distributed between reference and nonreference alleles across different individuals, and occurs in genes that lack strong eQTLs and known RME. We focus on imprinted genes with (nearly) full silencing of one allele instead of those with “partial imprinting” or heterogeneous imprinting between individuals (Fig. 1C; Wolf et al. 2008; Morcos et al. 2011). We chose conservative criteria in order to minimize false positives that would affect downstream analysis of properties of imprinted genes, and thus the main list of imprinted genes analyzed in this paper should not be considered to represent a full catalog of imprinted genes in humans. In addition to the genes that passed our strict criteria, we provide a complete catalog of evidence for imprinting in all genes studied. We cannot exclude a nonparental reason for monoallelic expression in novel imprinted genes that were not covered by our family validation data (see below), and these genes should thus be considered putatively imprinted. For the sake of brevity, we refer to all genes expressed in a putatively imprinted manner as imprinted.
After removing genes with sparse data (Methods), we were able to analyze 19,156 genes. We first classified genes as imprinted (IMP), biallelic (BI), or unknown (UN) in each of the GTEx tissues with >35 samples, GC, and GD data sets (Supplemental Table S1). The genes identified as IMP in at least one tissue were then further classified in all the tissues and data sets as consistent with imprinting (cIMP) or consistent with biallelic expression (cBI) according to nonsignificant but consistent patterns. Finally, degree of monoallelic expression was quantified by a parameter τ, the average ratio of the higher expressed allele to the total read count over all SNPs and individuals. Previously identified imprinted human genes and their maternal/paternal expression were obtained from the Otago database (Morison et al. 2001) and other sources (Supplemental Text). Furthermore, since the human gene annotation is not perfect, for all novel imprinted genes we manually verified that coverage and splicing in RNA-sequencing data was consistent with annotated genes, rather than ambiguous transcription in the locus.
Identification of imprinted genes
We identified 42 likely imprinted genes in 27 loci (Table 2; Fig. 2; Supplemental Tables S3–S6; Supplemental Data S1, S2; Supplemental Figs. S6, S7) after removing five genes that failed quality control (see below and Supplemental Text). Of these genes, 26 and four have confident or provisional previous evidence of imprinting, respectively (Supplemental Tables S3, S6), including well-known loci in Chr 11 with IGF2 and H19, and the Prader-Willi syndrome-associated locus in Chr 15 with multiple imprinted genes. Of the 12 novel genes, LPAR6, MEG9, and SNHG14 are within previously known imprinted loci. Overall, the expression and imprinting of novel loci are restricted to fewer tissues, which may explain why they have not been previously detected (Supplemental Fig. S8). Of our 42 genes, 19 have been described as imprinted in the mouse, although sometimes with an inconsistent tissue-specific pattern between the two organisms (Supplemental Fig. S9; Morison et al. 2001).
Table 2.
Imprinted genes detected in this study, with the number of tissues in each category of imprinted or biallelic expression
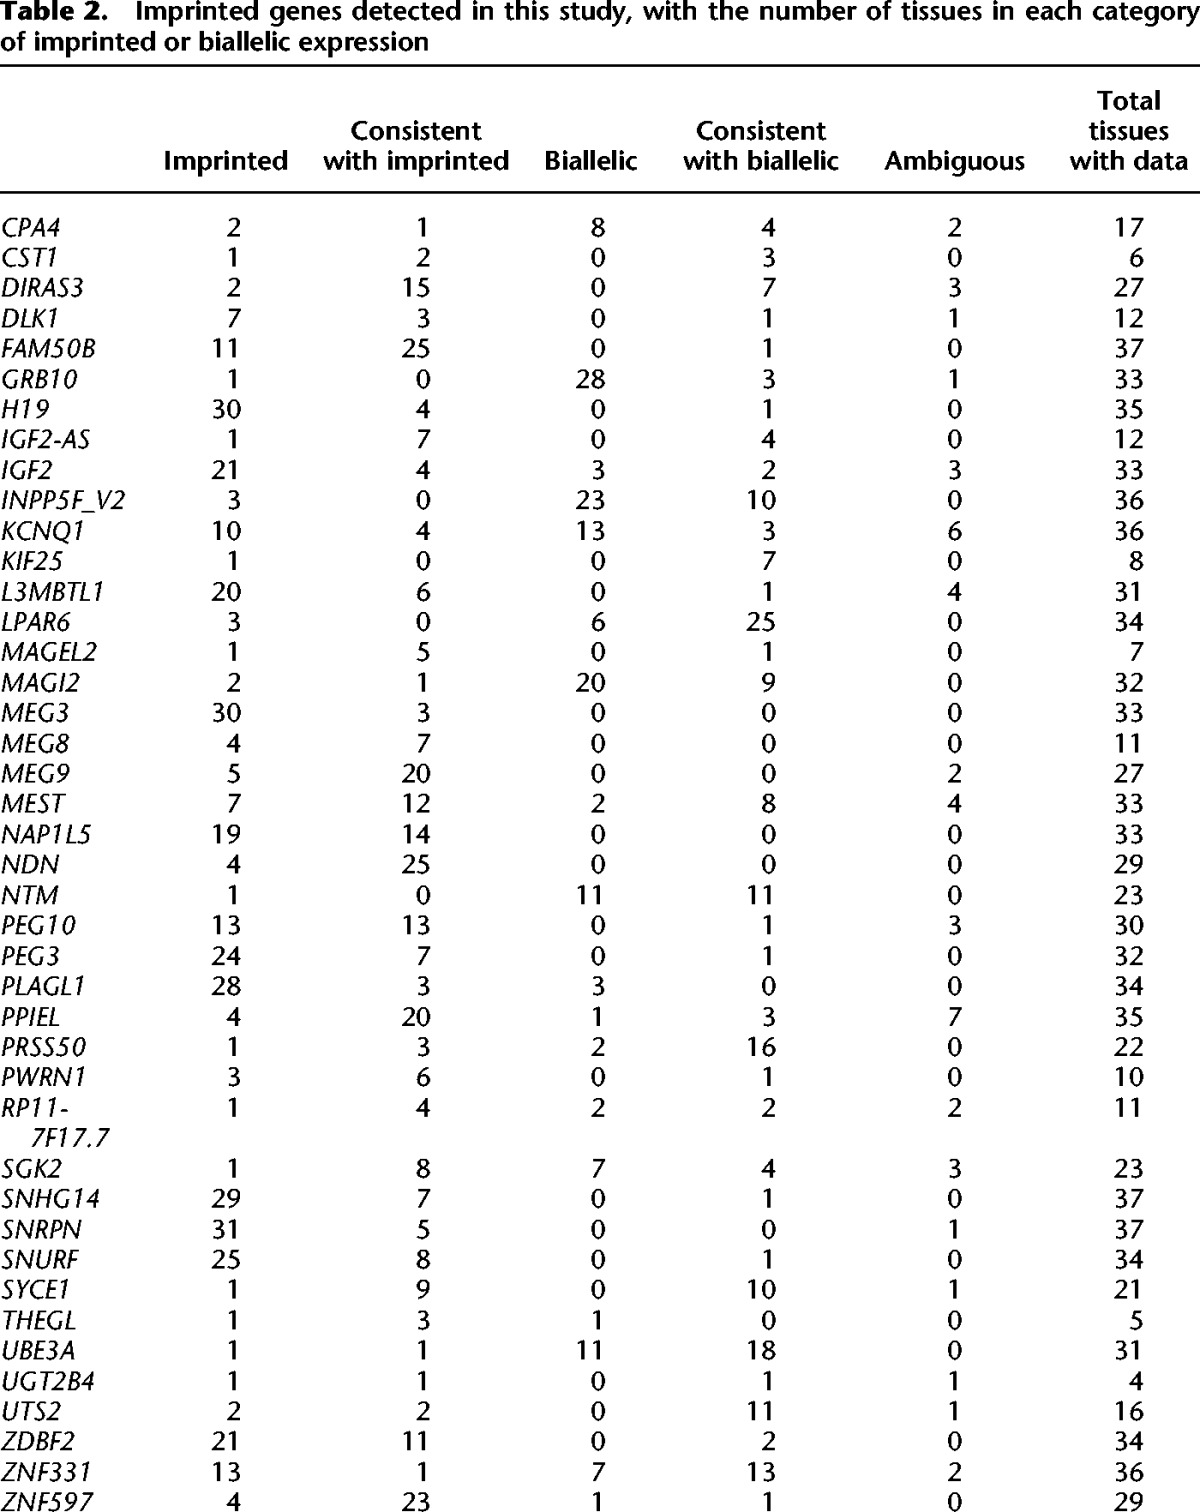
Figure 2.
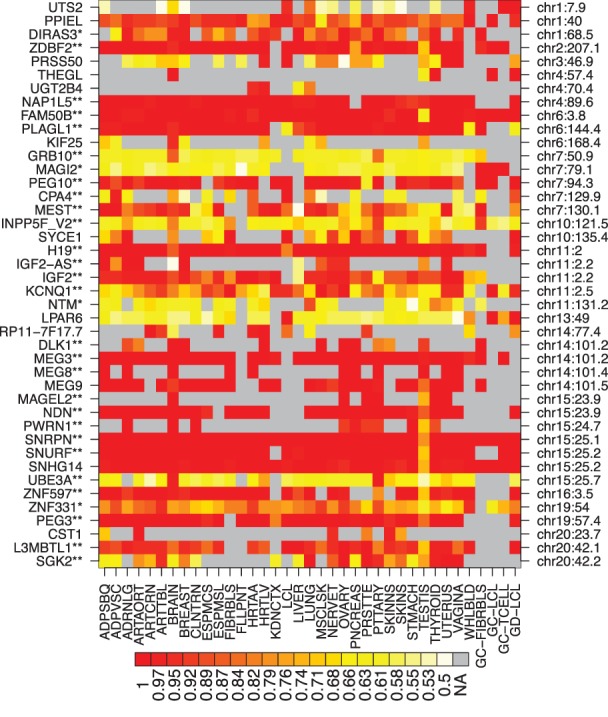
Imprinting across tissues for the 42 genes detected as imprinted. The color denotes τ, the average ratio of the higher expressed allele to the total read count. See Table 1 for tissue abbreviations. (**) Previously confidently imprinted genes, (*) provisionally identified imprinted genes.
Of 107 previously identified confidently imprinted genes in humans according to the Otago database (Morison et al. 2001), 28 genes lacked data in our analysis, including 12 small RNA genes that cannot be analyzed from mRNA data (Supplemental Table S6; Supplemental Data S3, S4). Of the remaining 79 genes with data, 26 and 20 are imprinted or consistent with imprinting in ≥1 tissue, respectively. However, as many as 31 genes were never consistent with imprinting and were classified as biallelic in ≥1 tissue (Supplemental Table S6; Supplemental Figs. S10, S13C). The lack of support for imprinting status in our data can be due to several factors: the catalogs are derived from heterogeneous sources and can include some false positives, the imprinted tissue may not be present or well covered by our data, and early developmental phases are not captured in our adult samples. One example of these patterns is the complex GNAS locus that has been reported to have cell-type specific imprinting (Bastepe 2007), and thus the mixture of cell types in the GTEx tissues, lack of the key tissues, and inability to distinguish overlapping transcripts can contribute to the biallelic expression signal. Some genes, such as CDKN1C, COPG2, and DLX5 have too low a coverage for proper analysis. We also do not classify highly heterogeneous genes such as RB1 as imprinted, since only a fraction of individuals shows monoallelic expression. Altogether, our results suggest that previous catalogs of human imprinting imperfectly capture imprinting in adults.
In addition to the 42 genes that passed our strict criteria of imprinting, we identified 30 genes with suggestive signs of imprinting (Supplemental Table S4), of which DLGAP2, GPR1, LRRTM1, and RTL1 are previously implicated imprinted genes in human or mouse. In addition to genes on this list, several genes have heterogeneous patterns of monoallelic expression between individuals, which can indicate true inter-individual variation in imprinting, uneven mixture of cell types with imprinting and biallelic expression, or other effects such as eQTLs, NMD, or other confounders. Examples of such genes include TPO, PAX8, CACNA1H, DNAH17, ERICH1, EVC, NUDT12, POU5F1, SCRN1, AC096579.7, SERPINA5, and FAM118A.
Validation of imprinted genes
To validate parental inheritance of monoallelic expression, we used familial exome and RNA-seq data from 10 trios with RNA-seq data from whole blood and nasal epithelium and six trio/duo families with RNA-seq data from muscle. We required at least 80% of RNA-seq reads from the respective allele for classification as maternally/paternally expressed.
Imprinting in these family data sets was generally consistent with the respective GTEx tissues, with the exception of KCNQ1 in muscle, a well-known imprinted gene that is biallelic in the muscle trio data but monoallelic in GTEx and supported by higher maternal than paternal expression nasal epithelium trio data (P < 0.008). Its variable imprinting in GTEx data suggests that the differences may be driven by biological variation between the specific cell types or individuals in the two data sets. We also found evidence of imprinting in the PSCA gene in nasal epithelium, which was borderline significant in the GTEx tissues colon (transverse), prostate, and stomach. Several HLA-DR and HLA-DQ genes were monoallelic in both GTEx and family samples. These genes and other known suspects for random monoallelic expression were excluded from final analysis (see above and Methods), and indeed, the family data did not show consistent parental direction of monoallelic expression. The previously identified provisional gene NLRP2 (Bjornsson et al. 2008) had monoallelic expression in both whole blood and nasal epithelium but contained both maternally expressed and paternally expressed individuals and was therefore removed from downstream analyses.
Overall, the family validation data confirmed imprinting of 11 genes, including previously provisional ZNF331 and novel UTS2 (Supplemental Table S7). In tissues and genes lacking familial validation data, parental origin of monoallelic expression is not confirmed, and thus the previously uncharacterized genes with monoallelic expression in our data should be considered candidate imprinted genes that need future validation.
Allelic ratios from RNA-seq data are often derived from relatively low read counts, and so we sought to validate the ratio estimates by mmPCR-seq (Zhang et al. 2014) assays for 89 SNPs in 23 genes, which yielded a median read coverage of 647. The allelic ratios were consistent overall (rho = 0.81 for sites with ≥8 reads) (Supplemental Fig. S11), as well as separately for each gene (data not shown). For further validation of transcript structure and correct read alignment, especially of the novel/provisional genes, we examined GTEx strand-specific long-read RNA-seq data (2 × 250 bp) in 34 samples from five individuals (Supplemental Fig. S7). Monoallelic expression in ASE data was fully concordant with the original data (rho = 0.99 for sites with ≥20 reads) (data not shown), which indicates that lack of strand information and allelic mapping bias are unlikely confounders in the primary results. However, four genes were removed based on ambiguous annotation, and INPPF5 was reclassified as INPPF5_V2. Other genes were consistent with the initial analysis (Supplemental Text; Supplemental Fig. S7).
Tissue map of imprinted genes
The multitissue data of this study provides an unprecedented opportunity to examine the tissue specificity of imprinting. The total number of imprinted genes in different tissues is similar, with the exception of a lower number of imprinted genes in testis, especially of paternally expressed ones (Bonferroni-corrected Fisher P = 2.4 × 10⁻⁴ for comparison of cIMP + IMP and cBI + BI) (Supplemental Fig. S12). GTEx testis samples have up to 60–70% of germline cells (The GTEx Consortium, pers. comm.), which suggests that the pattern is driven by removal of parental marks and the establishment of new, paternal marks in male germline cells in a process that may differ for maternally and paternally expressed genes.
We find that 34 of our 42 genes were biallelic in at least one tissue (Supplemental Fig. S13). Most of the imprinted genes we identified were imprinted in the vast majority of the tissues, some were imprinted in only one or two tissues, and few were intermediate. This U-shaped pattern is consistent with a previous suggestion in mouse (Prickett and Oakey 2012) and the pattern of tissue specificity of regulatory variants and gene expression (The GTEx Consortium 2015). Maternally expressed genes showed a putative trend of being imprinted in fewer tissues than paternal ones (P = 0.062 from 100,000 permutations of parental labels) (Fig. 3A). Nearly all the genes had consistent imprinting patterns across the 13 brain subregions, but L3MBTL1 appears biallelic in some subregions and imprinted in others (Supplemental Fig. S14).
Figure 3.

Variation in imprinting. (A) The number of tissues in which genes are imprinted or biallelic for maternally and paternally expressed genes. (B) Sex-specific imprinting in muscle, where females have lower median τ than males, measured across all genes identified as imprinted in muscle. Each data point corresponds to an individual. (C) An example of variation of imprinting between individuals in ZNF331, with color denoting τ (see Fig. 2). (D) Median expression level of genes in tissues where they are imprinted versus biallelic (see also Supplemental Fig. S20). Only genes with both imprinted and biallelic tissues are shown.
We find two imprinted genes with different parents-of-origin in different tissues. The growth regulatory gene IGF2 is one of the most famous imprinted genes, implicated in various disorders, and canonically considered to be paternally expressed in most tissues and biallelic, e.g., in liver (Bergman et al. 2013). Our data shows—for the first time—that the human brain consistently expresses the opposite allele than other tissues, indicating maternal expression (Fig. 4; Supplemental Fig. S15). Other genes in the locus, in particular H19, that has been thought to be expressed from the opposite allele of IGF2, do not show a corresponding change in the expressed allele. Furthermore, our observation raises the question if the reported biallelic expression in the brain subregions leptomeninges and choroid plexus (Ohlsson et al. 1994) could be a result of mixture of maternally and paternally expressing cells. The Database of Transcriptional Start Sites (Yamashita et al. 2012) does not indicate different TSSs for IGF2 in brain versus other tissues, even though a different TSS can be seen for the biallelically expressed liver (data not shown). Another gene with tissue differences in the expressed allele is GRB10, where imprinting is known to be transcript- and tissue-specific, with reported paternal expression in brain and maternal in placenta (Blagitko et al. 2000; Monk et al. 2009). We observe that muscle and blood display biallelic expression that is imbalanced towards the opposite allele than in brain, suggesting partial maternal expression, possibly driven by differences in transcript choice between tissues (Supplemental Figs. S16, S17). The GRB10 result in particular demonstrates how analysis of multiple tissues from the same individual yields very high resolution to detect even small effects of tissue specificity of the imprinted allele.
Figure 4.
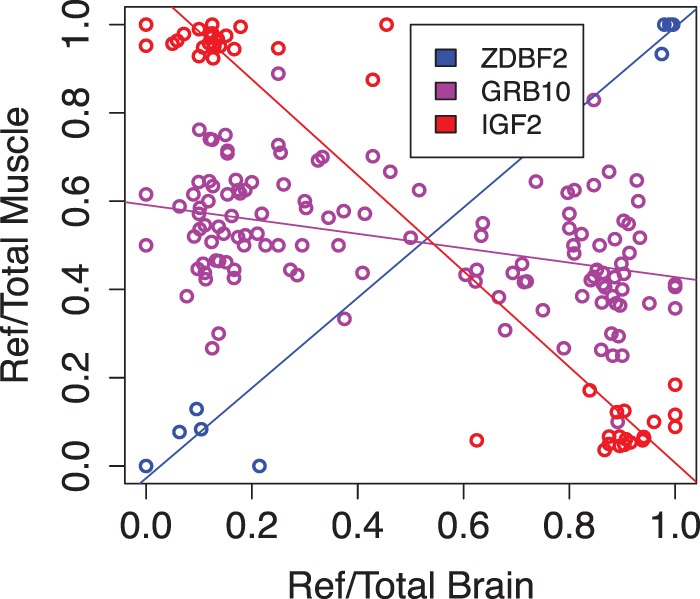
Tissue differences in the expressed allele. The figure shows comparison of the reference allele ratios of the same SNPs in the same individuals in brain and muscle. ZDBF2 is an example of the typical pattern of the same expressed allele in the two tissues; in IGF2, brain expresses a different allele than muscle, and GRB10 is strongly imprinted only in brain but has a slight signal of muscle expression from the opposite allele than in the brain. All the correlations are significant (p < 0.005).
Imprinting also exhibits inter-individual variation. Reliable, in-depth quantification of variable imprinting in the absence of family data would be very challenging due to confounding by, e.g., rare genotyping errors, eQTLs, and variation in cell-type composition, and as discussed above, our method deliberately removes genes with substantial variation to avoid false positives. However, after strict filters, a few genes in the GTEx data show suggestive variation between individuals (Fig. 3C; Supplemental Fig. S18). To analyze its potential causes, we correlated imprinting levels (τ) per individual with age and sex. In skeletal muscle, a tissue with pronounced gender differences in anatomy, males show a significantly higher level of imprinting (τ) than females (Bonferroni-corrected Mann-Whitney U test P = 0.013), especially in growth repressors ZNF331 and ZDBF2 (Fig. 3B; Supplemental Fig. S19). This shows that parental effects from imprinting can differ between genders, but the phenomenon does not appear very widespread. Donor age did not correlate with imprinting, with the caveat that only adult samples are included in the GTEx study.
Expression and methylation of imprinted genes
Expression levels of our 42 imprinted genes were higher in tissues with a role in endocrine metabolism (Supplemental Fig. S20), which is consistent with imprinted genes often being growth regulators (Skaar et al. 2012; Lawson et al. 2013). Without dosage compensation, silencing of one allele via imprinting should halve expression levels (Susiarjo et al. 2013). However, we observe no trend of lower expression levels in tissues where the genes are imprinted, versus biallelic (P = 0.80 from a paired Mann-Whitney U test for gene expression median RPKM) (Fig. 3D; Supplemental Fig. S20), which suggests that other regulatory mechanisms than imprinting have major impacts on tissue-specific expression levels. We found no significant correlation between maternal and paternal imprinting and differential expression between males and females (Supplemental Fig. S22).
Allele-specific methylation of differentially methylated regions (DMRs) is the primary epigenetic mechanism of imprinting, controlling monoallelic expression (Supplemental Fig. S6; Skaar et al. 2012; Court et al. 2014). Analysis of the methylation array data in the GenCord data set showed that imprinted genes had a significant enrichment of semimethylation (mid-range methylation proportion of 0.3 ≤ β ≤ 0.7) both in their promoters and gene bodies, with an even stronger signal in the known DMRs (Supplemental Fig. S23; Court et al. 2014). However, since methylation array data does not provide data of allelic methylation, distinguishing DMRs and putative imprinting control regions is challenging. This is demonstrated by examples of methylation landscapes in the imprinted MEST and SNRPN loci, with highly variable patterns (Supplemental Fig. S24). Thus, although epigenetic studies are important for understanding molecular mechanisms of imprinting, detecting imprinted genes from methylation array data alone (Smith et al. 2003) would be difficult, highlighting the value of allelic expression analysis from RNA-seq data and future large-scale bisulfite-sequencing studies where allelic methylation can be distinguished (Kuleshov et al. 2014).
Discussion
Although imprinting was discovered 30 yr ago (McGrath and Solter 1984; Surani et al. 1984), many of its properties still remain unclear. This study is the first systematic multitissue survey of the imprintome in humans, providing an important resource to the genetics community with many advantages over candidate gene-based data and analysis. Our novel approach to detect imprinting from RNA-sequencing data is more powerful and robust than earlier methods by utilizing genotype data, analyzing genes instead of individual SNPs, explicitly accounting for different sources of false positives, and allowing partial and variable imprinting between individuals and tissues. Analyzing a large number of samples provides powerful ways to filter for many sources of error that may cause monoallelic expression only in one or few individuals (Castel et al. 2015). Given that large collections of family samples from a wide variety of tissues do not currently exist, our approach that can utilize diverse RNA-sequencing data from projects such as GTEx provides unprecedented data of imprinting.
We would also like to point out the limitations of our approach and future directions for analysis of imprinting in humans. First, imprinting results from population-based analysis need to be validated in large-scale family-based data to (1) formally prove that detected effects are truly parental and not driven by technical or biological confounders, (2) allow detection of subtle imprinting that does not lead to (nearly) monoallelic expression, and (3) enable formal analysis of sensitivity versus specificity. Our approach is conservative because we prioritized a low number of false positives, but it is likely to miss some true effects including any heterogeneously imprinted genes. The quality of previous catalogs of imprinted genes is not well known, since the same sources of error can replicate in several studies. Monoallelic but nonparental expression of NLRP2 is a good example of an apparently false-positive signal picked up by multiple studies. We anticipate that large family data sets will eventually allow joint models to quantify genetic, epigenetic, and technical sources of allelic expression.
Standard RNA-sequencing data from tissue samples has its limitations as well. Our poly-A-mRNA data does not capture many noncoding RNAs, and in some loci, the lack of strand information and long reads covering full transcripts limits resolution. Furthermore, the RNA samples are derived from tissues that are mostly unknown mixtures of different cell types. This can potentially affect estimates of variation between tissues and between individuals. Future analysis of imprinting in specific cell types will be of importance to profile the cell-type specificity of imprinting. Finally, the low sample size in many tissues in the GTEx pilot data set and low RNA-seq coverage of lowly expressed genes limits the statistical power.
While many studies have characterized imprinting in early development and its functional role, for example, in placental function and fetal growth, our results shed light on patterns of imprinting in adults, which have been shown to have functional consequences as well (Ubeda and Gardner 2011; Dent and Isles 2014). The patterns of imprinting discovered in this study provide additional empirical data for evaluating theories for evolutionary causes for imprinting (Bartolomei and Ferguson-Smith 2011; Patten et al. 2014). While our aim was not to catalog all imprinted genes in humans, the modest number of confidently imprinted genes suggests that estimates of hundreds of imprinted genes may be inflated. However, our results demonstrate how a deep survey of diverse human tissues can still uncover novel genes not captured by previous studies. Additional assays to characterize molecular mechanisms will be important to obtain a complete picture of imprinting in these loci and the mechanisms of its variation across tissues and developmental stages. Finally, in addition to the intriguing evolutionary and molecular aspects, imprinting has important consequences in disease. Better models of parent-of-origin effects can improve the power of genome-wide association studies (GWASs), and rare variant studies should consider the possibility that heterozygous recessive variants are exposed by monoallelic expression.
Methods
Population-scale RNA-sequencing samples
The primary data used in this study come from three studies (Gutierrez-Arcelus et al. 2013; Lappalainen et al. 2013; The GTEx Consortium 2015), summarized in Supplemental Table S1. The GTEx data are in dbGaP (http://www.ncbi.nlm.nih.gov/gap) under accessions phs000424.v3.p1, phs000424.v5.p1, and phs000424.v6.p1. Briefly, the GTEx samples are collected from various tissues of post-mortem donors. In this analysis, we used 11 tissues with >35 samples, of which the brain sample is pooled by summing up the reads from different brain subregions per individual. While the GTEx samples have the advantage of being from primary tissues, they often contain multiple cell types, the proportion of which can vary between samples. All the GTEx samples are from adults, with the same age distribution in males and females. The testis samples are estimated to have up to 60–70% of germline cells (The GTEx Consortium, pers. comm.), and they are collected from 13 testis donors with a median age of 54. The Geuvadis RNA-seq data is from lymphoblastoid cell lines of the 1000 Genomes samples (Lappalainen et al. 2013); it is of note that some of the cell lines are tens of years old and have gone through a high number of passages. The Geuvadis data, including the processed ASE data, are available in ArrayExpress (http://www.ebi.ac.uk/arrayexpress/) under accession E-GEUV-1. We also used data from the GenCord project (Gutierrez-Arcelus et al. 2013) of three cell types; the main advantage of this data set is the availability of methylation data (see below). The GenCord data are available in the European Genome-phenome Archive (https://www.ebi.ac.uk/ega/) under accession EGAS00001000446.
Genotype data
The genotype data is summarized in Supplemental Table 1, and a full description is available in the respective papers. Briefly, the GTEx genotypes are based on the Illumina Omni 5M SNP array and imputed using 1000 Genomes Phase 1 as the reference (The 1000 Genomes Project Consortium 2012). Additionally, we removed heterozygous sites in the imputed data that were called homozygous in exome sequencing data. The Geuvadis data for 421 samples is from the 1000 Genomes Phase 1 release. For 41 samples in Geuvadis, and all GenCord samples, we imputed Illumina Omni 2.5M SNP array genotypes with the 1000 Genomes Phase 1 data. Only SNPs are used in the analyses of this study, and all the genotype data in this study are phased as in the original studies.
RNA-seq data
The GTEx and Geuvadis mRNA-seq data are from Illumina HiSeq sequencing of 75-bp paired-end reads at the median coverage of 45M and 80M mapped reads, respectively. The GenCord mRNA-sequencing data are 50-bp paired-end data from Illumina GAII and HiSeq with a median coverage of 34M reads. GTEx data were aligned with TopHat (Trapnell et al. 2009), Geuvadis data with GEM (Marco-Sola et al. 2012), and GenCord data with BWA (Li and Durbin 2009), and gene expression level quantifications were obtained from the original studies. Gencode v12 annotation and its gene nomenclature are used, with the exception of separating INPP5F_V2 as its own gene. Further details are available in the respective papers.
Validation data
In order to determine which of the parental haplotypes is expressed in the imprinted loci and to replicate the allele-specific expression in the imprinted genes, we examined RNA-seq data from three tissues in two different family cohorts with a total of 16 trios/duos. To validate monoallelic expression, we analyzed targeted mmPCR-seq and stranded long-read RNA-seq data (2 × 250 bp) from GTEx samples, and to characterize the relationship between imprinting and methylation, we examined methylation chip data from the GenCord study. A complete description of these data is provided in the Supplemental Text. The whole exome data from the muscle disease families can be found in dbGaP under accession phs000655.v1.p1.
Method overview
The identification of imprinted genes from RNA-sequencing and genotyping data in unrelated individuals is a specialized search for monoallelic expression. Complete monoallelic expression is, in principle, straightforward to infer. RNA-seq reads covering a heterozygous SNP will all have the reference allele and never the alternate allele or vice versa. Consider an individual with an A/T genotype, where the A was inherited paternally and the T was inherited maternally. In a paternally imprinted/maternally expressed gene, which exhibits complete monoallelic expression, all reads overlapping this A/T SNP will contain the T allele. This idea is the underlying principle for our approach.
There are several complicating and potentially confounding factors that prevent identification of imprinted genes via a direct search for complete monoallelic expression (see Supplemental Table S2 for a summary). These factors fall into two categories, functional and technical, which we describe in detail and address via specific filtering and statistical modeling approaches. The functional category consists of biological factors that complicate identification of imprinted genes. The most important of these factors is partial imprinting, in which there are parent-of-origin-based differences in expression of the two copies of the gene, but neither is completely silenced. In the example above, this would result in modest expression of the A allele in the A/T SNP (see, for example, the expression of INPP5F_V2 in fibroblasts) (Supplemental Fig. S1). Partial imprinting has been previously documented (Wolf et al. 2008; Morcos et al. 2011). Without knowledge of the parental inheritance pattern, there is a limit to how partial the imprinting can be before it is undetectable with unrelated individuals, as we are attempting in this work.
The other functional factors include common cis-regulatory variants (expression quantitative trait loci or eQTLs), nonsense-mediated decay (NMD), and random monoallelic expression, all of which are alternative biological mechanisms that could give rise to monoallelic expressions. Regulatory variants in cis cause haplotypes carrying different alleles to be higher- or lower-expressed but only in individuals heterozygous for the variant, and the effect size is rarely strong enough to cause monoallelic expression (Supplemental Fig. S3; The GTEx Consortium 2015). Nonsense-mediated decay is a mechanism that decays transcripts that carry a premature stop codon—and again individuals who are heterozygous for a nonsense variant may show monoallelic expression—but such variants typically have very low population frequencies (Rivas et al. 2015). In RME that affects some genes of the immune system, olfactory receptors, and some other gene categories, one gene copy is randomly silenced per cell (Gimelbrant et al. 2007; Eckersley-Maslin and Spector 2014). As an illustration of the latter type, Supplemental Figure S2 exemplifies the monoallelic expression created by RME. If other, as yet unknown, mechanisms for inducing monoallelic expression exist, they could also confound our approach.
The technical category consists of experimental artifacts that lead to interpretation of monoallelic expression when the gene is, in fact, biallelically expressed. These include genotyping errors, sequencing errors, mapping errors, and phasing errors. If an individual is homozygous but incorrectly genotyped as heterozygous, all RNA-seq reads will contain only one allele and the individual will appear to exhibit monoallelic expression. Sequencing errors may result in the appearance of heterozygous genotypes in the RNA-seq reads in a truly monoallelic, imprinted locus. Mapping errors refer to the incorrect alignment of RNA-seq reads. This could result in both heterozygous reads appearing in a monoallelically expressed site and vice versa, but the most difficult error mode for imprinting analysis is allelic mapping bias in sites where RNA-seq reads carrying the reference allele align correctly but the nonreference reads do not, causing false allelic bias (Degner et al. 2009; Panousis et al. 2014). Finally, phasing errors can result in the incorrect appearance of biallelic expression when combining information across multiple SNPs in the same gene. Our approach addresses each of the elements via filtering and statistical modeling steps.
Filtering steps
The input to our model is the genotypes (genotyped and imputed) of each individual and the counts of RNA-seq alleles overlapping each SNP in each individual. We first apply a series of filtering steps to address several of the technical and functional confounders described above. These include filtering RNA-seq reads according to quality, all SNPs with a Hardy-Weinberg P-value < 10−3, SNPs in genes where an individual is heterozygous for a premature stop codon, and most importantly, all SNPs failing our “flip test,” which verifies that the pattern of monoallelic expression is consistent with imprinting: We assume that with imprinting, the reference or alternative alleles are independent of parent-of-origin, and therefore the monoallelically expressed allele in a given individual has an equal probability of being either of them. Genotyping error, RNA-seq sequencing error, eQTLs, and allelic bias in RNA-seq mapping are unlikely to flip randomly between the alleles and will, therefore, fail this test. We observe that this filter removes many genotyping and mapping errors. Figure 1E depicts an example of a gene that shows signs of imprinting before the flip test is applied but not afterwards.
Statistical model
We model the status of a gene in a given individual and tissue as being classified into one of three allelic expression classes:
BAL (balanced) The gene is expressed biallelically and evenly from both gene copies.
IMB (imbalanced) The gene exhibits allelic imbalance, i.e., one gene copy has a moderately higher expression level than the other. Such imbalance may result, for example, from an eQTL.
IMP (imprinted) The gene exhibits imprinting, i.e., one gene copy has a considerably higher expression level than the other, potentially depending on the parental origin. We assume that, in this scenario, one of the copies is nearly completely silenced.
Each allelic expression class is characterized by a beta distribution, from which the levels of allelic imbalance are drawn for the relevant heterozygous sites; by the level of imbalance, we refer to the expected fraction of read counts generated from the overexpressed allele out of the total counts for that site. In balanced genes, this fraction will be close to 0.5, while in imprinted genes, close to 1. Given the expression class, our model assumes that the allele counts of the gene's heterozygous sites in a given individual are generated as follows:
The levels of allelic imbalance are drawn from the relevant beta distribution, independently for each site. We assume independent sampling, as opposed to a constant imbalance level along the gene, so as to account for isoform-specific silencing, splicing QTLs, and other biological effects that may cause inconsistency in allelic expression patterns in proximal sites, as well as for overdispersion due to technical artifacts.
For the imbalanced and imprinted classes, the identity of the overexpressed haplotype is randomly drawn; each haplotype may be overexpressed with a probability of 0.5.
If phasing was perfect, all the overexpressed alleles would reside on the same haplotype and all the underexpressed on the other. In reality, phasing errors are common, and to account for them, the identity of the overexpressed allele is flipped with probability Pp = 0.2, independently for all sites. As a result, our model utilizes phasing information but also maintains power in cases where standard phasing errors occur. In the presence of abnormally frequent phasing errors, the method will lose power.
Finally, given the allelic imbalance level, the identity of the overexpressed allele and the total count data in a given site, the reference allele counts are drawn from the corresponding binomial distribution.
The above steps provide a complete generative model for the allele count data given the total read counts, the genotypes, and the phasing information. A full description of the model, as well as the procedure for estimation of the beta parameters, appears in the Supplemental Material.
Characterization of imprinting status
Using this model we compute, for every tissue, a set of per-gene statistics over all individuals, as well as per-gene, per-individual statistics. These statistics are used to classify the gene into each of the categories of expression: balanced, imbalanced, and imprinted. In order to reduce the possibility of false positives, stringent thresholds are used, and thus it is likely that additional imprinted genes are excluded from our final list. For genes with external evidence of imprinting from previous studies, we used a relaxed threshold. Novel putatively imprinted genes meeting a relaxed threshold are summarized in Supplemental Table S4. Genes with evidence of heterogeneity between individuals were removed. All statistics for all genes are provided in Supplemental Table S5 for comparison with other existing and future studies. The full details of computation of the provided statistics are given in the Supplemental Material.
Simulations
In order to examine the edge properties of our method, we simulated read-count data for 1000 genes for five individuals and two SNPs. We simulated an average read depth of 8, 16, 50, 100, 200, and 500 reads and a degree of imprinting (i.e., allelic imbalance ratio) of 0, 0.01, 0.025, 0.05, 0.075, 0.10, 0.15, 0.2, 0.25, 0.3, 0.4, and 0.5, with 0 being complete monoallelic expression and 0.5 being complete biallelic expression. Phasing and genotyping errors were included according to the parameters described in the Supplemental Material.
We observed that for five individuals and two SNPs, our minimum requirement for attempting to classify a novel gene, no individuals were classified as imprinted at a read depth of 200 at any imbalance level, although they were all classified as putatively imprinted at a read depth of 16 and a degree of imprinting ≤0.1. At a read depth of 500, all individuals were classified as imprinted when the degree of imprinting was ≤0.025. This demonstrates the conservative nature of our test and the amount of evidence required for de novo classification of imprinting when five individuals and two SNPs are present. It also shows the potential for many of the genes in our putatively imprinted list (Supplemental Table S4) to be confirmed as imprinted in future studies.
Software availability
The software implementing all methods described in this study is in Supplemental Data file 5 and is available at GitHub (https://github.com/zaitlenLab/RNA_Imprinting).
Acknowledgments
We thank all the members of the GTEx Consortium, Marta Mele, Ferran Reverter, Carlos D. Bustamante, Emmanouil Dermitzakis, Joseph Pickrell, and Ana Pascoini. N.Z. was supported by National Institutes of Health grant 1K25HL121295-01A1, and T.L. was supported by National Institutes of Health grants HHSN26820100029C and R01MH101814. Y.B. was supported in part by a Fellowship from the Edmond J. Safra Center for Bioinformatics at Tel-Aviv University, by Israel Science Foundation grant no. 989/08, German-Israeli Foundation grant no. 1094-33.2/2010, and Binational Science Foundation grant no. 2012304. A.B. was supported by National Institutes of Health grants 1R01HL124285-01 and 1R01GM110251-01. E.K.T. was supported by a Hewlett-Packard Stanford Graduate Fellowship and a fellowship from the Natural Science and Engineering Research Council of Canada. M.A.R. was supported by a Clarendon Scholarship, NDM Studentship, and Green Templeton College Award from the University of Oxford. T.T. was supported in part by personal grants from the Finnish Cultural Foundation, Orion-Farmos Research Foundation, and Emil Aaltonen Foundation. The Genotype-Tissue Expression (GTEx) project was supported by the Common Fund of the Office of the Director of the National Institutes of Health (commonfund.nih.gov/GTEx). Additional funds were provided by the National Cancer Institute (NCI), National Human Genome Research Institute (NHGRI), National Heart, Lung, and Blood Institute (NHLBI), National Institute on Drug Abuse (NIDA), National Institute of Mental Health (NIMH), and National Institute of Neurological Disorders and Stroke (NINDS). Donors were enrolled at Biospecimen Source Sites funded by NCI\SAIC-Frederick, Inc. (SAIC-F) subcontracts to the National Disease Research Interchange (10XS170), Roswell Park Cancer Institute (10XS171), and Science Care, Inc. (X10S172). The Laboratory, Data Analysis, and Coordinating Center (LDACC) was funded through a contract (HHSN268201000029C) to The Broad Institute, Inc. Biorepository operations were funded through an SAIC-F subcontract to Van Andel Institute (10ST1035). Additional data repository and project management were provided by SAIC-F (HHSN261200800001E). The Brain Bank was supported by a supplement to University of Miami grant DA006227. Statistical methods development grants were made to the University of Geneva (MH090941), the University of Chicago (MH090951 and MH090937), the University of North Carolina–Chapel Hill (MH090936), and Harvard University (MH090948). Exome sequencing of the muscle disease families was supported by National Human Genome Research Institute Medical Sequencing Program grant U54 HG003067. The authors thank the families and patients for their participation in the GALA II study and the numerous health care providers and community clinics for their support and participation in GALA II. In particular, the authors thank the GALA II study coordinator, Sandra Salazar, and the recruiters who obtained the data: Gaby Ayala-Rodriguez, Jaime Colon, and Vivian Medina.
Footnotes
[Supplemental material is available for this article.]
Article published online before print. Article, supplemental material, and publication date are at http://www.genome.org/cgi/doi/10.1101/gr.192278.115.
Freely available online through the Genome Research Open Access option.
References
- The 1000 Genomes Project Consortium. 2012. An integrated map of genetic variation from 1,092 human genomes. Nature 491: 56–65. [DOI] [PMC free article] [PubMed] [Google Scholar]
- Babak T, Deveale B, Armour C, Raymond C, Cleary MA, van der Kooy D, Johnson JM, Lim LP. 2008. Global survey of genomic imprinting by transcriptome sequencing. Curr Biol 18: 1735–1741. [DOI] [PubMed] [Google Scholar]
- Barbaux S, Gascoin-Lachambre G, Buffat C, Monnier P, Mondon F, Tonanny MB, Pinard A, Auer J, Bessieres B, Barlier A, et al. 2012. A genome-wide approach reveals novel imprinted genes expressed in the human placenta. Epigenetics 7: 1079–1090. [DOI] [PMC free article] [PubMed] [Google Scholar]
- Bartolomei MS, Ferguson-Smith AC. 2011. Mammalian genomic imprinting. Cold Spring Harb Perspect Biol 3: a002592. [DOI] [PMC free article] [PubMed] [Google Scholar]
- Bastepe M. 2007. The GNAS locus: quintessential complex gene encoding Gsalpha, XLalphas, and other imprinted transcripts. Curr Genomics 8: 398–414. [DOI] [PMC free article] [PubMed] [Google Scholar]
- Bergman D, Halje M, Nordin M, Engstrom W. 2013. Insulin-like growth factor 2 in development and disease: a mini-review. Gerontology 59: 240–249. [DOI] [PubMed] [Google Scholar]
- Bjornsson HT, Albert TJ, Ladd-Acosta CM, Green RD, Rongione MA, Middle CM, Irizarry RA, Broman KW, Feinberg AP. 2008. SNP-specific array-based allele-specific expression analysis. Genome Res 18: 771–779. [DOI] [PMC free article] [PubMed] [Google Scholar]
- Blagitko N, Mergenthaler S, Schulz U, Wollmann HA, Craigen W, Eggermann T, Ropers HH, Kalscheuer VM. 2000. Human GRB10 is imprinted and expressed from the paternal and maternal allele in a highly tissue- and isoform-specific fashion. Hum Mol Genet 9: 1587–1595. [DOI] [PubMed] [Google Scholar]
- Castel SE, Levy-Moonshine A, Mohammadi P, Banks E, Lappalainen T. 2015. Tools and best practices for allelic expression analysis. bioRχiv. http://dx.doi.org/10.1101/016097. [DOI] [PMC free article] [PubMed] [Google Scholar]
- Chess A. 2012. Mechanisms and consequences of widespread random monoallelic expression. Nat Rev Genet 13: 421–428. [DOI] [PubMed] [Google Scholar]
- Court F, Tayama C, Romanelli V, Martin-Trujillo A, Iglesias-Platas I, Okamura K, Sugahara N, Simon C, Moore H, Harness JV, et al. 2014. Genome-wide parent-of-origin DNA methylation analysis reveals the intricacies of human imprinting and suggests a germline methylation-independent mechanism of establishment. Genome Res 24: 554–569. [DOI] [PMC free article] [PubMed] [Google Scholar]
- Crowley JJ, Zhabotynsky V, Sun W, Huang S, Pakatci IK, Kim Y, Wang JR, Morgan AP, Calaway JD, Aylor DL, et al. 2015. Analyses of allele-specific gene expression in highly divergent mouse crosses identifies pervasive allelic imbalance. Nat Genet 47: 353–360. [DOI] [PMC free article] [PubMed] [Google Scholar]
- Degner JF, Marioni JC, Pai AA, Pickrell JK, Nkadori E, Gilad Y, Pritchard JK. 2009. Effect of read-mapping biases on detecting allele-specific expression from RNA-sequencing data. Bioinformatics 25: 3207–3212. [DOI] [PMC free article] [PubMed] [Google Scholar]
- Dent CL, Isles AR. 2014. Brain-expressed imprinted genes and adult behaviour: the example of Nesp and Grb10. Mamm Genome 25: 87–93. [DOI] [PubMed] [Google Scholar]
- DeVeale B, van der Kooy D, Babak T. 2012. Critical evaluation of imprinted gene expression by RNA-Seq: a new perspective. PLoS Genet 8: e1002600. [DOI] [PMC free article] [PubMed] [Google Scholar]
- Eckersley-Maslin MA, Spector DL. 2014. Random monoallelic expression: regulating gene expression one allele at a time. Trends Genet 30: 237–244. [DOI] [PMC free article] [PubMed] [Google Scholar]
- Gimelbrant A, Hutchinson JN, Thompson BR, Chess A. 2007. Widespread monoallelic expression on human autosomes. Science 318: 1136–1140. [DOI] [PubMed] [Google Scholar]
- Gregg C, Zhang J, Weissbourd B, Luo S, Schroth GP, Haig D, Dulac C. 2010. High-resolution analysis of parent-of-origin allelic expression in the mouse brain. Science 329: 643–648. [DOI] [PMC free article] [PubMed] [Google Scholar]
- The GTEx Consortium. 2015. The Genotype-Tissue Expression (GTEx) pilot analysis: multitissue gene regulation in humans. Science 348: 648–660. [DOI] [PMC free article] [PubMed] [Google Scholar]
- Gutierrez-Arcelus M, Lappalainen T, Montgomery SB, Buil A, Ongen H, Yurovsky A, Bryois J, Giger T, Romano L, Planchon A, et al. 2013. Passive and active DNA methylation and the interplay with genetic variation in gene regulation. Elife 2: e00523. [DOI] [PMC free article] [PubMed] [Google Scholar]
- Kong A, Steinthorsdottir V, Masson G, Thorleifsson G, Sulem P, Besenbacher S, Jonasdottir A, Sigurdsson A, Kristinsson KT, Jonasdottir A, et al. 2009. Parental origin of sequence variants associated with complex diseases. Nature 462: 868–874. [DOI] [PMC free article] [PubMed] [Google Scholar]
- Kuleshov V, Xie D, Chen R, Pushkarev D, Ma Z, Blauwkamp T, Kertesz M, Snyder M. 2014. Whole-genome haplotyping using long reads and statistical methods. Nat Biotechnol 32: 261–266. [DOI] [PMC free article] [PubMed] [Google Scholar]
- Lappalainen T, Sammeth M, Friedlander MR, ‘t Hoen PA, Monlong J, Rivas MA, Gonzalez-Porta M, Kurbatova N, Griebel T, Ferreira PG, et al. 2013. Transcriptome and genome sequencing uncovers functional variation in humans. Nature 501: 506–511. [DOI] [PMC free article] [PubMed] [Google Scholar]
- Lawson HA, Cheverud JM, Wolf JB. 2013. Genomic imprinting and parent-of-origin effects on complex traits. Nat Rev Genet 14: 609–617. [DOI] [PMC free article] [PubMed] [Google Scholar]
- Li H, Durbin R. 2009. Fast and accurate short read alignment with Burrows-Wheeler transform. Bioinformatics 25: 1754–1760. [DOI] [PMC free article] [PubMed] [Google Scholar]
- Li H, Su X, Gallegos J, Lu Y, Ji Y, Molldrem JJ, Liang S. 2012. dsPIG: a tool to predict imprinted genes from the deep sequencing of whole transcriptomes. BMC Bioinformatics 13: 271. [DOI] [PMC free article] [PubMed] [Google Scholar]
- Lo HS, Wang Z, Hu Y, Yang HH, Gere S, Buetow KH, Lee MP. 2003. Allelic variation in gene expression is common in the human genome. Genome Res 13: 1855–1862. [DOI] [PMC free article] [PubMed] [Google Scholar]
- Luedi PP, Dietrich FS, Weidman JR, Bosko JM, Jirtle RL, Hartemink AJ. 2007. Computational and experimental identification of novel human imprinted genes. Genome Res 17: 1723–1730. [DOI] [PMC free article] [PubMed] [Google Scholar]
- Marco-Sola S, Sammeth M, Guigo R, Ribeca P. 2012. The GEM mapper: fast, accurate and versatile alignment by filtration. Nat Methods 9: 1185–1188. [DOI] [PubMed] [Google Scholar]
- Maynard ND, Chen J, Stuart RK, Fan JB, Ren B. 2008. Genome-wide mapping of allele-specific protein-DNA interactions in human cells. Nat Methods 5: 307–309. [DOI] [PubMed] [Google Scholar]
- McGrath J, Solter D. 1984. Completion of mouse embryogenesis requires both the maternal and paternal genomes. Cell 37: 179–183. [DOI] [PubMed] [Google Scholar]
- Monk D, Arnaud P, Frost J, Hills FA, Stanier P, Feil R, Moore GE. 2009. Reciprocal imprinting of human GRB10 in placental trophoblast and brain: evolutionary conservation of reversed allelic expression. Hum Mol Genet 18: 3066–3074. [DOI] [PubMed] [Google Scholar]
- Morcos L, Ge B, Koka V, Lam KC, Pokholok DK, Gunderson KL, Montpetit A, Verlaan DJ, Pastinen T. 2011. Genome-wide assessment of imprinted expression in human cells. Genome Biol 12: R25. [DOI] [PMC free article] [PubMed] [Google Scholar]
- Morison IM, Paton CJ, Cleverley SD. 2001. The imprinted gene and parent-of-origin effect database. Nucleic Acids Res 29: 275–276. [DOI] [PMC free article] [PubMed] [Google Scholar]
- Morison IM, Ramsay JP, Spencer HG. 2005. A census of mammalian imprinting. Trends Genet 21: 457–465. [DOI] [PubMed] [Google Scholar]
- Nag A, Savova V, Fung HL, Miron A, Yuan GC, Zhang K, Gimelbrant AA. 2013. Chromatin signature of widespread monoallelic expression. Elife 2: e01256. [DOI] [PMC free article] [PubMed] [Google Scholar]
- Nikaido I, Saito C, Mizuno Y, Meguro M, Bono H, Kadomura M, Kono T, Morris GA, Lyons PA, Oshimura M, et al. 2003. Discovery of imprinted transcripts in the mouse transcriptome using large-scale expression profiling. Genome Res 13: 1402–1409. [DOI] [PMC free article] [PubMed] [Google Scholar]
- Ohlsson R, Hedborg F, Holmgren L, Walsh C, Ekstrom TJ. 1994. Overlapping patterns of IGF2 and H19 expression during human development: biallelic IGF2 expression correlates with a lack of H19 expression. Development 120: 361–368. [DOI] [PubMed] [Google Scholar]
- Panousis NI, Gutierrez-Arcelus M, Dermitzakis ET, Lappalainen T. 2014. Allelic mapping bias in RNA-sequencing is not a major confounder in eQTL studies. Genome Biol 15: 467. [DOI] [PMC free article] [PubMed] [Google Scholar]
- Pant PV, Tao H, Beilharz EJ, Ballinger DG, Cox DR, Frazer KA. 2006. Analysis of allelic differential expression in human white blood cells. Genome Res 16: 331–339. [DOI] [PMC free article] [PubMed] [Google Scholar]
- Patten MM, Ross L, Curley JP, Queller DC, Bonduriansky R, Wolf JB. 2014. The evolution of genomic imprinting: theories, predictions and empirical tests. Heredity 113: 119–128. [DOI] [PMC free article] [PubMed] [Google Scholar]
- Peters J. 2014. The role of genomic imprinting in biology and disease: an expanding view. Nat Rev Genet 15: 517–530. [DOI] [PubMed] [Google Scholar]
- Prickett AR, Oakey RJ. 2012. A survey of tissue-specific genomic imprinting in mammals. Mol Genet Genomics 287: 621–630. [DOI] [PubMed] [Google Scholar]
- Proudhon C, Bourc'his D. 2010. Identification and resolution of artifacts in the interpretation of imprinted gene expression. Brief Funct Genomics 9: 374–384. [DOI] [PMC free article] [PubMed] [Google Scholar]
- Rivas MA, Pirinen M, Conrad DF, Lek M, Tsang EK, Karczewski KJ, Maller JB, Kukurba KR, DeLuca D, Fromer M, et al. 2015. Effect of predicted protein-truncating genetic variants on the human transcriptome. Science 348: 666–669. [DOI] [PMC free article] [PubMed] [Google Scholar]
- Ruf N, Dunzinger U, Brinckmann A, Haaf T, Nurnberg P, Zechner U. 2006. Expression profiling of uniparental mouse embryos is inefficient in identifying novel imprinted genes. Genomics 87: 509–519. [DOI] [PubMed] [Google Scholar]
- Skaar DA, Li Y, Bernal AJ, Hoyo C, Murphy SK, Jirtle RL. 2012. The human imprintome: regulatory mechanisms, methods of ascertainment, and roles in disease susceptibility. ILAR J 53: 341–358. [DOI] [PMC free article] [PubMed] [Google Scholar]
- Smith RJ, Dean W, Konfortova G, Kelsey G. 2003. Identification of novel imprinted genes in a genome-wide screen for maternal methylation. Genome Res 13: 558–569. [DOI] [PMC free article] [PubMed] [Google Scholar]
- Surani MA, Barton SC, Norris ML. 1984. Development of reconstituted mouse eggs suggests imprinting of the genome during gametogenesis. Nature 308: 548–550. [DOI] [PubMed] [Google Scholar]
- Susiarjo M, Sasson I, Mesaros C, Bartolomei MS. 2013. Bisphenol a exposure disrupts genomic imprinting in the mouse. PLoS Genet 9: e1003401. [DOI] [PMC free article] [PubMed] [Google Scholar]
- Trapnell C, Pachter L, Salzberg SL. 2009. TopHat: discovering splice junctions with RNA-seq. Bioinformatics 25: 1105–1111. [DOI] [PMC free article] [PubMed] [Google Scholar]
- Ubeda F, Gardner A. 2011. A model for genomic imprinting in the social brain: adults. Evolution 65: 462–475. [DOI] [PubMed] [Google Scholar]
- Wolf JB, Cheverud JM, Roseman C, Hager R. 2008. Genome-wide analysis reveals a complex pattern of genomic imprinting in mice. PLoS Genet 4: e1000091. [DOI] [PMC free article] [PubMed] [Google Scholar]
- Yamashita R, Sugano S, Suzuki Y, Nakai K. 2012. DBTSS: DataBase of Transcriptional Start Sites progress report in 2012. Nucleic Acids Res 40: D150–D154. [DOI] [PMC free article] [PubMed] [Google Scholar]
- Zhang R, Li X, Ramaswami G, Smith KS, Turecki G, Montgomery SB, Li JB. 2014. Quantifying RNA allelic ratios by microfluidic multiplex PCR and sequencing. Nat Methods 11: 51–54. [DOI] [PMC free article] [PubMed] [Google Scholar]