

Abstract
Conservation and breeding programs aim at maintaining the most diversity, thereby avoiding deleterious effects of inbreeding while maintaining enough variation from which traits of interest can be selected. Theoretically, the most diversity is maintained using optimal contributions based on many markers to calculate coancestries, but this can decrease fitness by maintaining linked deleterious variants. The heterogeneous patterns of coancestry displayed in pigs make them an excellent model to test these predictions. We propose methods to measure coancestry and fitness from resequencing data and use them in population management. We analyzed the resequencing data of Sus cebifrons, a highly endangered porcine species from the Philippines, and genotype data from the Pietrain domestic breed. By analyzing the demographic history of Sus cebifrons, we inferred two past bottlenecks that resulted in some inbreeding load. In Pietrain, we analyzed signatures of selection possibly associated with commercial traits. We also simulated the management of each population to assess the performance of different optimal contribution methods to maintain diversity, fitness, and selection signatures. Maximum genetic diversity was maintained using marker-by-marker coancestry, and least using genealogical coancestry. Using a measure of coancestry based on shared segments of the genome achieved the best results in terms of diversity and fitness. However, this segment-based management eliminated signatures of selection. We demonstrate that maintaining both diversity and fitness depends on the genomic distribution of deleterious variants, which is shaped by demographic and selection histories. Our findings show the importance of genomic and next-generation sequencing information in the optimal design of breeding or conservation programs.
The main goal in population management is to maintain the most genetic diversity to maximize the survival potential of the population, as well as to potentially select variants that have fitness consequences (Frankham et al. 2002). Conservation programs usually use small numbers of breeding individuals, and thus, genetic variation can decrease rapidly. In commercial breeding programs, artificial selection can lead to a reduction in overall diversity and an increase in inbreeding (Lush 1946). This can have highly detrimental consequences if breeds lose their ability to adapt to different environmental conditions or if deleterious variants are linked to selected loci. Conservation and commercial breeding programs, therefore, are not so different in their approach of managing their populations, although their ultimate goals differ. Inbreeding depression (Charlesworth and Charlesworth 1987) is a common phenomenon in captive populations of many wild species like wolves (Laikre and Ryman 1991) and also in many breeds of domesticated species like dogs (Leroy 2011; O'Neill et al. 2014). Thus, breeders are aware of the need to maintain diversity while also preserving genetic variants that confer desired, distinct phenotypes.
For this purpose, controlling the inbreeding rate and, therefore, optimizing the effective population size, is required. Currently, the best known method to achieve these goals is optimal contributions (OC). This method determines the number of offspring that each individual of the current population should contribute to the next generation so as to minimize global coancestry (Ballou and Lacy 1995; Meuwissen 1997; Grundy et al. 1998). Relatedness, i.e., coancestries between individuals, is needed to apply OC in any management program. Traditionally, genealogical coancestries were used when OC were first proposed because marker data were scarce (Ballou and Lacy 1995). Currently, OC based on molecular coancestry is the best way to maintain the most diversity in terms of heterozygosity, provided genotypes are of high density (de Cara et al. 2011; Gómez-Romano et al. 2013). However, management of populations using OC with molecular coancestry may lead to a fitness decrease, since deleterious alleles linked to the markers used to measure coancestry will be maintained (de Cara et al. 2013a). Recently, a measure of coancestry based on shared genomic regions has been proposed as a compromise to maintain both fitness and genetic diversity when the population in the program has a medium to high inbreeding load (de Cara et al. 2013b). One of the aims of this approach is to avoid the occurrence of long runs of homozygosity (ROH) in the offspring, which are characteristic of reduced diversity, due either to selection or bottlenecks and therefore, may confer inbreeding depression (Keller and Waller 2002; Szpiech et al. 2013; Curik et al. 2014). Determining the occurrence of segments of identity by descent (IBD) in potential parents, thereby measuring their relatedness and coancestry, can be used to minimize the occurrence of ROHs in the offspring.
Predictions for management based on genealogical, molecular, or IBD segments have been made with simulated data (de Cara et al. 2013b), but have so far not been tested with actual genotype data. Pigs are an excellent model for testing the use of genetic data in population management. Various molecular data sources are available, like a high-quality genome reference (Groenen et al. 2012) and genotyping arrays (Ramos et al. 2009). Pedigree information is also available for a variety of breeds and other captive populations. Pigs display a high degree of heterogeneity in the occurrence of ROHs (Bosse et al. 2012), which to a large extent reflects differences in their demographic histories. The domesticated pig Sus scrofa consists of many commercial breeds that are under strong artificial selection for commercial traits. Although this particular species is widespread in captivity as well as in the wild, other pig species within the genus Sus only occur on a few islands in Southeast Asia and are critically endangered, like the Visayan warty pig Sus cebifrons (Larson et al. 2005, 2007; Groves 2008). Breeding programs for S. cebifrons in zoos have been set up to maintain the species at least in captivity.
Here, we combine pedigree information, genotype data, and next-generation sequencing data to perform in silico management of two pig populations with distinctly different histories: a commercially maintained population of the Pietrain breed of S. scrofa; and a captive zoo population of the critically endangered S. cebifrons species. By comparing the decay of heterozygosity over 10 generations, we assess which of three management strategies maintains the most diversity. These strategies are based on (1) genealogical coancestry; (2) molecular marker-by-marker coancestry; or (3) shared regions of the genome. As S. cebifrons is known to have undergone recent bottlenecks that have led to establishing the conservation programs for this species in captivity, we infer the demography of Sus cebifrons to determine the effect of population-specific demography on the management outcome. On the other hand, to understand the effect of the management strategy on ongoing selection in the population, we identify signatures of selection in the Pietrain breed before and after management. Thus, we investigate whether the best strategy is sensitive to demographic history or initial patterns of variation in the population and how this information is relevant to conservation practitioners; and by analyzing signatures of selection, we address whether any of the management strategies may interfere with selection goals by erasing these signatures. Finally, by predicting fitness based on deleterious variants in the genome in both populations, we show the performance of each of these management strategies not only on diversity but also on fitness because ignoring the latter could lead to the accumulation of deleterious variants, loss of viability, and potentially to extinction of the population in a conservation program.
Results
Genetic diversity before management
We assessed the genetic characteristics of both populations. The average nucleotide diversity over the full genome was higher within Pietrain pigs (mean π = 0.00175), although the distribution of variation was much more homogeneous in the genome of S. cebifrons pigs (mean π = 0.00105) (Fig. 1). Both populations contained signatures of recent coancestry between haplotypes in their genome, either as ROH within individuals or as shared IBD segments between individuals. Observed heterozygosity, based on the selected markers that were used for the in silico management, was 0.308 for Pietrain pigs and 0.302 for S. cebifrons; and genetic diversity was 0.296 in the Pietrain population and 0.258 in the S. cebifrons population. These numbers were used solely for comparison purposes between the different management strategies after 10 generations. The relatedness within the S. cebifrons population, based on their genealogy, ranged from unrelated to half-sibs, as can be seen in their pedigree and phylogenetic tree (Supplemental Fig. S1A,B). Relatedness within the Pietrain population was more evenly distributed as can be seen in the phylogenetic tree in Supplemental Figure S2.
Figure 1.

Genome-wide variation in individual pigs. The nucleotide variation within the genome of two individuals for each population is displayed. In the large box, the x-axis shows the full length of Chromosome 1 in base pairs (bp), and the y-axis shows the nucleotide diversity within an individual genome in number of heterozygous sites (SNPs) per bp. Values are averaged over bins of 1 Mbp. The small histogram within each box represents the distribution of nucleotide diversity per bin of 1 Mbp for all autosomes. (A) The zoo population of Sus cebifrons. (B) The commercial Pietrain population.
Demography of Sus cebifrons
The zoo population of S. cebifrons consisted of a few individuals that have only recently been transferred from the wild. To understand their low diversity compared to other closely related species (see also Bosse et al. 2012), we analyzed their demographic history, for which we used two independent methods to reconstruct the past effective population size over time: pairwise sequential Markov coalescent (PSMC) (Li and Durbin 2011); and a method based on the distribution of lengths of ROHs in the current population (MacLeod et al. 2013). Both methods indicated two population expansions, followed by a bottleneck (Fig. 2). All five individuals displayed similar demographic patterns (Fig. 2B). The effective population size seems to have been relatively low since the last bottleneck ∼10,000 yr ago.
Figure 2.
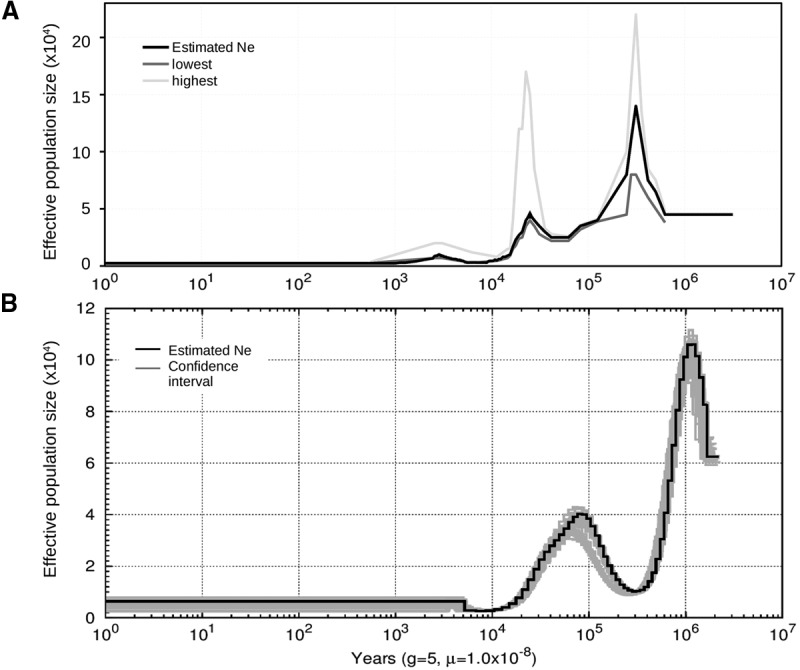
Demographic history of Sus cebifrons. Two methods were used to infer the demographic history of the wild Sus cebifrons population based on the genome sequence of one male. (A) The method by MacLeod et al. (2013). The original estimated Ne is visualized in black, and the upper and lower limits of the confidence interval are indicated. (B) The method by Li and Durbin (2011) (PSMC). The original estimated Ne values for the same individual are indicated in black, and the gray lines represent 10 bootstrap estimates for this particular individual and the other four are individuals from the same population. For both methods, the generation time was set at 5 yr, and the mutation rate at 1.0 × 10⁻⁸ and scaled for the false negative rate. The x-axis displays the time before present in years, and the y-axis displays the estimated effective population size.
Deleterious variants
Because demographic history largely determines the inbreeding load in a population, we looked at putative damaging mutations in the five resequenced S. cebifrons individuals and 11 Pietrain pigs. Two classes of predicted deleterious variants were observed: high-frequency alleles close to fixation and rare alleles. The Sus cebifrons population contained much more (nearly) fixed predicted deleterious homozygous variants (Supplemental Text; Supplemental Table S1; Supplemental Fig. S3). For the purpose of this study, however, we focused on the low-frequency putative deleterious variants for the prediction of fitness. The total number of predicted low-frequency deleterious variants within the S. cebifrons population was 3129, and the average number per individual was 813. Gene ontology (GO) enrichment analysis showed generally an underrepresentation of genes coding for nucleotide binding proteins and an overrepresentation of genes coding for cell adhesion molecules (Supplemental Table S2). The number of low-frequency deleterious sites within the 11 resequenced Pietrain pigs was 3468, with on average 656 sites per individual. Interestingly, an obvious overlap in GO terms was found in the enrichment analysis in genes containing low-frequency deleterious sites in the Pietrain and S. cebifrons populations (Supplemental Table S2). Genes involved in transcription, RNA metabolic processes, and nucleic acid binding had significantly less deleterious mutations than expected in both groups. Most predicted deleterious sites were found in the heterozygous state in only one individual.
Signatures of selection in Pietrain
This line of the Pietrain breed has been under strong artificial selection pressure for at least 30 generations, which corresponds to roughly 50 yr. This selection is thought to result in long haplotypes in some regions in the genome with reduced variation (Groenen et al. 2012; Qanbari et al. 2014). Therefore, we screened the genomes of Pietrain pigs and identified numerous regions containing ROHs (Supplemental Figure S4). The length distribution of these ROHs ranged from 3.0 Mb to 132.1 Mb, with an average of 12.8 Mb. Chromosome 10 contained the least ROH coverage, and Chromosome 8 contained the most. Some ROHs were clustered within a particular region of the genome, whereas others appear more randomly distributed. Chromosomes 8 and 15 contained many ROHs at the same locus, indicating selection for a specific haplotype close to fixation. Based on the integrated haplotype score (iHS), we found the strongest signatures of ongoing selection on Chromosomes 13 and 15 (Fig. 3).
Figure 3.
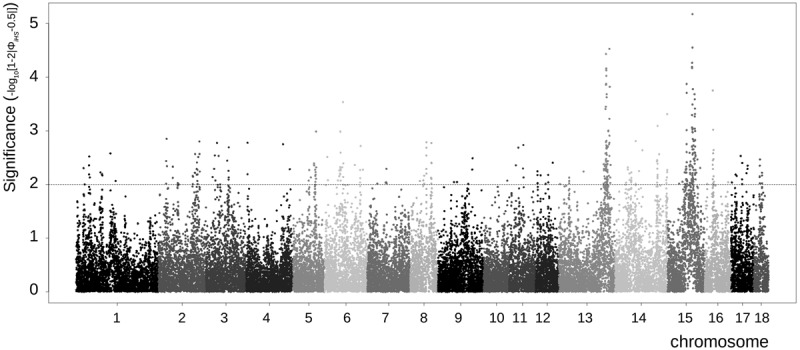
Signatures of selection in the Pietrain population. Extended haplotype homozygosity per chromosome for the Pietrain population. Values are based on the raw iHS signal before management over all chromosomes in the Pietrain population. The x-axis displays the location on all 18 autosomes, and the y-axis shows the P-value of the iHS signal before management for each marker. Values greater than 2 are considered to be significant according to Voight et al. (2006).
Effect of management on genetic diversity
We recorded the observed heterozygosity and genetic diversity in both populations during 10 generations of simulated management of both species. Management based on molecular coancestry maintained the highest level of genetic diversity in both populations (Fig. 4). Management based on IBD segments performed better in terms of diversity than management based on genealogical coancestry, with management based on longer segments maintaining less variation than management based on shorter segments. The loss of genetic variation was stronger in the S. cebifrons population than in the Pietrain population, and the difference in this loss between management strategies was also larger in the S. cebifrons population (Fig. 4A,B). After 10 generations of management based on genealogical coancestry, the observed heterozygosity in the S. cebifrons population dropped from ∼0.3 to below 0.18, whereas molecular-based management strategies maintained the level of observed heterozygosity above 0.21 (Fig. 4A). After the first generation of molecular-based management, the Pietrain population contained slightly more genetic variation than the base population in terms of heterozygosity, but this variation dropped from the second generation onward (Fig. 4B).
Figure 4.

Variation in both pig populations during management. Evolution of genetic diversity (GD) and observed heterozygosity (OH) during 10 generations under five different management strategies. (A) Variation in the S. cebifrons population. The population size is kept constant at 10 individuals with a male to female ratio of 1:4. (B) Variation in the Pietrain population. The population size is kept constant at 50 individuals with a male to female ratio of 1:1.
Effect of management on fitness
Fitness of individuals in the S. cebifrons population was measured based on the deleterious sites in their genome and a given distribution of mutational effects (see Methods; Supplemental Information). We recorded the total number of deleterious sites in the population and also the proportion of homozygous and heterozygous deleterious variants. The proportion of deleterious variants within individuals remained relatively stable over time, whatever the management strategy (Fig. 5A). However, the proportion of homozygous deleterious variants gradually increased, whereas the proportion of heterozygous ones conversely decreased. The slopes were slightly steeper under the genealogy-based management strategy than under marker-assisted management and were steepest with random management. The effect on fitness of management depended on the mean selection (s) and dominance (h) coefficients of the deleterious variants (Fig. 5B,C): The lower the mean h value, the larger the decline in fitness after 10 generations (about 0.08 for h = 0.35 and 0.006 for h = 0.5). Based on predictions made on simulated data (de Cara et al. 2013b), we expected that the strategy that maintained the most diversity would be the one that performed the worst in terms of fitness. However, and maybe partly due to the small population size here managed, genealogical management resulted both in maintaining less fitness and diversity than any marker-based strategy (Fig. 5B–D). Management based on shared segments and marker-by-marker performed relatively similarly in terms of fitness for the S. cebifrons population, but the exact size of shared segments for which the most fitness was maintained depended on a balance between segment size to measure coancestry and the distribution of mutational effects (i.e., both on the mean values of s and h and their distribution) because the length of a particular segment is related both to the distribution of mutational effects and to the demographic history. Concerning fitness, the loss of heterozygous deleterious variants was slowest in the marker-by-marker coancestry, and the increase in homozygous deleterious variants was slowest in the segment-based management for S. cebifrons (Fig. 5A). These factors result in a slightly higher fitness in the segment-based managed population, especially for lower dominance (Fig. 5B,C).
Figure 5.

Fitness and diversity during management of the S. cebifrons population. The change in fitness and observed heterozygosity (OH) during 10 generations of management is displayed for five different management strategies. (A) The proportion of deleterious sites is displayed on the y-axis and the generations are shown on the x-axis for the scenario in B (s = 0.005 and h = 0.5). Deleterious sites are split into homozygous sites (filled circles), heterozygous sites (filled squares), and the total number of deleterious sites (open circles). (B) Fitness change over 10 generations of management when a dominance coefficient of 0.5 is applied. (C) Fitness change over 10 generations of management when a dominance coefficient of 0.35 is applied. (D) Observed heterozygosity during 10 generations of management.
After 10 generations of management, the fitness in the Pietrain population was lowest with the genealogical-based management under both scenarios (Supplemental Fig. S5). This strategy maintained the least fitness under both scenario 1 (s = 0.005 and h = 0.5) and scenario 2 (s = 0.005 and h = 0.35) (Supplemental Fig. S5), and it performed even worse than managing at random under scenario 1. Although the marker-by-marker-based management outperformed the segment-based management in terms of observed heterozygosity (Supplemental Fig. S5), more fitness was maintained with the intermediate segment-based management under scenario 1 and roughly the same with the intermediate and long segments in scenario 2.
Effect of management on the detection of selective sweeps in Pietrain
We used the iHS statistic (Voight et al. 2006) to screen for selective sweeps in the Pietrain population before and after 10 generations of management. This statistic is designed to identify selection by searching for a long haplotype at high frequency in the population. Some haplotypes were fixed in the population, resulting in regions without a signal, similar to the pericentral gaps observed on Chromosome 8 (Supplemental Figs. S2, S6A). As shown in Figure 6 and Supplemental Figure S6A, regions that were identified before management as having the highest P-value for a selective sweep have after management a larger difference in iHS signal before and after management than regions without selective sweeps. For example, the sweep on Chromosome 13 was no longer present in the population after 10 generations of management (Fig. 6A). This indicates that the signature left by a selective sweep is counteracted when the management strategy aims at optimizing variation in the genome. Indeed, we observed a positive correlation of 0.68 between the P-value for each marker before management and the difference in iHS signal before and after management (Fig. 6B), meaning that incomplete sweeps signals were reduced because of the management. The tails of the distribution of this difference in iHS signal before and after management were fatter when using the segment-based management strategy (up to segments of 5 Mb) compared to those that result when managing with the genealogy-based strategy (Supplemental Fig. S6B). This means that the segment-based strategy was more efficient in reducing the presence of long, similar haplotypes in the next generation. Therefore, in previously identified regions under selection, the reduction of the selection signature was stronger for the segment-based management strategies than for the genealogy-based method.
Figure 6.
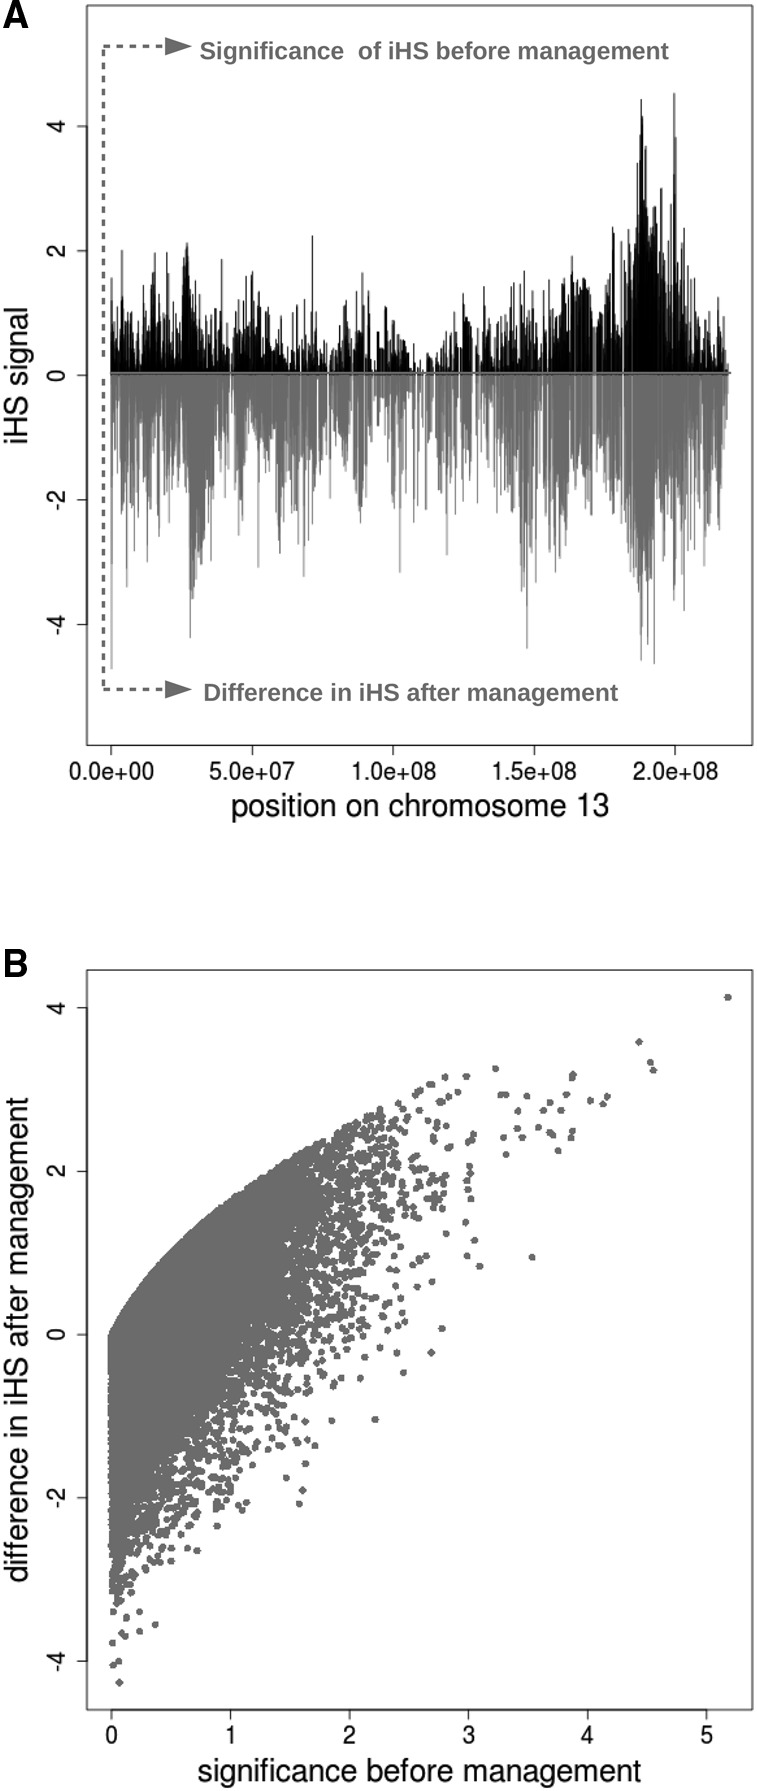
Change in selective sweeps in the Pietrain population. Signatures of selection are measured as extended haplotype homozygosity (iHS signal) in the Pietrain population before and after management. (A) Example of the effect of management on the selective sweep on Chromosome 13. The significance level of the iHS signal before management are indicated in black (−log(p), y-axis) and range between 0 and 4, so that markers with a signal greater than 2 are considered to be significant. Differences in iHS signal per marker before and after management are indicated in gray and range from 0 to −5, with a strong negative number indicating a large difference. (B) Genome-wide correlation between the significance level of the iHS signal before management (x-axis) and the strength in iHS signal per marker before and after management (y-axis). Negative values on the y-axis indicate a stronger signal in the population after management for the associated marker.
Discussion
Simulated data have predicted that using genetic marker information in the management of populations can maintain more variation than without this information (de Cara et al. 2011). Here, we have performed an empirical study to address the impact of whole-genome marker-assisted management strategies on (1) maintaining diversity; (2) the effect of the demographic history on the management strategy; (3) the impact on linked deleterious variants in the viability of the population; and (4) the maintenance of signatures of selection.
Management strategies: maintaining diversity
Our first objective was to determine whether the use of marker-by-marker based coancestry in management strategies outperforms genealogical coancestry and the recently postulated IBD-based coancestry (de Cara et al. 2013b) in terms of maintaining variation in a population. By managing the two pig populations through in silico management, with their actual genotypes, we have shown that the best management strategy in terms of maintaining diversity was using molecular coancestry. Using genealogical coancestry maintained the least diversity, whereas using segment-based coancestry yielded intermediate results. These two measures are similar in theory because genealogical coancestry is highly correlated with segment-based coancestry for long segment sizes (Keller and Waller 2002). However, genealogical coancestry is the expected relationship between individuals, whereas segment-based coancestry will vary between individuals with the same genealogical relatedness depending on the actual gene variants that they carry and where meiosis has occurred. As reviewed by Curik et al. (2014), inbreeding based on ROHs is a more reliable measure of autozygosity than inbreeding based on genealogies. This shows the potential of using ROH-based measures to develop optimal strategies in areas like breeding and conservation.
The efficiency of the molecular coancestry strategy stems from the fact that OC optimizes expected heterozygosity based on the differentiation between individuals; and thus, the more markers, the better we can differentiate them. These results are consistent with a previous simulation study (de Cara et al. 2011). Note that in both cases, we had a high density of markers available because using molecular coancestry with a low density of markers will not maintain as much diversity as genealogical coancestry (Fernández et al. 2005; Gómez-Romano et al. 2013). Besides using optimal contributions, the loss of genetic variation in small populations can be mitigated by advances in reproductive technologies, including gamete banking and cloning of appropriately identified individuals, when it is ethically and financially possible (Friese 2013; Friese and Marris 2014).
Demography, selection, and genetic diversity
Our second objective was to understand whether a reduction of genetic diversity due to selection or to demographic history could have an effect on the management. Whether inbreeding has an effect on the population in the long term depends on multiple factors, like deleterious variants currently present in the population. Demographic history plays an important role in the number and distribution of fitness-related variants in a population. Deleterious variants can be most problematic if the population suffers a sudden bottleneck and if mutations are abundant and recessive, especially if their selection coefficient is high (Lynch et al. 1995).
The two pig populations studied here have high levels of inbreeding, but for very different reasons. Our analyses of the demographic history of Sus cebifrons show two large reductions in its effective population size. Compared to other Sus species, the effective population size dropped drastically during the first bottleneck ∼10,000 years ago (Frantz et al. 2013). The second bottleneck is recent, possibly due to reduction in its habitat and over-hunting, resulting in its current status as critically endangered (Oliver 2008). These events probably resulted in a relatively low base level of variation in S. cebifrons compared to other Sus species (Bosse et al. 2012) and which is unlikely to increase in the (near) future. Sus cebifrons may become extinct in nature within a few decades. Therefore, given the very low variation in Sus cebifrons, an optimal management is crucial to minimize its decay in captivity, thus avoiding losing its potential for further adaptation. Although identifying variation will certainly help to slow down the decay of genetic variability, it cannot guarantee the survival of the population. The reduced decay can help if the situation in the wild changes and there is habitat recovery, for instance, so that the population could be reintroduced if extinct in the wild. Alternatively, genetic rescue or even genome editing technology may help rectifying the accumulation of deleterious variants. This would require that the population survives long enough to make these techniques economically feasible. If habitat recovery and the associated population growth come too late, then managing genetic variation in a conservation program is a more realistic scenario that may become necessary to maintain many endangered species.
The Pietrain breed of Sus scrofa is widely used commercially, and has been strongly selected. Although this breed is widely distributed, the number of individuals that contribute to a specific selection line is limited, which is a general pattern for livestock populations. Therefore, active management to maintain genetic diversity in breeding programs has been suggested (Brotherstone and Goddard 2005). As we have shown, the different histories of the two pig populations studied here result in different patterns of genetic diversity—Sus cebifrons having a lower overall genetic diversity, whereas Pietrain shows larger runs of homozygosity but an overall larger diversity than Sus cebifrons. Many ROHs in the Pietrain population could be due to selection rather than inbreeding, as has been observed for other commercial pigs (Bosse et al. 2012), whereas the ROHs in the S. cebifrons population are probably due to consanguineous matings, as can be seen in their pedigree. Given their limited contemporary effective population size, avoiding inbreeding to maintain the most diversity is desired to avoid inbreeding depression. This will apply to most captive (zoo) populations and commercially kept farm animals (Lacy 2013).
Bottlenecks can lead to the accumulation of deleterious mutations by drift; and therefore, it is important to know both the current population viability and history. A population that has undergone a bottleneck and that is perfectly viable, is likely to either have undergone purging or just never had viability issues, whereas a population with viability issues may have accumulated recessive variants of small effect that are difficult to eliminate by natural selection. Which variants are maintained can be essential for the success of the breeding program. Actively changing the genetic composition in a population through management may, as a side effect, reduce the frequency of advantageous variants or increase the number of deleterious alleles. Therefore, the impact of management on fitness should be considered.
Management strategies: impact on fitness
Thirdly, by identifying putative deleterious variants in the population and plugging them into the simulations, we have investigated whether the strategy that maintains the most diversity leads to maintaining the highest frequency of deleterious variants, which could lead to inbreeding depression. Previous simulation results had shown that when the population exhibited some inbreeding load, managing the population with segment-based coancestry was the best strategy in terms of maintaining a compromise between maintaining diversity without accumulating too many deleterious mutations (de Cara et al. 2013b). We have explored the robustness of these results here with real data and shown that it is indeed the case, i.e., that the segment-based approach can provide a compromise between maintaining fitness and diversity.
We used predicted deleterious variants in the genome as a proxy for fitness. The distribution and number of deleterious mutations depend on the demographic history of a population and therefore have an impact on fitness. Changes in the frequencies of homozygous and heterozygous deleterious alleles can have substantial consequences for the overall fitness of the population as we have shown. Thus, the management strategy, by acting on linked deleterious variation, can have a massive impact on fitness and fitness-related traits like viability. Long runs of homozygosity are thought to be enriched in deleterious mutations (Szpiech et al. 2013). Our results show that avoiding these ROHs in the offspring, which is the essential concept in the segment-based management, seems an effective method to maintain a viable managed population.
The putative deleterious variants in both populations occurred significantly less often in particular gene families like nucleotide binding proteins, suggesting that these gene families are either less prone to mutation or more effective in purging the deleterious variants from the population. On the other hand, this may indicate that if a mutation occurs in any of these genes, the effect is more severe. Multiple methods have already been developed in order to predict the severity of particular mutations (e.g., Ng and Henikoff 2001; Wang et al. 2010; Choi et al. 2012). Therefore, the use of sequence data will have an increasingly important value in conservation and selection programs because these variants and their effect can be identified and implemented into the breeding scheme, vastly improving our predictions and in silico analyses.
Changes in fitness when applying molecular or segment-based OC to the S. cebifrons population were limited. This is probably due to the very limited population size, which restricts the number of possible choices that can be made under both scenarios. However, segment-based coancestry resulted in somewhat higher fitness because the proportion of deleterious homozygous sites increased at a slower pace than with molecular coancestry. This had an effect on fitness, particularly in the case of low dominance (h). Most fitness is lost when using genealogical coancestry strategy, which contrasts with previous simulation results that showed that this strategy maintains the highest level of fitness in other scenarios (de Cara et al. 2013b). This discrepancy was most likely due to the very small population size managed here, and to a different balance between the number of homozygous and heterozygous deleterious mutations, that will have a different contribution to overall fitness depending on their effect and dominance. The small population size and the unbalanced sex ratio made natural selection less efficient at eliminating these deleterious variants, so it is likely that when managing such small population sizes with such load, the population enters an extinction vortex. These results emphasize the use of resequencing data not only to estimate coancestries, but also to better understand the distribution of detrimental variation, which is crucial to decide which management strategy to use.
Most breeding programs in zoos are still based on pedigrees (Fienieg and Galbusera 2013). Sequencing costs are decreasing rapidly and therefore NGS provides an increasingly affordable means to measure genetic variation and potentially fitness at the individual and population levels (Ouberg et al. 2010). This is especially the case if a (closely related) reference genome already exists, where it might be worthwhile to sequence all available founders in management strategies of small zoo populations, in order to get insight into the genetic variation and the inbreeding load. Hopefully, it will become possible in the near future to predict the effect of particular (deleterious) mutations more accurately than we can now. This could then be used to get detailed predictions of the consequences for the population when these deleterious mutations occur in the homozygous state. Since human resources are costly as well, ideally a method is developed that automates the use of genome-wide data in an optimal contributions segment-based management scheme. Our paper is a contribution to this process, demonstrating the potential of such methods.
Impact of management on selection goals
Active marker-assisted management may interfere with ongoing selection. Domestic animals provide a case in which selection is strong, and therefore we used the commercial Pietrain breed to study the effect of management on selection signals. Genomic tools are increasingly important in livestock conservation and selection (Lenstra et al. 2012). Pietrain is under strong management regarding pig performance; therefore, clear selection signals are present in the population (Stratz et al. 2014). We have shown that selection signatures are weakened when the focus is solely on optimizing diversity. The strategies used here have consequences not only in management of populations to maintain the most variation, but also in genomic prediction (GP). In GP, the proportion of variance explained by the markers, and how well the distribution of mutational effects is known, is crucial for GP to work well (Goddard 2009); but there is also a need to control inbreeding in genomic selection (Sonesson et al. 2012; Toro et al. 2014). Genomic selection can lead to acceleration erosion of variation at specific loci in the genome (Heidaritabar et al. 2014), and its efficiency may be hampered by maintaining diversity (Clark et al. 2013). Recent simulation results (MacLeod et al. 2014) indicate that resequencing data could recover the missing genetic variance, and a better accuracy in the prediction is achieved with resequencing data for populations with large Ne. We believe that incorporating sequence-based measures of diversity for OC together with the prediction of deleterious variants as proxy for fitness in genomic selection programs provides a way forward to combine the goals of maximising gain without leading the population to extinction.
Concluding remarks
Each management strategy comes with different consequences for a population in terms of maintained diversity and fitness (de Cara et al. 2013b) because these consequences depend on the inbreeding load, population demographic history, contemporary effective population size, and other factors shaping the genetic composition. Our work incorporates the information that can be gained from NGS data into management strategies. Our study shows that variation in managed populations can be selectively maintained by whole-genome, high-density, marker-assisted methods. Specifically, methods based on molecular coancestry seem to be the most efficient for this purpose. However, the effectiveness of marker-assisted methods depends on the demography and effective population size of the target population.
Our analysis shows that if the population has an inbreeding load, as may be the case for Sus cebifrons, then managing the population using molecular coancestry maintains the most diversity. However, such management could lead to the accumulation of deleterious variants and massive loss of fitness (de Cara et al. 2013a). Our results favor the use of molecular or marker-based coancestries in the management of populations because we show that the loss in fitness is marginal compared to other methods when the population is managed to maximize genetic diversity. Therefore, in order to decide which measure of coancestry to apply in a management program, we ideally should have resequenced or genotyped individuals, as well as information on the distribution of genomic variants and their mutational effects. Should the latter be available, as might be feasible in the future, a targeted approach to remove these variants from the population could be implemented in the management program. The initial presence and redistribution of detrimental variants, particularly the accumulation of homozygous deleterious genotypes, could be favorably addressed by managing with marker-assisted coancestries, especially segment-based coancestry. Therefore, if the distribution of deleterious variants is not known, segment-based management strategies may in fact be most efficient in avoiding fitness reduction due to homozygous deleterious variants. This information should be combined with the estimation of the demographic and selective history of the population. When all this information is not available, then our initial preferred choice is using molecular coancestry because it maintains the most diversity while paying special attention to possible losses in viability or fitness-related traits.
Lastly, genomic methods may offset (past) selection events by removing signatures of selection, and thereby possibly diminishing the phenotypic value of the population. This is certainly of concern for domesticated populations, but may in fact also be of concern for wild populations if, for instance, local adaptation or local phenotypic variation is affected. Therefore, we strongly encourage the development of management programs that include both fitness and diversity in their calculations of OC and believe that genomic selection would benefit from this information to choose the contributing individuals, especially in the long term.
Methods
We used resequencing data from seven S. cebifrons individuals, genotypes from 46, and sequence data from 11 individuals of the Pietrain breed of S. scrofa. Sus cebifrons is a critically endangered pig species that is endemic to the Philippine islands and can be found currently on only two islands. Its estimated population size in the wild is low: 200–500 (Negros Island) and 500–1000 (Panay Island). We used pedigree data from two studbook-keeping zoos: Rotterdam Zoo, founded with six individuals from Negros; and San Diego Zoo, founded with seven individuals from Panay.
All individuals were sequenced to ∼10× depth of coverage with the Illumina paired-end sequencing technology (Illumina). The 47 Pietrain individuals were genotyped on the Illumina PorcineSNP60 BeadChip (the 11 resequenced individuals are a subset of this 47).
Pedigree reconstruction
The pedigree for the S. cebifrons San Diego Zoo population was obtained from the studbook keepers, and we used the drawing software Pedigraph (Garbe and Da 2008) to infer and draw the pedigree. The highly complex pedigree for the Pietrain line was also available from the breeding company since its establishment in 1970. Relatedness between individuals was extracted from the studbooks.
Sample collection and DNA extraction: Blood samples were collected from two and five Sus cebifrons from the Rotterdam and San Diego Zoos, respectively, and 11 Sus scrofa belonging to the Pietrain breed. The QIAamp DNA blood spin kit (Qiagen Sciences) was used to extract DNA from the blood samples, and the Qubit 2.0 fluorometer (Invitrogen) was used to check the isolated DNA for quality and quantity. Library construction for the resequencing was performed with 1–3 µg genomic DNA according to the Illumina library prepping protocols (Illumina), and the Illumina 100 paired-end sequencing kit was used for sequencing.
Genotyping on 60K
DNA for a total of 156 animals was diluted to 100 ng/µL and samples were genotyped on the Illumina PorcineSNP60 BeadChip (Ramos et al. 2009) according to the IlluminaHD iSelect protocol. Data was analyzed using Genome Studio software (Illumina).
Alignment and SNP calling
All Illumina 100 bp paired-end read libraries were quality trimmed with sickle -l 50. Trimmed reads were aligned to the S. scrofa reference genome build 10.2 with BWA 0.7.5a (Li and Durbin 2010) with -t 4, and BAM files from multiple libraries were merged and reduplicated with SAMtools 0.1.19 (Li et al. 2009). Local realignment was executed with GATK v2.6 (McKenna et al. 2010) and finally the BAM files were filtered with SAMtools using the SAMtools view options -F 12 and -q 30. Variants were called with SAMtools mpileup for each individual separately with a minimum read-depth of 5, a maximum of twice the average coverage and genotype quality phred score of at least 20.
Genomic variation
Variation between two haplotypes within individual genomes was assessed in bins of 1 Mb according to the method described in Bosse et al. (2012). Briefly, the number of filtered variants per bin was corrected for the proportion of sites with accurate coverage for each bin, and the number of heterozygous sites per bp was calculated. Bins with <20% of accurate coverage were removed from the analysis.
Matrix construction
For the S. cebifrons data, all individuals were genotyped for all sites where at least one individual contained a non-reference allele with the same settings as for the SNP calling, and only the sites where all individuals contained a reliable genotype call with at least a phred score of 20 were retained. All singletons and sites with a clear Hardy-Weinberg deviation were removed with PLINK v1.07 (Purcell et al. 2007). Finally, we extracted the list of putative copy number variable regions from Paudel et al. (2013) and removed variants within these regions, leaving us with a genotype matrix containing roughly 100,000 high quality sites. Genotypes for all 47 Pietrain individuals were filtered for MAF>0.01 and genotype calls of 0.9 or higher with PLINK v1.07 to a total of 51,165 sites.
Phylogeny
A pairwise distance matrix (1-IBS) was constructed using the –cluster option in PLINK v1.07 (Purcell et al. 2007) for both matrices, and a neighbor-joining tree with random input order was created in PHYLIP (Felsenstein 2005). The tree was visualized using FigTree (http://tree.bio.ed.ac.uk/software/figtree/).
Phasing
Genotype data for each chromosome was extracted from the matrices using PLINK v.1.07, and chromosomes were phased independently by SHAPEIT v2.r727 (Delaneau et al. 2012, 2013) with 7 burn-in iterations, 8 iterations of the pruning stage, 20 main iterations, 100 states and a window size of 5Mb. For Sus cebifrons, phasing was performed on the filtered matrix using all 14 available haplotypes to increase accuracy. For the Pietrain breed, phasing was performed on the 60K genotype data.
Deleterious variants
We used the Ensembl Variant Effect Predictor tool v.74 on the filtered VCF files for each individual to assess the nature of the variants (McLaren et al. 2010). For S. cebifrons, sites with a deleterious SIFT (Kumar et al. 2009), prediction score were extracted and included in the matrix. For the Pietrain data, we predicted deleterious sites in the 11 resequenced individuals and extrapolated these by fitting a power curve to the number of unique contributions per extra individual, so that we expected with 48 individuals a total of ∼10,000 deleterious sites (see Supplemental Text and Supplemental Figs. S3, S7–S9 for more details on the deleterious variants).
Ne estimation
We estimated past and recent effective population size in the S. cebifrons data using two methods independently. First, we used the method of MacLeod et al. (2013) to filter the heterozygous sites in our VCF files for false positives. Briefly, this method does not remove actual false positives; but based on the false positive rate, it randomly removes a number of heterozygous sites in a particular window along the genome. The false positive rate was estimated based on the rate of heterozygotes on the non-pseudo-autosomal regions of the X chromosome for males. Then we recoded the distribution of heterozygous sites to PSMC-FASTA files and conducted the demographic analysis with a hidden Markov model approach as implemented in PSMC (Li and Durbin 2011), using Tmax = 20 and n = 64 (4 + 50 × 1 + 4 + 6). The generation time was set at 5, mutation rate 10−8, which is identical to that used for human and cattle resequencing data (MacLeod et al. 2014). False negative rate was estimated from the distribution of depth of coverage per site, ranging from 15% to 45%. Confidence intervals for each sample were estimated based on bootstrapping (Li and Durbin 2011).
To be able to compare the inferred demography from the PSMC method, we used the iterative approach described by MacLeod et al. (2013) to infer past effective population size for the male S. cebifrons from Panay. The false positive rate was estimated as above, and the false negative rate was based on the proportion of sites in the genome, where the average coverage was between 0.5 and 2 times the average coverage. Based on these inferences, the scaled mutation rate was 4.0 × 10⁻⁹. The number of phases was based on the segment sizes that were used to infer demography in the original paper, so that segment size n was 1–1000 bp, and then 1, 2, …, 1000 kb, etc. The threshold delta for goodness of fit was set to 0.001. The upper and lower limits were estimated by changing local Ne until the delta threshold criteria were violated.
Regions of homozygosity
The presence of regions of homozygosity (ROH) at the individual level was tested for the 47 Pietrain individuals that were genotyped on the Illumina PorcineSNP60 BeadChip. SNPs were filtered for MAF 0.05 and a maximum proportion of missing genotypes of 0.1. ROHs were extracted with the –homozyg option in PLINK v.1.07, allowing for one heterozygote within a ROH.
Signatures of selection
We performed an iHS test (Voight et al. 2006) as implemented in the R package rehh (Gautier and Vitalis 2012) in all 46 Pietrain pigs that were genotyped on the Illumina PorcineSNP60 BeadChip. After filtering for missing data and MAF, a total number of 51,165 markers were included. Ancestral states of alleles were determined based on the genotypes from four outgroup Suids from Island South-East Asia (ISEA) obtained from Groenen et al. (2012) and Frantz et al. (2013). The significance of iHS was calculated by the ihh2ihs option.
In silico management
We simulated the management of both populations using optimal contributions (OC) during 10 generations. OC minimizes global coancestry by minimizing the expression , where fij is the coancestry between individuals i and j; ci is the number of offspring that individual i leaves to the next generation; and T is the sum of contributions , which is set at 2 N to maintain population size constant. Every generation, we calculate the cs that minimize that expression, by using a simulated annealing algorithm. We used the following three measures of coancestry:
Molecular coancestry, also called throughout the text marker-by-marker coancestry, which is the probability that two alleles at a locus drawn at random are identical by state, averaged over all markers.
Genealogical coancestry: as derived from the pedigree.
- Segment-based coancestry: as in Eq. (2) of de Cara et al. (2013b), which is a measure of shared segments of identity by descent across individuals:
where lk(ai,bl) is the length of the kth shared IBD segment measured over homolog a of individual i and homologue b of individual l; and L is the length of the genome. We used three thresholds for what we considered a shared segment: 100 kb, 1 Mb, and 5 Mb.
For the in silico management of the S. cebifrons population, we used the five individuals of the San Diego Zoo, which consisted of one male and five females. We first expanded the population to 10 individuals as otherwise the management is heavily constrained by having one male only, keeping the sex ratio of 1 male for every 4 females. We also performed in silico management with even sex ratios, but the consequences remained the same for such small population size (data not shown). For the management of the Pietrain breed, we assumed half of the individuals were female and half male because it is approximately the case in the real population. We performed management in which all individuals were considered perfectly viable, and we also analyzed the cases in which deleterious mutations had been included (see Supplemental Information for details on the distribution of mutational effects). We show results here for mean dominance (h) of 0.35 and 0.5. The values were taken from experiments on Drosophila (Mukai et al. 1972), but with mean selection coefficient 0.005 one order of magnitude smaller because otherwise the population would not be viable here. We analyzed the case of common deleterious mutations and of small effects. Every generation, we calculated the cs that minimized global coancestry and then performed matings at random between contributing individuals. Their offspring was kept if its fitness was larger than a random number drawn from (0,1) and discarded otherwise. The sex ratio was kept constant. We performed 1000 replicates for each management strategy; and every generation, we recorded the genetic diversity (as observed heterozygosity and gene diversity), the mean fitness of the population, and the mean numbers of heterozygous and homozygous deleterious variants. We stored the resulting genotypes of one of the Pietrain replicates to analyze the effect on signatures of selection. The replicate was evaluated based on its summary statistics and fell right within the confidence intervals of the 1000 replicates.
Data access
The data from this study have been submitted to the European Nucleotide Archive (ENA; http://www.ebi.ac.uk/ena/) under accession number PRJEB9326. Source codes together with starting and final data are available in the Supplemental Material and have been deposited in https://github.com/angelesdecara.
Acknowledgments
This work was financially supported by the European Research Council under the European Community's Seventh Framework Programme (FP7/2007–2013)/ERC Grant agreement number 249894. M.A.R.deC. and F.A. were funded by LabEx grant ANR-10-LABX-0003-BCDiv from the French government, managed by Agence Nationale de la Recherche under “Investissements d'avenir” program ANR-11-IDEX-0004-02. Additional funding for M.B. to realize this collaboration was provided by the European Science Foundation exchange grant Advances in Farm Animal Genomic Resources (GENOMIC-RESOURCES) no. 4579 to visit the M.A.R.d.C. and F.A. group. We thank Simon Boitard, Flora Jay, and Iona MacLeod for valuable discussions on the methodology; and Willem Schaftenaar, Aryanna Herscheid, Janno Weerman, and Harald Schmidt for collaboration. DNA samples were provided by Topigs Research Center IPG BV, The Netherlands; Rotterdam Zoo, The Netherlands; San Diego Zoo, USA.
Footnotes
[Supplemental material is available for this article.]
Article published online before print. Article, supplemental material, and publication date are at http://www.genome.org/cgi/doi/10.1101/gr.187039.114.
References
- Ballou JD, Lacy RC. 1995. Identifying genetically important individuals for management of genetic diversity in pedigreed populations. In Population management for survival and recovery. Analytical methods and strategies in small population conservation (ed. Ballou JD, et al. ), pp. 76–111. Columbia University Press, New York. [Google Scholar]
- Bosse M, Megens HJ, Madsen O, Paudel Y, Frantz LA, Schook LB, Crooijmans RP, Groenen MA. 2012. Regions of homozygosity in the porcine genome: consequence of demography and the recombination landscape. PLoS Genet 8: e1003100. [DOI] [PMC free article] [PubMed] [Google Scholar]
- Brotherstone S, Goddard M. 2005. Artificial selection and maintenance of genetic variance in the global dairy cow population. Philos Trans R Soc Lond B Biol Sci 360: 1479–1488. [DOI] [PMC free article] [PubMed] [Google Scholar]
- Charlesworth D, Charlesworth B. 1987. Inbreeding depression and its evolutionary consequences. Annu Rev Ecol Syst 18: 237–268. [Google Scholar]
- Choi Y, Sims GE, Murphy S, Miller JR, Chan AP. 2012. Predicting the functional effect of amino acid substitutions and indels. PLoS One 7: e46688. [DOI] [PMC free article] [PubMed] [Google Scholar]
- Clark SA, Kinghorn BP, Hickey JM, van der Werf JH. 2013. The effect of genomic information on optimal contribution selection in livestock breeding programs. Genet Sel Evol 45: 44. [DOI] [PMC free article] [PubMed] [Google Scholar]
- Curik I, Ferenčaković M, Sölkner J. 2014. Inbreeding and runs of homozygosity: A possible solution to an old problem. Livest Sci 166: 26–34. [Google Scholar]
- de Cara MA, Fernández J, Toro MA, Villanueva B. 2011. Using genome-wide information to minimize the loss of diversity in conservation programmes. J Anim Breed Genet 128: 456–464. [DOI] [PubMed] [Google Scholar]
- de Cara MÁ, Villanueva B, Toro MÁ, Fernández J. 2013a. Purging deleterious mutations in conservation programmes: combining optimal contributions with inbred matings. Heredity (Edinb) 110: 530–537. [DOI] [PMC free article] [PubMed] [Google Scholar]
- de Cara MÁ, Villanueva B, Toro MÁ, Fernández J. 2013b. Using genomic tools to maintain diversity and fitness in conservation programmes. Mol Ecol 22: 6091–6099. [DOI] [PubMed] [Google Scholar]
- Delaneau O, Marchini J, Zagury JF. 2012. A linear complexity phasing method for thousands of genomes. Nat Methods 9: 179–181. [DOI] [PubMed] [Google Scholar]
- Delaneau O, Zagury JF, Marchini J. 2013. Improved whole-chromosome phasing for disease and population genetic studies. Nat Methods 10: 5–6. [DOI] [PubMed] [Google Scholar]
- Felsenstein J. 2005. PHYLIP (Phylogeny Inference Package) version 3.6. Distributed by the author. Department of Genome Sciences, University of Washington, Seattle, Washington. [Google Scholar]
- Fernández J, Villanueva B, Pong-Wong R, Toro MA. 2005. Efficiency of the use of pedigree and molecular marker information in conservation programs. Genetics 170: 1313–1321. [DOI] [PMC free article] [PubMed] [Google Scholar]
- Fienieg ES, Galbusera P. 2013. The use and integration of molecular DNA information in conservation breeding programmes: a review. J Zoo Aqua Res 1: 44–51. [Google Scholar]
- Frankham R, Ballou JD, Briscoe DA. 2002. Introduction to conservation genetics. Cambridge University Press, Cambridge, UK. [Google Scholar]
- Frantz LA, Schraiber JG, Madsen O, Megens HJ, Bosse M, Paudel Y, Semiadi G, Meijaard E, Li N, Crooijmans RP, et al. 2013. Genome sequencing reveals fine scale diversification and reticulation history during speciation in Sus. Genome Biol 14: R107. [DOI] [PMC free article] [PubMed] [Google Scholar]
- Friese C. 2013. Cloning wild life: zoos, captivity and the future of endangered animals. New York University Press, New York. [Google Scholar]
- Friese C, Marris C. 2014. Making de-extinction mundane? PLoS Biol 12: e1001825. [DOI] [PMC free article] [PubMed] [Google Scholar]
- Garbe JR, Da Y. 2008. Pedigraph: a software tool for the graphing and analysis of large complex pedigree. User manual Version 2.4. Department of Animal Science, University of Minnesota: http://animalgene.umn.edu/pedigraph/. [Google Scholar]
- Gautier M, Vitalis R. 2012. rehh: an R package to detect footprints of selection in genome-wide SNP data from haplotype structure. Bioinformatics 28: 1176–1177. [DOI] [PubMed] [Google Scholar]
- Goddard M. 2009. Genomic selection: prediction of accuracy and maximisation of long term response. Genetica 136: 245–257. [DOI] [PubMed] [Google Scholar]
- Gómez-Romano F, Villanueva B, de Cara MA, Fernández J. 2013. Maintaining genetic diversity using molecular coancestry: the effect of marker density and effective population size. Genet Sel Evol 45: 38. [DOI] [PMC free article] [PubMed] [Google Scholar]
- Groenen MA, Archibald AL, Uenishi H, Tuggle CK, Takeuchi Y, Rothschild MF, Rogel-Gaillard C, Park C, Milan D, Megens HJ, et al. 2012. Analyses of pig genomes provide insight into porcine demography and evolution. Nature 491: 393–398. [DOI] [PMC free article] [PubMed] [Google Scholar]
- Groves C. 2008. Current views on the taxonomy and zoogeography of the genus Sus. In Pigs and humans: 10,000 years of interaction (ed. Albarella U, et al. ), pp. 15–29. Oxford University Press, Oxford, UK. [Google Scholar]
- Grundy B, Villanueva B, Wooliams JA. 1998. Dynamic selection procedures for constrained inbreeding and their consequences for pedigree development. Genet Res 72: 159–168. [Google Scholar]
- Heidaritabar M, Vereijken A, Muir WM, Meuwissen T, Cheng H, Megens HJ, Groenen MA, Bastiaansen JW. 2014. Systematic differences in the response of genetic variation to pedigree and genome-based selection methods. Heredity (Edinb) 113: 503–513. [DOI] [PMC free article] [PubMed] [Google Scholar]
- Keller LF, Waller DM. 2002. Inbreeding effects in wild populations. Trends Ecol Evol 17: 230–241. [Google Scholar]
- Kumar P, Henikoff S, Ng PC. 2009. Predicting the effects of coding non-synonymous variants on protein function using the SIFT algorithm. Nat Protoc 4: 1073–1081. [DOI] [PubMed] [Google Scholar]
- Lacy RC. 2013. Achieving true sustainability of zoo populations. Zoo Biol 32: 19–26. [DOI] [PubMed] [Google Scholar]
- Laikre L, Ryman N. 1991. Inbreeding depression in a captive wolf (Canis lupus) population. Conserv Biol 5: 33–40. [Google Scholar]
- Larson G, Dobney K, Albarella U, Fang M, Matisoo-Smith E, Robins J, Lowden S, Finlayson H, Brand T, Willerslev E, et al. 2005. Worldwide phylogeography of wild boar reveals multiple centers of pig domestication. Science 307: 1618–1621. [DOI] [PubMed] [Google Scholar]
- Larson G, Albarella U, Dobney K, Rowley-Conwy P, Schibler J, Tresset A, Vigne JD, Edwards CJ, Schlumbaum A, Dinu A, et al. 2007. Ancient DNA, pig domestication, and the spread of the Neolithic into Europe. Proc Natl Acad Sci 104: 15276–15281. [DOI] [PMC free article] [PubMed] [Google Scholar]
- Lenstra JA, Groeneveld LF, Eding H, Kantanen J, Williams JL, Taberlet P, Nicolazzi EL, Sölkner J, Simianer H, Ciani E, et al. 2012. Molecular tools and analytical approaches for the characterization of farm animal genetic diversity. Anim Genet 43: 483–502. [DOI] [PubMed] [Google Scholar]
- Leroy G. 2011. Genetic diversity, inbreeding and breeding practices in dogs: results from pedigree analyses. Vet J 189: 177–182. [DOI] [PubMed] [Google Scholar]
- Li H, Durbin R. 2010. Fast and accurate long-read alignment with Burrows-Wheeler Transform. Bioinformatics 26: 589–595. [DOI] [PMC free article] [PubMed] [Google Scholar]
- Li H, Durbin R. 2011. Inference of human population history from individual whole-genome sequences. Nature 475: 493–496. [DOI] [PMC free article] [PubMed] [Google Scholar]
- Li H, Handsaker B, Wysoker A, Fennell T, Ruan J, Homer N, Marth G, Abecasis G, Durbin R; 1000 Genome Project Data Processing Subgroup. 2009. The sequence alignment/map format and SAMtools. Bioinformatics 25: 2078–2079. [DOI] [PMC free article] [PubMed] [Google Scholar]
- Lush JL. 1946. Chance as a cause of changes in gene frequency within pure breeds of livestock. Am Nat 80: 318–342. [DOI] [PubMed] [Google Scholar]
- Lynch M, Conery J, Bürger R. 1995. Mutation accumulation and the extinction of small populations. Am Nat 146: 489–518. [Google Scholar]
- MacLeod IM, Larkin DM, Lewin HA, Hayes BJ, Goddard ME. 2013. Inferring demography from runs of homozygosity in whole-genome sequence, with correction for sequence errors. Mol Biol Evol 30: 2209–2223. [DOI] [PMC free article] [PubMed] [Google Scholar]
- MacLeod IM, Hayes BJ, Goddard ME. 2014. The effects of demography and long term selection on the accuracy of genomic prediction with sequence data. Genetics 198: 1671–1684. [DOI] [PMC free article] [PubMed] [Google Scholar]
- McKenna A, Hanna M, Banks E, Sivachenko A, Cibulskis K, Kernytsky A, Garimella K, Altshuler D, Gabriel S, Daly M, et al. 2010. The Genome Analysis Toolkit: a MapReduce framework for analyzing next-generation DNA sequencing data. Genome Res 20: 1297–1303. [DOI] [PMC free article] [PubMed] [Google Scholar]
- McLaren Q, Pritchard B, Rios D, Chen Y, Flicek P, Cunningham F. 2010. Deriving the consequences of genomic variants with the Ensembl API and SNP Effect Predictor. Bioinformatics 26: 2069–2070. [DOI] [PMC free article] [PubMed] [Google Scholar]
- Meuwissen TH. 1997. Maximizing the response of selection with a predefined rate of inbreeding. J Anim Sci 75: 934–940. [DOI] [PubMed] [Google Scholar]
- Mukai T, Chigusa SI, Mettler LE, Crow JF. 1972. Mutation rate and dominance of genes affecting viability in Drosophila melanogaster. Genetics 72: 335–355. [DOI] [PMC free article] [PubMed] [Google Scholar]
- Ng PC, Henikoff S. 2001. Predicting deleterious amino acid substitutions. Genome Res 11: 863–874. [DOI] [PMC free article] [PubMed] [Google Scholar]
- Oliver W. 2008. Sus cebifrons. In IUCN 2013. IUCN red list of threatened species. Version 2013.1. http://www.iucnredlist.org/. [Google Scholar]
- O'Neill DG, Church DB, McGreevy PD, Thomson PC, Brodbelt DC. 2014. Prevalence of disorders recorded in dogs attending primary-care veterinary practices in England. PLoS One 9: e90501. [DOI] [PMC free article] [PubMed] [Google Scholar]
- Ouberg NJ, Pertoldi C, Loeschcke V, Bijlsma RK, Hedrick PW. 2010. Conservation genetics in transition to conservation genomics. Trends Genet 26: 177–187. [DOI] [PubMed] [Google Scholar]
- Paudel Y, Madsen O, Megens HJ, Frantz LA, Bosse M, Bastiaansen JW, Crooijmans RP, Groenen MA. 2013. Evolutionary dynamics of copy number variation in pig genomes in the context of adaptation and domestication. BMC Genomics 14: 449. [DOI] [PMC free article] [PubMed] [Google Scholar]
- Purcell S, Neale B, Todd-Brown K, Thomas L, Ferreira MA, Bender D, Maller J, Sklar P, de Bakker PI, Daly MJ, et al. 2007. PLINK: a tool set for whole-genome association and population-based linkage analyses. Am J Hum Genet 81: 559–575. [DOI] [PMC free article] [PubMed] [Google Scholar]
- Qanbari S, Pausch H, Jansen S, Somel M, Strom TM, Fries R, Nielsen R, Simianer H. 2014. Classic selective sweeps revealed by massive sequencing in cattle. PLoS Genet 10: e1004148. [DOI] [PMC free article] [PubMed] [Google Scholar]
- Ramos AM, Crooijmans RP, Affara NA, Amaral AJ, Archibald AL, Beever JE, Bendixen C, Churcher C, Clark R, Dehais P, et al. 2009. Design of a high density SNP genotyping assay in the pig using SNPs identified and characterized by next generation sequencing technology. PLoS One 4: e6524. [DOI] [PMC free article] [PubMed] [Google Scholar]
- Sonesson AK, Woolliams JA, Meuwissen TH. 2012. Genomic selection requires genomic control of inbreeding. Genet Sel Evol 44: 27. [DOI] [PMC free article] [PubMed] [Google Scholar]
- Stratz P, Wellmann R, Preuss S, Wimmers K, Bennewitz J. 2014. Genome-wide association analysis for growth, muscularity and meat quality in Pietrain pigs. Anim Genet 45: 350–356. [DOI] [PubMed] [Google Scholar]
- Szpiech ZA, Xu J, Pemberton TJ, Peng W, Zollner S, Rosenberg NA, Li JZ. 2013. Long runs of homozygosity are enriched for deleterious variation. Am J Hum Genet 93: 90–102. [DOI] [PMC free article] [PubMed] [Google Scholar]
- Toro MA, Villanueva B, Fernández J. 2014. Genomics applied to management strategies in conservation programmes. Livest Sci 166: 48–53. [Google Scholar]
- Voight BF, Kudaravalli S, Wen X, Pritchard JK. 2006. A map of recent positive selection in the human genome. PLoS Biol 4: e72. [DOI] [PMC free article] [PubMed] [Google Scholar]
- Wang K, Li M, Hakonarson H. 2010. ANNOVAR: functional annotation of genetic variants from high-throughput sequencing data. Nucleic Acids Res 38: e164. [DOI] [PMC free article] [PubMed] [Google Scholar]