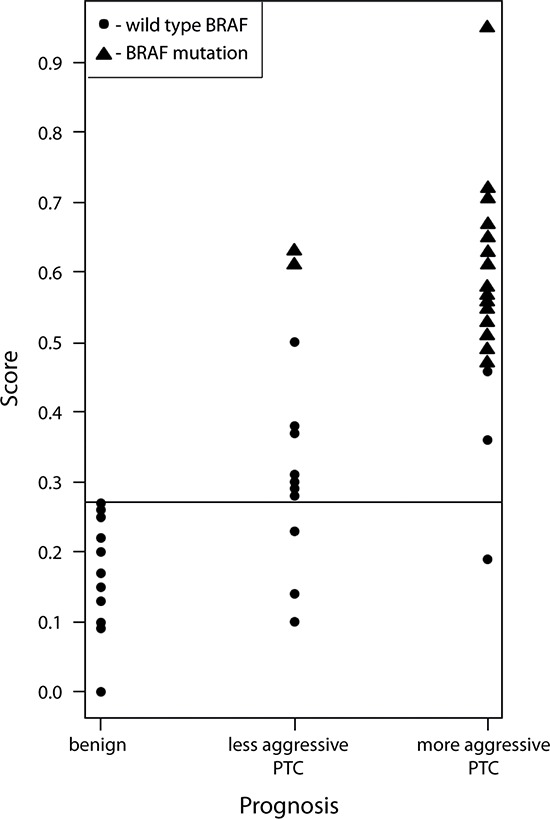
Figure 2. Scatter plot of gene expression-based predictive scores correlated to PTC biological aggressiveness and BRAF mutation status.

The gene expression-based score for benign and PTC samples was calculated based on joint expression levels of BMAL1, CHEK1, c-KIT, c-MET and TIMP1 transcripts. Thus obtained score values were plotted for three clusters: benign, less aggressive PTC and more aggressive PTC, and allowed a clear distinction between these groups. BRAFV600E mutation was strongly associated with samples characterized by the highest predictive score values and with more aggressive PTC diagnosis.
