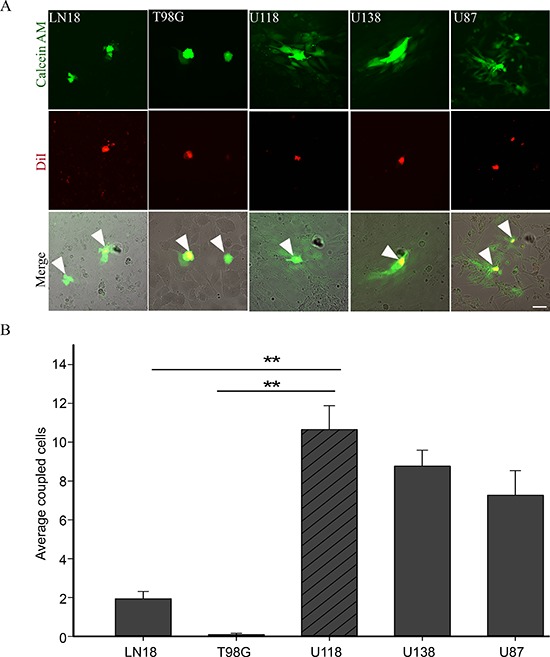
Figure 2. GJIC in human glioma cell lines.

(A) Preloading assay was used to examine GJIC in human glioma cell lines LN18, T98G, U118, U138 and U87. Donor cells (yellow because they have both dyes; see arrows) were labeled with DiI (red) and Calcein AM (green). Passage of Calcein to recipient cells through gap junctions labelled them green. (B) U118 cell line showed the highest level of GJIC as demonstrated by the passage of Calcein (green); scale bar = 50 μm. This experiment was repeated 3 times; **p < 0.001 determined by One Way Anova method followed by Dunn's method for multiple comparisons.
