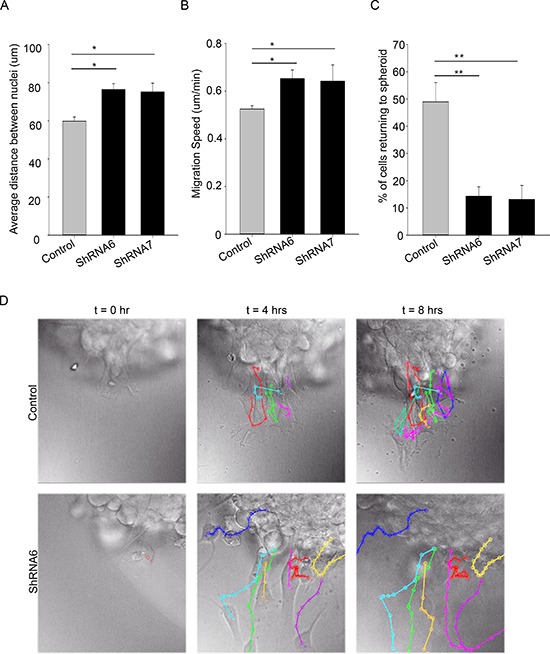
Figure 7. Reducing Cx43 expression changes cell migration pattern in U118 cells.

(A) Individual cells migrating away from the spheroid were tracked. Single cell tracking was done using ImageJ MtrackJ plugin; the nuclei of the cells were tracked. The distance between the nuclei of migrating cells was measured over an 8 hour time period. On average control cells migrated with shorter distance between them than ShRNA6 and ShRNA7 cells. (B) The speed of cells was calculated by measuring the total distance travelled by cells divided by the total time. ShRNA6 and ShRNA7 cells migrated faster than the control cells. (C) Reducing Cx43 influenced the direction of migration with a higher percentage of control cells returning to the spheroid (control = 49%, ShRNA6 = 14%, and ShRNA7 = 13%). (D) Cell tracks for control, ShRNA6 and ShRNA7 cells over 8 hours show difference in migration pattern. Control cells are migrating in a collective manner whereas the ShRNA and ShRNA7 cells are migrating in a more detached manner. The data shown here is from 3 experiments with Control n = 153 cells, ShRNA6 n = 174 cells, and ShRNA7 n = 195 cells; One way Anova (Sigma plot) followed by Holm-Sidak method to do pairwise multiple comparisons was used to calculate significance for distance between cells as they migrate, and the directionality; *p < 0.05, **p < 0.005 was considered significance. The student t-test was used to calculate the significance for cell speed; *p < 0.05 was considered significance. Scale bar = 50 μm.
