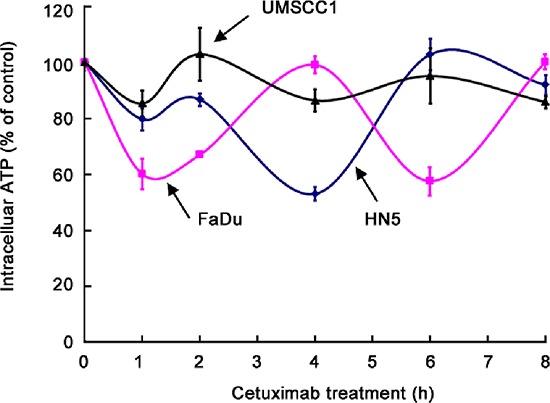
Figure 2. Oscillation in intracellular ATP levels after cetuximab treatment in different HNSCC cell lines.

HN5, FaDu, and UMSCC1 cells were cultured in medium containing 0.5% FBS and low glucose (1 g/L) with 20 nM cetuximab in triplicate wells for 1, 2, 4, 6, and 8 h. The levels of intracellular ATP were determined using the ATP Bioluminescent Assay Kit (Sigma-Aldrich). The ATP levels at each time point were normalized to the ATP levels of the untreated cells at the corresponding time points.
