

Abstract
We evaluated the replication efficiency of the HIV reverse transcriptase (RT) mutants K103N, G190A, and G190S, which confer resistance to the non-nucleoside RT inhibitor efavirenz, using growth competition assays in cell culture. In the absence of efavirenz, the fitness hierarchy was G190S < G190A < K103N < wild-type. The fitness reduction of G190S relative to K103N was less evident at high efavirenz concentrations, although K103N still replicated more efficiently. Efficiency of RNase H cleavage and RNA-dependent DNA synthesis from tRNALys,3 correlated with relative fitness, in biochemical studies of mutant RTs. Presteady state and steady state polymerization assays using DNA primers detected no abnormalities. This work is consistent with previous studies demonstrating that initiation of viral DNA synthesis is reduced in mutants with slowed RNase H cleavage, and suggests that both abnormalities contribute to the replication defect of these mutants. It also suggests that high concentrations of efavirenz are unlikely to favor the selection of G190S clinically.
Keywords: HIV-1 drug resistance, Replication fitness, RNase H cleavage, tRNALys, 3 priming, Efavirenz, G190S
The reverse transcriptase (RT) of human immunodeficiency virus type-1 (HIV-1) is critical to the HIV life cycle, and is an important target for HIV-1 treatment. RT is a heterodimer comprised of a 66-kDa subunit (p66) and a 51-kDa (p51) subunit (Goff, 1990). p66 contains the polymerase and RNase H active sites. Although p51 is derived from p66 by proteolytic cleavage, and contains the first 440 amino acid residues of p66, it assumes a very different structure and does not have a catalytic active site (Kohlstaedt et al., 1992). HIV-1 RT exhibits RNA-dependent DNA polymerization activity, DNA-dependent DNA polymerization activity, and RNase H activity.
Cleavage of RNA–DNA hybrids by RNase H is essential for HIV replication (Julias et al., 2001; Tisdale et al., 1991). Two modes of RNase H cleavage have been described. “Polymerase-dependent” cleavage is directed by the 3′ end of the elongating DNA and is thought to occur in concert with DNA polymerization to degrade the genomic RNA during minus-strand DNA synthesis (Furfine and Reardon, 1991; Gopalakrishnan et al., 1992); we have referred to this mode of cleavage as “DNA 3′-end-directed RNase H cleavage.” Polymerase-independent RNase H cleavage is directed by the 5′ end of the RNA in the RNA–DNA hybrid, and occurs independently of DNA polymerization (DeStefano et al., 1993; Palaniappan et al., 1996, 1997); we have referred to this mode as “RNA 5′-end-directed RNase H cleavage.” The polymerase-independent mode of cleavage is believed to further degrade small genomic RNA fragments that remain annealed to the newly synthesized minus-strand DNA. The position of the genomic RNA primary cleavage occurs 15 to 18 nt from either the recessed 3′ DNA or 5′ RNA end, depending on the mode of cleavage. A second cleavage occurs approximately 5–7 nt from the end of the strand directing cleavage during both modes of RNase H cleavage. The second cleavage occurs at a slower rate than the first (Wisniewski et al., 2000).
The non-nucleoside reverse transcriptase inhibitors (NNRTIs) are a group of compounds that are potent and specific inhibitors of the replication of HIV-1 (reviewed in Domaoal and Demeter, 2004). NNRTIs play important roles in the therapy of naive and treatment-experienced patients. NNRTIs selectively bind to RT at a hydrophobic binding pocket in the palm subdomain of the p66 subunit of RT, which is adjacent to the polymerase active site (Cohen et al., 1991; Kohlstaedt et al., 1992). Binding of NNRTIs causes an allosteric change in the RT that leads to non-productive binding of the incoming nucleotide during DNA polymerization (Spence et al., 1995). HIV-1 resistance to NNRTIs is caused by mutations in the NNRTI binding pocket, which interfere with drug binding (reviewed in Domaoal and Demeter, 2004). The NNRTI binding pocket includes residues from amino acids 100 to 108, 180 to 190, and 220 to 240 in RT.
Efavirenz is the most commonly used NNRTI, because of its high tolerability and demonstrated potency. The combination of efavirenz and nucleoside analogs has shown potent antiviral activity and significant clinical efficacy (Albrecht et al., 2001; Gulick et al., 2004; Robbins et al., 2003; Starr et al., 1999; Staszewski et al., 1999). K103N is the most frequently observed NNRTI-resistance mutation from patients failing efavirenz (Bacheler et al., 2000). G190S is only observed in HIV isolates from approximately 10% of patients failing efavirenz combination treatment, even though G190S confers a 2–3-fold higher level of efavirenz resistance than K103N (Bacheler et al., 2001). G190A occasionally develops during failure of an efavirenz-containing regimen, even though this mutant confers relatively low levels of efavirenz resistance (Bacheler et al., 2000, 2001; Huang et al., 2003).
Similar observations have been made with mutants developing during failure of the NNRTIs nevirapine and delavirdine. V106A confers higher levels of nevirapine resistance than either K103N or Y181C, yet the 106 mutant is uncommonly seen during monotherapy with nevirapine (Richman et al., 1994). The P236L mutant is rarely seen during failure of delavirdine compared to K103N, even though it confers 2–3-fold higher levels of delavirdine resistance (Demeter et al., 2000; Dueweke et al., 1993). We have demonstrated that the P236L and V106A mutants have reduced replication fitness in cell culture, as measured in parallel infections and growth competition assays (Archer et al., 2000; Gerondelis et al., 1999). These mutants have a selective defect in RNase H activity without affecting polymerization. Based on these results, we have proposed that NNRTI-resistant mutants that have reduced replication fitness will be uncommonly selected for during treatment failure, despite conferring high levels of drug resistance, and that abnormalities in RNase H cleavage contribute to the reduced replication fitness and relatively low prevalence of these NNRTI-resistant mutants.
In order to extend these studies to efavirenz-resistant mutants, we measured the effects of G190A and G190S on HIV replication fitness and RT biochemical function. We evaluated the relationship of the replication fitness in cell culture in the presence or absence of efavirenz with the prevalence of those mutations in efavirenz treatment failure, and studied the effects of these mutants on the biochemical function of RT. We determined that the mutations at G190 decrease RNase H cleavage activity with no detectable effects on polymerization from DNA primers, but that they also decrease RNA-dependent DNA synthesis from the tRNALys,3 primer. Thus, the differences in relative fitness of these two mutants correlated with the degree of reduction in both RNase H cleavage rates and initiation of minus-strand synthesis.
Results
Replication capacity of the NNRTI-resistant mutants G190S and G190A in the absence and presence of efavirenz
Our hypothesis is that the predominant drug-resistant mutant selected during efavirenz therapy would be the one that replicates most efficiently under these conditions. The likelihood of selecting a specific drug-resistant mutant would reflect a combination of the mutant’s replication capacity in the absence of drug (which would influence its prevalence before therapy is initiated) and its ability to replicate in the presence of drug, relative to other efavirenz-resistant variants. To test this hypothesis, we generated separate virus stocks of wild-type, K103N, G190A, and G190S NL4-3, by transfecting pNL4-3 plasmid DNA containing the appropriate mutation into 293 cells. The relative replication capacity of each mutant was measured using growth competition assays in PM1 cells. PM1 cells were co-infected with wild-type and G190S or G190A at different ratios (based on the p24 concentration of each virus stock). As can be seen in Fig. 1A, the proportion of G190S relative to wild-type virus decreased from >90% at day 3 to ~10% at day 6. The proportions of G190A relative to wild-type virus also decreased, but at a slower rate than G190S, from >90% at day 3, to ~40% at day 6 (Fig. 1B). In order to confirm that G190S replicated less efficiently than G190A in the absence of efavirenz, we co-infected PM1 cells with G190S and G190A in a ratio (based on p24 antigen content of the virus stocks) favoring G190S (Fig. 1C). The proportion of G190S relative to G190A decreased from ~85% at day 3 to ~40% at day 6. Similar results were obtained when the relative amounts of viral variants were chosen so that their relative prevalence at day 3 was ~50% (data not shown). We calculated the relative fitness coefficient s, using the method of Maree and coworkers (Maree et al., 2000), as shown in Table 1. The statistical comparisons of these s values also support the hierarchy of relative replication efficiency in the absence of efavirenz as wild-type > G190A > G190S. We also observed similar results using growth competitions in H9 cells (data not shown).
Fig. 1.
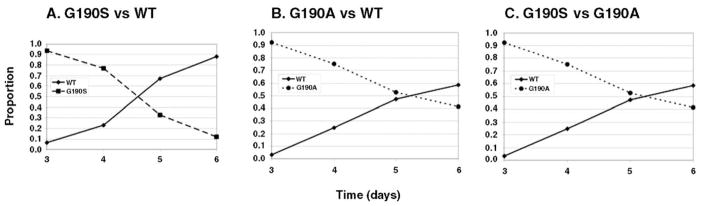
Growth competition assay of G190S and G190A in the absence of efavirenz. Virus stocks were mixed at varying ratios based on p24 antigen content and were used to co-infect PM1 cells. The proportions of the two variants were determined by quantifying the relative peak heights on sequencing chromatograms. Shown is a representative culture for each competition with the proportion of each virus on the y-axis vs. days postinfection on the x-axis. Each competition was set up in duplicate and 3 independent infections were performed.
Table 1.
s values from growth competition experiments competing G190S or G190A vs. wild-type
| s value a,b ± SD | |
|---|---|
| G190A vs. WT | −0.33 ± 0.050 |
| G190S vs. WT | −0.59 ± 0.063* |
| G190S vs. G190A | −0.36 ± 0.154 |
SD, standard deviation.
Data represent an average of 6 independent experiments.
Timepoints in which the proportion of either variant was 0% were not used in the calculation.
P < 0.001, compared to s value for G190A relative to WT.
We also evaluated the relative replication efficiency or fitness of the G190S and G190A mutants in the presence of efavirenz, relative to the more commonly occurring efavirenz-resistant mutant, K103N. We co-infected PM1 cells with K103N and either G190S or G190A in the presence of different concentrations of efavirenz, ranging from 10 to 500 nM. Results for concentrations greater than 100 nM are not presented here, because we found no evidence for viral growth by measuring p24 production in the culture supernatant, and had difficulty consistently amplifying PCR products from cells in those cultures (data not shown). Fig. 2 shows the proportion of G190A (Panel A) and G190S (Panel B) in the culture over time and at different concentrations of efavirenz. G190S and G190A both replicated less efficiently than K103N in the absence of efavirenz. As can be seen in Fig. 2B, the slope of decline of G190S relative to K103N becomes less negative as the concentration of efavirenz in the culture increases. The improved replication efficiency of G190S relative to K103N in the presence of increasing efavirenz concentrations is statistically significant, when comparing s values (Table 2), which are corrected for the degree of p24 expansion of the better replicating variant, K103N. In contrast, the slopes of the relative prevalence of the less resistant G190A mutant over time become more negative with increasing efavirenz concentration (Fig. 2A), and the s values become more negative (Table 2). This finding indicates that the G190A mutant becomes progressively less fit relative to K103N at higher efavirenz concentrations. It is interesting to note that, although the relative fitness of G190S improved relative to K103N at higher efavirenz concentrations, there was no concentration at which G190S became more fit than K103N (Fig. 2B). The relative fitness of G190S vs. K103N in the absence of efavirenz was also evaluated using clonal analysis, which showed excellent correlation with direct sequence analysis at these two codons (data not shown).
Fig. 2.

Growth competition assay for G190S and G190A relative to K103N, at different concentrations of efavirenz. Virus stocks were mixed at appropriate ratios and were used to co-infect PM1 cells. The proportions of the two viruses at each time point were determined by quantifying the relative peak heights on sequencing chromatograms. The concentration of efavirenz ranged from 0–500 nM (final concentration in medium with 10% serum). Cultures containing more than 100 nM efavirenz showed no growth by p24 antigen, and were not assayed further. A, NL4-3 G190A competing with K103N at different concentrations of efavirenz. B, NL4-3 G190S competing with K103N at different concentration of efavirenz.
Table 2.
s values from growth competition experiments competing G190S or G190A with K103N in the presence of EFV
| EFV concentration (nM) | s value ± SD | |
|---|---|---|
| G190A vs. K103N | 0 | −0.35 ± 0.149 |
| 10 | −0.59 ± 0.141a | |
| 50 | ND | |
| 100 | −0.60 ± 0.052a | |
| G190S vs. K103N | 0 | −0.61 ± 0.066 |
| 10 | −0.49 ± 0.179 | |
| 50 | −0.31 ± 0.100b | |
| 100 | −0.31 ± 0.136b |
K103N is the reference strain for calculating all s values.
Data represent an average of 3 independent experiments.
SD, standard deviation.
ND, not determined.
P < 0.01, compared to s value for G190A relative to K103N in the absence of EFV, t test.
P < 0.01, compared to s value for G190S relative to K103N in the absence of EFV, t test.
Effects of NNRTI resistance mutations on the processivity of DNA polymerization by HIV-1 RT
Processivity of DNA polymerization is defined as the number of nucleotides incorporated by HIV-1 RT in a single binding event. The number of nucleotides incorporated in a single binding event depends on the nucleotide addition rate and the dissociation rate of RT during synthesis. The processivity of HIV-1 RT should therefore be sensitive to changes in a number of different steps in polymerization, including primer-template and nucleotide binding, primer elongation, and product dissociation.
To measure the mutant RTs’ RNA-dependent processivity, equal amounts of wild-type, K103N, G190S, or G190A (as measured by relative activities of polymerization on a poly [rA]-oligo [dT] homopolymeric primer-template) were prebound to a 520-nt-long heteropolymeric, viral RNA–DNA template-primer. The processivity of each RT was measured over time after initiation of polymerization with Mg2+, dNTPs, and in the presence of heparin. Heparin, a trapping polymer, was used to bind and sequester RT that dissociated from the primer-template. A trap control, in which heparin was added during prebinding of RT to the primer-template, demonstrated that the amount of heparin used was sufficient to sequester all RTs after dissociation (Fig. 3, lane 1), preventing any polymerization from occurring after the prebound RTs dissociated. Finally, a no-trap control was used to verify that equal activities of each mutant RT were used (Fig. 3, lane 8). No significant differences in the kinetics of accumulation or size distribution of extension products were seen when comparing wild-type, K103N, G190S, and G190A RTs on this template-primer. This result shows that these three efavirenz resistance mutations do not alter processivity of primer elongation of RTs.
Fig. 3.

Processivities of wild-type, K103N, G190A, and G190S RTs. The substrate used for the processivity assays was made by annealing a 5′-end-labeled DNA oligonucleotide to a 520 nt-long RNA. Lane 1, a trap control in which heparin was added before the addition of RT. Lanes 2–7, reactions in which RT was prebound, followed by the addition of heparin trap. Reaction times: Lane 2, 0 s; Lane 3, 15 s; Lane 4, 30 s; Lane 5, 1 min; Lane 6, 2.5 min; Lane 7, 15 min; Lane 8, polymerization was allowed to proceed for 15 min in the absence of a heparin trap. Nucleotide size markers are indicated on the left.
Effects of G190S and G190A on kinetic constants of polymerization
Although the results of the processivity assays suggested that the overall cycle of polymerization by these NNRTI-resistant mutant RTs was unaltered, we wished to further explore any potential effect of these mutants on polymerization, given their relatively close proximity to the polymerase active site. We used presteady state and steady state single-nucleotide incorporation assays to determine the maximal catalytic rate of nucleotide incorporation (kpol), the binding affinity for nucleotide (Kd), and the overall turnover rate for polymerization (kcat). Assays were carried out on both RNA–DNA and DNA–DNA template-primer substrates, using dGTP.
Careful studies of the polymerization cycle of HIV-1 RT under presteady state conditions have demonstrated that nucleotide binding and incorporation occur significantly faster, on a millisecond time scale, than dissociation of RT from the extended nucleic acid product, which normally takes several seconds (Johnson, 1995; Kati et al., 1992). Assays of polymerization can be performed under conditions in which only the first nucleotide can be incorporated and RT is prebound to an excess of template-primer; time points taken on a millisecond to second time scale will reveal a biphasic curve of product formation. The rate of the initial “burst” of product formation represents the rate of the conformational change of RT after nucleotide binding, which is the rate-limiting step of nucleotide incorporation. The slower rate of product formation is due to polymerization by RTs that have dissociated from the extended product and catalyzed new rounds of polymerization after binding new primer-templates. Measurement of the burst rate over a range of nucleotide concentrations will show a decline in burst rate as the nucleotide concentration becomes limiting. kpol is the burst rate at infinite nucleotide concentration, and represents the rate of the conformational change during nucleotide incorporation. The binding affinity, or Kd, of the RT for a nucleotide is the concentration of the nucleotide at which the burst rate is half of its maximum.
We measured single nucleotide incorporation of dGTP on a heteropolymeric template, by the wild-type and efavirenz-resistant RTs, using a rapid quench flow apparatus (KinTek Instruments, State College, PA). We found no differences in the Kd for dGTP or kpol for K103N, and G190A RT compared to wild-type RT. Although there was a trend for G190S to have a somewhat faster kpol than wild-type RT on an RNA–DNA template-primer, overall we found no significant alterations in the presteady state kinetic parameters for the G190S or G190A mutants relative to wild-type RT that would explain their fitness differences (Table 3).
Table 3.
Presteady state kinetics of single nucleotide incorporation
| RTs | Template-primer
|
|||
|---|---|---|---|---|
| RNA–DNA
|
DNA–DNA
|
|||
| kpol (s−1) | Kd (μM) | kpol (s−1) | Kd (μM) | |
| WT | 38.7 ± 3.53a | 5.1 ± 1.97 | 26.1 ± 2.20 | 1.6 ± 0.71 |
| K103N | 40.2 ± 2.21 | 4.8 ± 1.07 | 21.3 ± 1.71 | 2.6 ± 0.39 |
| G190A | 38.1 ± 4.76 | 4.4 ± 1.83 | 27.9 ± 1.57 | 2.0 ± 0.53 |
| G190S | 52.0 ± 2.43 | 7.5 ± 1.28 | 37.6 ± 2.88 | 2.9 ± 0.94 |
Values are listed ± standard errors from the curve fit to the hyperbolic equation (see Materials and methods).
Under steady state conditions, the concentration of the enzyme–substrate complex has reached an equilibrium and the rate of product formation is constant. For conditions under which only the first nucleotide is added to the primer, the rate-limiting step of polymerization is product dissociation (Kati et al., 1992). We measured Vmax, which is the maximum velocity of polymerization at steady state, and kcat, which is the turnover rate of the reaction (calculated by dividing Vmax by the active enzyme concentration), for single nucleotide incorporation of dGTP, using the same template-primers that were used for the presteady state studies. We found no significant differences in kcat among the different RT mutants compared to wild-type RT (Table 4).
Table 4.
Steady state kinetics of single nucleotide incorporation
| RTs | Template-primer
|
|
|---|---|---|
| RNA–DNA kcat (s−1) | DNA–DNA kcat (s−1) | |
| WT | 0.060 ± 0.0192 | 0.019 ± 0.0300 |
| K103N | 0.049 ± 0.0223 | 0.042 ± 0.0065 |
| G190A | 0.035 ± 0.0038 | 0.046 ± 0.0208 |
| G190S | 0.021 ± 0.0148 | 0.023 ± 0.0111 |
P = 0.066 for K103N kcat vs. wt, DNA/DNA template, t test.
P > 0.10 for all other mutants and templates, compared to wild-type, t test.
Effects of G190S and G190A on RNase H cleavage by HIV-1 RT
Our previous studies have shown that K103N, which has a fitness similar to wild-type (s value ~ −0.05) has little effect on polymerization, but selectively slows DNA 3′-end-directed RNase H cleavage (Gerondelis et al., 1999; Koval et al., submitted for publication). We have also shown that P236L and V106A RTs are slowed in both DNA 3′-end-directed and RNA 5′-end-directed RNase H cleavages. This reduction is associated with a significant reduction in the replication fitness of these mutants (Archer et al., 2000; Gerondelis et al., 1999). We have proposed that the concomitant reduction in rates of both modes of RNase H cleavage leads to accumulation of long fragments of viral genomic RNA that remain annealed to minus-strand DNA, slowing synthesis of plus-strand DNA during reverse transcription. Slowing of both modes of RNase H cleavage may also adversely affect strong stop transfer, as well as primer formation and utilization during reverse transcription.
Since we have shown that G190S and G190A both have reduced replication efficiency relative to wild-type and K103N, with little effect on polymerization, we also wanted to test whether these mutants significantly altered the kinetics of RNase H cleavage. G190A and G190S mutant RTs were assayed first for DNA 3′ end-directed RNase H activity, relative to wild-type and K103N RTs (Fig. 4A). The substrate used was a 5′-end-labeled 41 NT long RNA annealed to a shorter DNA, such that the DNA 3′-end was recessed relative to the RNA 5′ end. Input amounts of each RT were normalized, based on the relative activity of DNA polymerization using a homopolymeric RNA template. The RTs were prebound to the substrate before adding Mg2+ to initiate the reaction. RNase H cleavage was assayed in the absence of polymerization and dNTPs. All three mutant RTs demonstrated slower rates of the DNA 3′-end-directed RNase H cleavage activity relative to wild-type, with K103N having the smallest difference (Figs. 4A–C). These differences were evident when either the degradation of substrate (Fig. 4B) or formation of primary (data not shown) and secondary cleavage products (Fig. 4C) was assayed. The time required for K103N to degrade half of the substrate was approximately 1.5- to 2-fold slower than for the wild-type enzyme; for G190A and G190S, the differences were approximately 4-fold and 8-fold, respectively.
Fig. 4.

DNA 3′-end-directed RNase H activity of wild-type, K103N, G190A, and G190S RTs. The substrate used was made by annealing a 26 NT long DNA oligonucleotide primer to a 5′-end-labeled 41 NT long RNA such that the 3′ end of the DNA primer was recessed relative to the RNA 5′ end. Panel A shows a polyacrylamide gel of a representative experiment in which DNA 3′ end-directed cleavage was measured for each RT. Reactions were allowed to proceed for the following amounts of time: Lane 1, 0 s; Lane 2, 15 s; Lane 3, 30 s; Lane 4, 1 min; Lane 5, 2 min; Lane 6, 4 min; Lane 7, 8 min; Lane 8, 16 min. Nucleotide size markers are indicated on the left. Panel B shows the rate of substrate degradation by wild-type, K103N, G190A, and G190S RTs. The fraction of substrate remaining at each time point was quantitated using PhosphorImaging and was plotted on the y-axis vs. time on the x-axis. Panel C shows the rate of formation of secondary cleavage products by wild-type, K103N, G190A, and G190S RTs. Secondary cleavage products were quantitated by PhosphorImaging and plotted on the y-axis vs. time on the x-axis. Three independent experiments were performed in triplicate. Results represent the average and standard deviation of 9 reactions.
We also assayed RNA 5′-end-directed RNase H cleavage using a 77 NT long DNA hybridized to the same 5′-end-labeled 41 NT long RNA used in the previous RNase H assays (Fig. 5). The G190S and G190A mutants were significantly slower in degrading substrate and producing both primary and secondary products (Figs. 5A–C, data not shown). The time taken to degrade 50% of the RNA substrate for G190S is more than 10-fold longer than for wild-type. G190A RT is about 4-fold slower than wild-type (Fig. 5B), and both G190A and G190S were slower than K103N.
Fig. 5.

RNA 5′-end-directed RNase H activity of WT, K103N, G190A, and G190S RTs. A 77nt-long DNA oligonucleotide primer was annealed to a 5′-end-labeled 41 nt-long RNA such that the 5′ end of the RNA primer was recessed relative to the DNA 3′ end. Panel A shows a representative example of DNA 3′ end-directed cleavage for each RT. Reactions were allowed to proceed for the following amounts of time: Lane 1, 0 s; Lane 2, 15 s; Lane 3, 30 s; Lane 4, 1 min; Lane 5, 2 min; Lane 6, 4 min; Lane 7, 8 min; Lane 8, 16 min. Nucleotide size markers are indicated on the left. Panel B shows quantitation of substrate degradation by wild-type, K103N, G190A, and G190S RTs. The fraction of substrate remaining at each time point was quantitated using PhosphorImaging analysis and was plotted on the y-axis vs. time on the x-axis. Panel C shows the formation of secondary cleavage product by wild-type, K103N, G190A, and G190S RTs. Secondary products were quantitated by PhosphorImaging and was plotted on the y-axis vs. time on the x-axis. Three independent experiments were each performed in triplicate. Results represent the average and standard deviation of 9 reactions.
Effects of G190S and G190A on RNA-dependent DNA synthesis from the tRNALys,3 primer
Previously published studies have suggested that mutants of HIV-1 reverse transcriptase defective in RNase H cleavage also affect initiation of DNA synthesis (Julias et al., 2002). Additional studies have also demonstrated that efficient initiation and elongation of minus-strand DNA from the tRNALys,3 primer are dependent on posttranscriptional modifications of the primer (Arts et al., 1994; Isel et al., 1996). We therefore studied initiation of DNA synthesis using an RNA template that includes the primer binding site (PBS) and 5′ end of the HIV-1 genome and primed synthesis with natural tRNALys,3. The amount of each mutant enzyme added was normalized, based on specific activity of polymerization. Under these conditions, product accumulation was slowest for G190S RT, followed by G190A, with K103N showing minimal differences from wild-type RT (Fig. 6A). Interestingly, the mutant and wild-type RTs were indistinguishable from each other when assaying synthesis from a PBS DNA primer using the same template and conditions (Fig. 6B). Thus, the slowing of synthesis from tRNALys,3 seen with G190S and G190A is specific to this primer, and also correlates with these mutants’ relative reductions in replication efficiency.
Fig. 6.

Extension of tRNALys,3 and PBS DNA primers by wild-type, K103N, G190A, and G190S RTs. Each graph shows the accumulation of total product formation over time, relative to baseline. (A) Extension from tRNALys,3. (B) Extension from a DNA PBS primer.
Discussion
We have demonstrated that the G190S mutant significantly reduces the replication efficiency, or fitness, of HIV-1 relative to wild-type and K103N, when assayed using growth competition assays in cell culture. Although we did not directly compare G190S replication efficiency to NNRTI-resistant variants at other RT codons, the magnitude of reduction in fitness appears similar to V106A and P236L. We have proposed that NNRTI-resistant mutants such as G190S, V106A, and P236L are uncommonly seen in clinical isolates relative to mutants conferring similar or lower levels of resistance, such as K103N, because of this reduced replication efficiency.
Drug resistance of an HIV-1 variant is usually expressed as the concentration of drug required to inhibit virus replication by a certain proportion, relative to replication of that variant in the absence of drug. However, since many drug-resistant mutants likely preexist before initiation of therapy, the relevant issue is how well a variant replicates in the presence of drug, relative to other drug-resistant variants. Thus, it makes sense that even a highly resistant mutant might not be selected for if its baseline level of replication is significantly impaired relative to other mutants with similar levels of drug resistance.
Our studies of the replication of G190S relative to K103N in the presence of efavirenz support the argument that a more resistant, but poorly replicating variant can be outcompeted by a more fit, less resistant variant. We found that the relative fitness of G190S did improve relative to K103N in increasing concentrations of efavirenz tested, consistent with published studies demonstrating an approximately 3-fold higher IC90 of G190S compared to K103N (Bacheler et al., 2001). However, at all the concentrations of efavirenz tested in which virus replication was not completely inhibited, K103N still out-competed G190S. Thus, for these two mutants, the higher level of efavirenz resistance conferred by G190S does not compensate for its adverse effects on replication, relative to K103N. More study is needed to determine whether larger differences in drug resistance between two variants would allow the less-fit, more resistant mutant to outcompete a more-fit but less resistant variant at high drug concentrations.
We also studied the relative replication efficiency of another NNRTI-resistant mutant at the same codon, G190A. We found that this mutation, which confers lower levels of efavirenz resistance than G190S, has reduced replication fitness in the absence of drug relative to K103N and wild-type, but this replication abnormality is less pronounced than G190S. Similar results were observed by others using a single cycle assay (Huang et al., 2003). It is likely that the low levels of drug resistance, coupled with its reduced level of replication fitness, accounts for the infrequent occurrence of G190A in patients failing efavirenz.
We then studied the biochemical abnormalities associated with these reductions in replication fitness. We found no evidence of a significant abnormality in polymerization from DNA primers that could explain the different levels of replication fitness of the K103N, G190A, and G190S mutants, based on our studies of processivity, as well as steady state and presteady state kinetics of single nucleotide incorporation. These assays evaluated the affinity of RT for nucleotide, as well as the rates of nucleotide incorporation and overall polymerization, and should be sensitive to significant perturbations in the ability of HIV-1 RT to catalyze nucleotide incorporation.
We did observe reductions in the rates of RNase H cleavage by these mutants, consistent with their relative reductions in replication efficiency. We found that the most fit NNRTI-resistant mutant we studied, K103N, selectively reduced DNA 3′-end-directed RNase H cleavage. We postulate that reductions in only this mode of cleavage would lead to larger RNA fragments remaining after polymerization of the viral minus-strand DNA has been completed. However, a preserved rate of RNA 5′-end-directed RNase H cleavage could compensate for this by allowing cleavage of these remaining fragments, facilitating plus strand DNA synthesis. Both G190S and G190A were slowed in both modes of cleavage. We postulate that the slowing of both modes of RNase H cleavage will lead to retention of longer RNA fragments on the newly synthesized minus-strand DNA. Since HIV-1 RT does not perform strand displacement synthesis efficiently (Fuentes et al., 1996a, 1996b), persistent annealing of these RNA fragments would be expected to slow the rate of plus-strand DNA synthesis. One would also expect slowing of RNase H cleavage to slow strong stop DNA transfer and the formation of the polypurine tract primer. Interestingly, we found that the degree of slowing of RNase H cleavage by the G190S and G190A mutants correlated with their relative replication fitness in cell culture, further supporting our hypothesis that these reductions in RNase H cleavage contribute to reductions in replication fitness.
The mechanism of how NNRTI resistance mutations affect RNase H cleavage is not fully understood, since NNRTI resistance mutations occur in the NNRTI binding pocket, which is distant from the RNase H active site. Prior studies have demonstrated that mutants in the polymerase domain of HIV-1 RT can selectively affect RNase H cleavage (Gao et al., 1998; Palaniappan et al., 1997; Powell et al., 1999). Some of these mutants are in the primer grip region of RT, which overlaps with the NNRTI binding pocket (Palaniappan et al., 1997). It has been postulated that optimal positioning of the RNase H active site relative to the RNA:DNA substrate is essential for efficient RNase H cleavage, and that mutations in the polymerase domain of RT can affect RNase H cleavage by altering the positioning of the RNase H active site (Gao et al., 1998).
In addition, studies have demonstrated that binding of NNRTIs to HIV-1 RT can enhance RNase H cleavage (Palaniappan et al., 1995; Shaw-Reid et al., 2005), also supporting the hypothesis that the NNRTI binding pocket can influence RNase H activity. Comparisons of different RT crystal structures suggested that NNRTI binding increases the RNase H-NNRTI-polymerase angle (Shaw-Reid et al., 2005), which could lead to increased accessibility of the RNase H active site to the RNA:DNA hybrid. By analogy, NNRTI resistance mutations may have effects on the positioning of the RNase H active site relative to its substrate, leading to slower rates of RNase H cleavage.
Interestingly, we also noted that these mutants exhibited a reduction in synthesis from tRNALys,3 that correlated with their relative reductions in replication fitness and RNase H cleavage. This finding was somewhat surprising, since our extensive studies of polymerization did not reveal any abnormalities in RNA- or DNA-dependent synthesis from DNA primers, including a DNA primer hybridized to the PBS. RNase H cleavage is not known to be required for initiation or extension from tRNALys,3, but prior studies have demonstrated that mutants in the RNase H domain with reduced RNase H activity also slow initiation of minus-strand synthesis in cell culture (Julias et al., 2002). Although it is possible that the reductions in RNase H cleavage and tRNALys,3 priming reflect independent effects of these mutations on RNase H activity and tRNA priming, we believe it more likely that these abnormalities result from the same structural perturbation, and that other drug-resistant mutants with RNase H defects will also demonstrate slowed synthesis from tRNALys,3. Studies are in progress to evaluate this hypothesis.
These studies do not allow us to determine whether both or only one of these biochemical abnormalities is sufficient to account for the reduced replication fitness of NNRTI-resistant variants. These studies do provide evidence that clinically occurring NNRTI-resistance mutations can selectively alter both RNase H cleavage and tRNA priming by HIV-1 RT, and that one or both of these biochemical abnormalities likely lead to reduced HIV-1 replication efficiency and a reduced likelihood of a mutant developing during treatment failure with NNRTI-containing regimens. A better understanding of how the balance between replication efficiency and drug resistance affects the likelihood of a given mutation developing during therapy could facilitate the development of newer generation NNRTIs that do not select for resistance mutations, such as K103N, which emerge early during treatment failure and confer broad cross-resistance to currently available NNRTIs.
Materials and methods
Reagents
The following reagents were obtained through the AIDS Research and Reference Reagent Program, Division of AIDS, National Institute of Allergy and Infectious Disease: the infectious molecular clone pNL4-3 was obtained from Malcolm Martin, and the PM-1 neoplastic CD4+ T cell line was obtained from Marvin Reita. Efavirenz was obtained from Dupont Pharmaceuticals, reconstituted in DMSO to achieve a final concentration of 5 mg/ml and stored at −20 °C. Oligonucleotides were obtained from Oligos, Etc., except for the RNA substrate used in the kinetic polymerization studies, which was obtained from New England Biolabs, Inc.
Cell culture
293 human primary embryonal kidney cells (American Type Culture Collection; Manassas, VA) were grown in Dulbecco’s modified Eagle’s medium (DMEM) supplemented with 10% (vol/vol) fetal bovine serum, L-glutamine (2 mM), penicillin (100 U/ml), and streptomycin (100 U/ml). PM1 cells were grown in RPMI supplemented with 10% fetal bovine serum, penicillin (100 U/ml), and streptomycin (100 U/ml). All cells were propagated in 5% CO2 at 37 °C.
Site-directed mutagenesis
The G190S and G190A mutations were each introduced into pRHA1 (Gerondelis et al., 1999), using PCR with mutagenic oligonucleotides (QuikChange II, Stratagene, La Jolla, CA). The mutagenic oligonucleotides were: 5′-C ATG GAT GAT TTG TAT GTA AGC TCT GAC TTA GAA ATA GG-3′ for G190S and 5′-C ATG GAT GAT TTG TAT GTA GCA TCT GAC TTA GAA ATA GG-3′ for G190A (mutagenized nucleotides are underlined). Clones were sequenced in both directions across the entire RT region to verify the absence of spurious mutations and the presence of the desired mutation.
Generation of NNRTI-resistant virus stocks
The G190S and G190A resistance mutations were separately subcloned from pRHA1(G190S) and pRHA1(G190A) into pNL4-3 by using ApaI and AgeI restriction sites to generate pNL4-3(G190S) and pNL4-3(G190A). These clones were then sequenced to verify the integrity of the cloning sites and the presence of the appropriate RT resistance mutation. pNL43 (K103N) was made as previously described (Gerondelis et al., 1999). 293 cells were transiently transfected with 40 μg of either pNL4-3WT, pNL4-3(K103N), pNL4-3(G190S), or pNL4-3(G190A) DNA by lipofection (SuperFect, Qiagen, Santa Clarita, CA). After 72 h, supernatants were harvested, aliquoted, and stored at −80 °C. HIV-1 virus capsid protein (p24) quantitation was performed on virus stocks using HIV-1 p24 antigen ELISA (Perkin Elmer, Wellesley, MA).
Growth competition assay
Virus growth competition assays were performed by co-infecting 3 × 10⁶ PM1 cells with two different HIV variants. Volumes of virus stock corresponding to a total of 150 ng of p24 were used to infect PM1 cells in 1 ml medium at 37 °C for 1 h. The viral variants were co-infected at either a 25:75 or 50:50 ratio relative to each other. After washing with PBS, the infected cells were resuspended in 15 ml of medium without or with EFV (10, 50, 100, 200, 300, or 500 nM, final concentration), and incubated at 37 °C in 5% CO2. At 3, 4, 5, and 6 days postinfection, 3 ml of culture (cells and supernatant) was removed for testing and the same volume replaced with fresh medium. The culture supernatant was harvested after centrifugation for p24 measurement, and the cell pellet was used to isolate genomic DNA (QIAamp DNA Blood Mini kit, Qiagen, Santa Clarita, CA). The proviral DNA was amplified using PCR (Platinum Taq DNA Polymerase High Fidelity, Invitrogen) and the following primers: RT-18, 5′-G GGA AAC CAA AAATGA TAG GGG-3′ and RT-20, 5′-CTG CCA GTT CTA GCT CTG CTT C-3′. Cycling conditions were those recommended by the manufacturer. Direct sequencing of PCR products was performed using BigDye fluorescent-labeled terminators and AmpliTaqFS (V3.1 PE Biosystems, Foster City, CA). The sequencing primers used were RT060 (sense, 5′-CTG AAA ATC CAT ACA ATA CTC C-3′) and 215D (antisense, 5′-TCT GTA TGT CAT TGA CAG TCC AGC-3′). The relative proportions of mutant variants at each time point were quantitated by averaging the relative peak heights of the electropherograms from the sense and antisense sequencing reactions of a minimum of two replicate infections. Each growth competition experiment between a given pair of mutants was performed in duplicate.
Clonal analysis of growth competition experiments
PCR products amplified from competition experiments as described above were cloned used the TOPO TA cloning kit (Invitrogen, Carlsbad, CA). Twenty-four clones from each PCR product were sequenced using the methods described above and the percentage of each variant was calculated.
Calculation of relative fitness coefficient, s
The p24 antigen content in the supernatant was determined for each time point using an ELISA (Perkin Elmer, Wellesley, MA), and the p24 content represented by the reference virus was calculated by multiplying the proportion of reference virus (as determined by sequence analysis) by the total p24 content of the growth competition culture. The fitness coefficient s was then calculated by the method of Maree (Maree et al., 2000):
where W(T)/W(0) is the fold expansion of wild-type or reference virus which is calculated by dividing the p24 content in the culture at time T by that at time 0. H(T)/H(0) is the fold change in the mutant/reference virus ratio over T days of the experiment. Delta is the life span of an infected cell and was estimated to be 0.5/day (Maree et al., 2000). A negative s value indicates that the test virus is less fit than the reference and a positive s value indicates that the virus is more fit.
Expression of heterodimeric RT
We used the pRSETB expression vector, which has the T7 promoter and an amino-terminal hexahistidine (His6) tag. Each subunit of RT was expressed in BL21(DE3,pLysS). We purified each subunit with metal affinity chromatography, followed by DEAE-Sepharose and SP-Sepharose chromatography as described previously (Archer et al., 2000; Gerondelis et al., 1999). Heterodimeric RTs were made by mixing equimolar amounts of the p66 and p51 subunits in 50 mM Tris (pH7.0), 25 mM NaCl, 1 mM EDTA, 0.5 mM DTT, and 25% glycerol. Mutant RT heterodimers contained the respective NNRTI resistance mutation in both p66 and p51.
Assays of specific activity of DNA polymerization by HIV-1 RTs
DNA polymerization activity of each RT preparation was measured in at least three independent experiments by the incorporation of [32P] dTTP with a poly(rA)-oligo(dT) template-primer, as previously described (Archer et al., 2000). The reaction was performed in 50 mM Tris–HCl, 50 mM NaCl, 1 mM EDTA, and 1 mM DTT. The relative amounts of each RT preparation added to both the processivity and RNase H activity assays were normalized by their relative specific activities of polymerization.
Processivity assays
Processivity of the different RTs was tested on a hetero-polymeric 520-nt RNA substrate, as previously described (Archer et al., 2000). The RNA template, D520, comprises the first 520 nt of the 5′ end of the NL4-3 genome (+1 to +520). The template was generated in vitro using an in vitro transcription kit (Ambion), a linearized plasmid and T7 RNA polymerase as previously described (Balakrishnan et al., 2001), and was purified on a 5% polyacrylamide-urea gel. Twenty femtomole of the RNA template was annealed to 40 fmol of a 5′-end 32P-labeled DNA oligonucleotide, MB-24 (5′-CCC AGT ATT TGT CTA CAG CC-3′). RTs were prebound to the substrate for 3 min at 37 °C and reactions were initiated with a mixture of magnesium acetate and dNTPs in 50 mM Tris–HCl, 50 mM NaCl, 1 mM EDTA, and 1 mM DTT. Reactions were carried out in the presence of a heparin trap (75 ng) and sampled at times ranging from 15 s to 15 min. Products were resolved by 6% denaturing polyacrylamide gel electrophoresis followed by autoradiography.
RNase H assays
Rates of DNA 3′-end-directed and RNA 5′-end-directed RNase H cleavages were measured as previously described (Archer et al., 2000; Gerondelis et al., 1999). Briefly, the substrate used to measure DNA 3′-end-directed RNase H cleavage was a 41-nt 5′-end 32P-labeled RNA annealed to a short DNA (26 NT) such that the 3′ end of the DNA was recessed. The substrate of RNA 5′-end-directed RNase H cleavage was the same 41 NT 5′-end 32P-labeled RNA annealed to a longer DNA (77 NT) such that the 5′ end of the RNA was recessed. Amounts of RT added to each reaction were normalized based on the relative activity of DNA polymerization. Reaction conditions were the same as for the RT specific activity assay, except that dNTPs were omitted. Products were resolved by 10% denaturing polyacrylamide-urea gel electrophoresis followed by autoradiography, and were quantified using PhosphorImaging.
Kinetic assays of polymerization by HIV-1 RTs
Single nucleotide incorporation was used to study the kinetics of polymerization under steady state and presteady state conditions. The 20-mer DNA oligonucleotide shown in Table 5 was 5′-radiolabeled using T4 polynucleotide kinase (fermentas) and then annealed to either the 40-mer DNA oligonucleotide or the RNA. The heteroduplex RNA/DNA and homoduplex DNA/DNA were annealed using a 1:1.5 primer-template ratio at 80 °C for 10 min followed by room temperature 10 min, or 95 °C for 10 min, respectively.
Table 5.
Sequence of oligonucleotide substrates
| RNA/DNA 20/40-mer: |
| 5′-CATTGTCGTATGTACTGAGT-3′ |
| 3′-CTUAACAGUAACAGCAUACAUGACUCACAACCUGAUACAC-5′ |
| DNA/DNA 20/40-mer: |
| 5′-CATTGTCGTATGTACTGAGT-3′ |
| 3′-CTTAACAGTAACAGCATACATGACTCACAACCTGATACAC-5′ |
Steady state assays of single nucleotide incorporation were assayed on DNA–DNA and DNA–RNA primer-templates over a range of substrate concentrations (5 nM–50 μM dGTP), under conditions in which <10% of substrate was converted to product. Reactions were initiated with magnesium and terminated with EDTA after 3 min. Vmax values were calculated by fitting the data to the Michaelis–Menten equation, using non-linear regression (KaleidaGraph), and kcat was calculated by dividing Vmax by the active enzyme concentration.
Presteady state burst reactions were performed using the same primer-template. Relative amounts of mutant and wild-type RTs were normalized based on active RT concentration. Reactions were initiated by rapid mixing of prebound RT primer/template substrate with 10 mM magnesium acetate in a KinTek rapid quench-flow machine, and terminated with EDTA at times ranging from 10 ms to 5.5 s. In presteady state assays, data points were fit to the burst equation using non-linear regression, to calculate the active enzyme concentration, which is equivalent to the amplitude of the initial burst phase; kss, which is the rate-limiting step for polymerization; and kpol, the maximal rate of dGTP incorporation. Kd for dGTP was calculated by plotting burst rates at dGTP concentrations ranging from 0.625 to 80 μM and fitting to the hyperbolic equation (kburst = kpol [dNTP] / (Kd + [dNTP]), using non-linear regression (KaleidaGraph).
Both steady state and presteady state reactions were performed in 50 mM Tris–HCl pH 8.0, 50 mM NaCl, 1 mM EDTA, 1 mM DTT, and 10 mM magnesium acetate. Substrates and products were resolved by denaturing polyacrylamide gel electrophoresis followed by autoradiography, and quantified by PhosphorImaging. Experiments were performed in triplicate.
Assays of synthesis from tRNALys,3
Purified tRNALys,3 from human placenta was obtained from Bio S&T (Lachine, Quebec, Canada). The RNA template D199 (positions +1 to +199 of the pNL4-3 genomic RNA, including the PBS) was generated by run-off transcription in vitro using the Ambion T7-MEGAshortscript kit (Austin, TX) as previously described (Chen et al., 2003). The annealing of 50 nM tRNALys,3 primer and 40 nM D199 RNA was carried out at 65 °C for 2 min in 50 mM NaCl, 50 mM Tris–HCl (pH 8.0); the mixture was gradually cooled to 37 °C for 30 min. RTs were prebound to the annealed primer/template for 3 min at 37 °C and reactions were initiated with a mixture of 7.5 mM magnesium acetate; 1.25 μM α-32P-dTTP (PerkinElmer, Shelton, CT); 25 μM of dATP, dCTP, dGTP; 0.5 μM unlabeled dTTP in 50 mM Tris–HCl, 50 mM NaCl, 1 mM EDTA, and 1 mM DTT. Before and 1, 5, 10, 15, and 20 min after initiation, aliquots were removed and the reactions were stopped by mixing with same volume of gel loading buffer (Ambion, Austin, TX). Products were resolved by 6% denaturing polyacrylamide gel electrophoresis followed by autoradiography, and were quantified using PhosphorImaging. We also performed the same synthesis reaction using a 5′-end 32P-labeled PBS DNA primer, as previously described (Chen et al., 2003).
Acknowledgments
This work was supported by NIH R01 AI-41387. We would like to acknowledge Dr. Mini Balakrishnan, who provided helpful advice regarding the biochemical studies.
References
- Albrecht MA, Bosch RJ, Hammer SM, Liou SH, Kessler H, Para MF, Eron J, Valdez H, Dehlinger M, Katzenstein DA. Nelfinavir, efavirenz, or both after the failure of nucleoside treatment of HIV infection. N Engl J Med. 2001;345(6):398–407. doi: 10.1056/NEJM200108093450602. [DOI] [PubMed] [Google Scholar]
- Archer RH, Dykes C, Gerondelis P, Lloyd A, Fay P, Reichman RC, Bambara RA, Demeter LM. Mutants of human immunodeficiency virus type 1 (HIV-1) reverse transcriptase resistant to nonnucleoside reverse transcriptase inhibitors demonstrate altered rates of RNase H cleavage that correlate with HIV-1 replication fitness in cell culture. J Virol. 2000;74(18):8390–8401. doi: 10.1128/jvi.74.18.8390-8401.2000. [DOI] [PMC free article] [PubMed] [Google Scholar]
- Arts EJ, Li X, Gu Z, Kleiman L, Parniak MA, Wainberg MA. Comparison of deoxyoligonucleotide and tRNA (Lys-3) as primers in an endogenous human immunodeficiency virus-1 in vitro reverse transcription/template-switching reaction. J Biol Chem. 1994;269(20):14672–14680. [PubMed] [Google Scholar]
- Bacheler LT, Anton ED, Kudish P, Baker D, Bunville J, Krakowski K, Bolling L, Aujay M, Wang XV, Ellis D, Becker MF, Lasut AL, George HJ, Spalding DR, Hollis G, Abremski K. Human immunodeficiency virus type 1 mutations selected in patients failing efavirenz combination therapy. Antimicrob Agents Chemother. 2000;44(9):2475–2484. doi: 10.1128/aac.44.9.2475-2484.2000. [DOI] [PMC free article] [PubMed] [Google Scholar]
- Bacheler L, Jeffrey S, Hanna G, D’Aquila R, Wallace L, Logue K, Cordova B, Hertogs K, Larder B, Buckery R, Baker D, Gallagher K, Scarnati H, Tritch R, Rizzo C. Genotypic correlates of phenotypic resistance to efavirenz in virus isolates from patients failing nonnucleoside reverse transcriptase inhibitor therapy. J Virol. 2001;75(11):4999–5008. doi: 10.1128/JVI.75.11.4999-5008.2001. [DOI] [PMC free article] [PubMed] [Google Scholar]
- Balakrishnan M, Fay PJ, Bambara RA. The kissing hairpin sequence promotes recombination within the HIV-1 5′ leader region. J Biol Chem. 2001;276(39):36482–36492. doi: 10.1074/jbc.M102860200. [DOI] [PubMed] [Google Scholar]
- Chen Y, Balakrishnan M, Roques BP, Bambara RA. Steps of the acceptor invasion mechanism for HIV-1 minus strand strong stop transfer. J Biol Chem. 2003;278(40):38368–38375. doi: 10.1074/jbc.M305700200. [DOI] [PubMed] [Google Scholar]
- Cohen KA, Hopkins J, Ingraham RH, Pargellis C, Wu JC, Palladino DE, Kinkade P, Warren TC, Rogers S, Adams J, et al. Characterization of the binding site for nevirapine (BI-RG-587), a nonnucleoside inhibitor of human immunodeficiency virus type-1 reverse transcriptase. J Biol Chem. 1991;266(22):14670–14674. [PubMed] [Google Scholar]
- Demeter LM, Shafer RW, Meehan PM, Holden-Wiltse J, Fischl MA, Freimuth WW, Para MF, Reichman RC. Delavirdine susceptibilities and associated reverse transcriptase mutations in human immunodeficiency virus type 1 isolates from patients in a phase I/II trial of delavirdine monotherapy (ACTG 260) Antimicrob Agents Chemother. 2000;44(3):794–797. doi: 10.1128/aac.44.3.794-797.2000. [DOI] [PMC free article] [PubMed] [Google Scholar]
- DeStefano JJ, Mallaber LM, Fay PJ, Bambara RA. Determinants of the RNase H cleavage specificity of human immunodeficiency virus reverse transcriptase. Nucleic Acids Res. 1993;21(18):4330–4338. doi: 10.1093/nar/21.18.4330. [DOI] [PMC free article] [PubMed] [Google Scholar]
- Domaoal RA, Demeter LM. Structural and biochemical effects of human immunodeficiency virus mutants resistant to non-nucleoside reverse transcriptase inhibitors. Int J Biochem Cell Biol. 2004;36(9):1735–1751. doi: 10.1016/j.biocel.2004.02.026. [DOI] [PubMed] [Google Scholar]
- Dueweke TJ, Pushkarskaya T, Poppe SM, Swaney SM, Zhao JQ, Chen IS, Stevenson M, Tarpley WG. A mutation in reverse transcriptase of bis (heteroaryl)piperazine-resistant human immunodeficiency virus type 1 that confers increased sensitivity to other nonnucleoside inhibitors. Proc Natl Acad Sci U S A. 1993;90(10):4713–4717. doi: 10.1073/pnas.90.10.4713. [DOI] [PMC free article] [PubMed] [Google Scholar]
- Fuentes GM, Fay PJ, Bambara RA. Relationship between plus strand DNA synthesis removal of downstream segments of RNA by human immunodeficiency virus, murine leukemia virus and avian myeloblastoma virus reverse transcriptases. Nucleic Acids Res. 1996a;24(9):1719–1726. doi: 10.1093/nar/24.9.1719. [DOI] [PMC free article] [PubMed] [Google Scholar]
- Fuentes GM, Palaniappan C, Fay PJ, Bambara RA. Strand displacement synthesis in the central polypurine tract region of HIV-1 promotes DNA to DNA strand transfer recombination. J Biol Chem. 1996b;271(47):29605–29611. doi: 10.1074/jbc.271.47.29605. [DOI] [PubMed] [Google Scholar]
- Furfine ES, Reardon JE. Reverse transcriptase RNase H from the human immunodeficiency virus. Relationship of the DNA polymerase and RNA hydrolysis activities. J Biol Chem. 1991;266(1):406–412. [PubMed] [Google Scholar]
- Gao HQ, Boyer PL, Arnold E, Hughes SH. Effects of mutations in the polymerase domain on the polymerase, RNase H and strand transfer activities of human immunodeficiency virus type 1 reverse transcriptase. J Mol Biol. 1998;277(3):559–572. doi: 10.1006/jmbi.1998.1624. [DOI] [PubMed] [Google Scholar]
- Gerondelis P, Archer RH, Palaniappan C, Reichman RC, Fay PJ, Bambara RA, Demeter LM. The P236L delavirdine-resistant human immunodeficiency virus type 1 mutant is replication defective and demonstrates alterations in both RNA 5′-end- and DNA 3′-end-directed RNase H activities. J Virol. 1999;73(7):5803–5813. doi: 10.1128/jvi.73.7.5803-5813.1999. [DOI] [PMC free article] [PubMed] [Google Scholar]
- Goff SP. Retroviral reverse transcriptase: synthesis, structure, and function. J Acquired Immune Defic Syndr. 1990;3(8):817–831. [PubMed] [Google Scholar]
- Gopalakrishnan V, Peliska JA, Benkovic SJ. Human immunodeficiency virus type 1 reverse transcriptase: spatial and temporal relationship between the polymerase and RNase H activities. Proc Natl Acad Sci U S A. 1992;89(22):10763–10767. doi: 10.1073/pnas.89.22.10763. [DOI] [PMC free article] [PubMed] [Google Scholar]
- Gulick RM, Ribaudo HJ, Shikuma CM, Lustgarten S, Squires KE, Meyer WA, III, Acosta EP, Schackman BR, Pilcher CD, Murphy RL, Maher WE, Witt MD, Reichman RC, Snyder S, Klingman KL, Kuritzkes DR. Triple-nucleoside regimens versus efavirenz-containing regimens for the initial treatment of HIV-1 infection. N Engl J Med. 2004;350(18):1850–1861. doi: 10.1056/NEJMoa031772. [DOI] [PubMed] [Google Scholar]
- Huang W, Gamarnik A, Limoli K, Petropoulos CJ, Whitcomb JM. Amino acid substitutions at position 190 of human immunodeficiency virus type 1 reverse transcriptase increase susceptibility to delavirdine and impair virus replication. J Virol. 2003;77(2):1512–1523. doi: 10.1128/JVI.77.2.1512-1523.2003. [DOI] [PMC free article] [PubMed] [Google Scholar]
- Isel C, Lanchy JM, Le Grice SF, Ehresmann C, Ehresmann B, Marquet R. Specific initiation and switch to elongation of human immunodeficiency virus type 1 reverse transcription require the post-transcriptional modifications of primer tRNA3Lys. EMBO J. 1996;15(4):917–924. [PMC free article] [PubMed] [Google Scholar]
- Johnson KA. Rapid quench kinetic analysis of polymerases, adenosinetriphosphatases, and enzyme intermediates. Methods Enzymol. 1995;249:38–61. doi: 10.1016/0076-6879(95)49030-2. [DOI] [PubMed] [Google Scholar]
- Julias JG, Ferris AL, Boyer PL, Hughes SH. Replication of phenotypically mixed human immunodeficiency virus type 1 virions containing catalytically active and catalytically inactive reverse transcriptase. J Virol. 2001;75(14):6537–6546. doi: 10.1128/JVI.75.14.6537-6546.2001. [DOI] [PMC free article] [PubMed] [Google Scholar]
- Julias JG, McWilliams MJ, Sarafianos SG, Arnold E, Hughes SH. Mutations in the RNase H domain of HIV-1 reverse transcriptase affect the initiation of DNA synthesis and the specificity of RNase H cleavage in vivo. Proc Natl Acad Sci U S A. 2002;99(14):9515–9520. doi: 10.1073/pnas.142123199. [DOI] [PMC free article] [PubMed] [Google Scholar]
- Kati WM, Johnson KA, Jerva LF, Anderson KS. Mechanism and fidelity of HIV reverse transcriptase. J Biol Chem. 1992;267(36):25988–25997. [PubMed] [Google Scholar]
- Kohlstaedt LA, Wang J, Friedman JM, Rice PA, Steitz TA. Crystal structure at 3.5 A resolution of HIV-1 reverse transcriptase complexed with an inhibitor. Science. 1992;256 (5065):1783–1790. doi: 10.1126/science.1377403. [DOI] [PubMed] [Google Scholar]
- Koval CE, Dykes C, Demeter LM. 11th Conference on Retroviruses and Opportunistic Infections; San Francisco, CA. submitted for publication. [Google Scholar]
- Maree AF, Keulen W, Boucher CA, De Boer RJ. Estimating relative fitness in viral competition experiments. J Virol. 2000;74(23):11067–11072. doi: 10.1128/jvi.74.23.11067-11072.2000. [DOI] [PMC free article] [PubMed] [Google Scholar]
- Palaniappan C, Fay PJ, Bambara RA. Nevirapine alters the cleavage specificity of ribonuclease H of human immunodeficiency virus 1 reverse transcriptase. J Biol Chem. 1995;270(9):4861–4869. doi: 10.1074/jbc.270.9.4861. [DOI] [PubMed] [Google Scholar]
- Palaniappan C, Fuentes GM, Rodriguez-Rodriguez L, Fay PJ, Bambara RA. Helix structure and ends of RNA/DNA hybrids direct the cleavage specificity of HIV-1 reverse transcriptase RNase H. J Biol Chem. 1996;271(4):2063–2070. [PubMed] [Google Scholar]
- Palaniappan C, Wisniewski M, Jacques PS, Le Grice SF, Fay PJ, Bambara RA. Mutations within the primer grip region of HIV-1 reverse transcriptase result in loss of RNase H function. J Biol Chem. 1997;272(17):11157–11164. doi: 10.1074/jbc.272.17.11157. [DOI] [PubMed] [Google Scholar]
- Powell MD, Beard WA, Bebenek K, Howard KJ, Le Grice SF, Darden TA, Kunkel TA, Wilson SH, Levin JG. Residues in the alphaH and alphaI helices of the HIV-1 reverse transcriptase thumb subdomain required for the specificity of RNase H-catalyzed removal of the polypurine tract primer. J Biol Chem. 1999;274(28):19885–19893. doi: 10.1074/jbc.274.28.19885. [DOI] [PubMed] [Google Scholar]
- Richman DD, Havlir D, Corbeil J, Looney D, Ignacio C, Spector SA, Sullivan J, Cheeseman S, Barringer K, Pauletti D. Nevirapine resistance mutations of human immunodeficiency virus type 1 selected during therapy. J Virol. 1994;68(3):1660–1666. doi: 10.1128/jvi.68.3.1660-1666.1994. [DOI] [PMC free article] [PubMed] [Google Scholar]
- Robbins GK, De Gruttola V, Shafer RW, Smeaton LM, Snyder SW, Pettinelli C, Dube MP, Fischl MA, Pollard RB, Delapenha R, Gedeon L, van der Horst C, Murphy RL, Becker MI, D’Aquila RT, Vella S, Merigan TC, Hirsch MS. Comparison of sequential three-drug regimens as initial therapy for HIV-1 infection. N Engl J Med. 2003;349(24):2293–2303. doi: 10.1056/NEJMoa030264. [DOI] [PMC free article] [PubMed] [Google Scholar]
- Shaw-Reid CA, Feuston B, Munshi V, Getty K, Krueger J, Hazuda DJ, Parniak MA, Miller MD, Lewis D. Dissecting the effects of DNA polymerase and ribonuclease H inhibitor combinations on HIV-1 reverse-transcriptase activities. Biochemistry. 2005;44 (5):1595–1606. doi: 10.1021/bi0486740. [DOI] [PubMed] [Google Scholar]
- Spence RA, Kati WM, Anderson KS, Johnson KA. Mechanism of inhibition of HIV-1 reverse transcriptase by nonnucleoside inhibitors. Science. 1995;267 (5200):988–993. doi: 10.1126/science.7532321. [DOI] [PMC free article] [PubMed] [Google Scholar]
- Starr SE, Fletcher CV, Spector SA, Yong FH, Fenton T, Brundage RC, Manion D, Ruiz N, Gersten M, Becker M, McNamara J, Mofenson LM, Purdue L, Siminski S, Graham B, Kornhauser DM, Fiske W, Vincent C, Lischner HW, Dankner WM, Flynn PM. Combination therapy with efavirenz, nelfinavir, and nucleoside reverse-transcriptase inhibitors in children infected with human immunodeficiency virus type 1. Pediatric AIDS Clinical Trials Group 382 Team. N Engl J Med. 1999;341(25):1874–1881. doi: 10.1056/NEJM199912163412502. [DOI] [PubMed] [Google Scholar]
- Staszewski S, Morales-Ramirez J, Tashima KT, Rachlis A, Skiest D, Stanford J, Stryker R, Johnson P, Labriola DF, Farina D, Manion DJ, Ruiz NM. Efavirenz plus zidovudine and lamivudine, efavirenz plus indinavir, and indinavir plus zidovudine and lamivudine in the treatment of HIV-1 infection in adults. Study 006 Team. N Engl J Med. 1999;341(25):1865–1873. doi: 10.1056/NEJM199912163412501. [DOI] [PubMed] [Google Scholar]
- Tisdale M, Schulze T, Larder BA, Moelling K. Mutations within the RNase H domain of human immunodeficiency virus type 1 reverse transcriptase abolish virus infectivity. J Gen Virol. 1991;72(Pt. 1):59–66. doi: 10.1099/0022-1317-72-1-59. [DOI] [PubMed] [Google Scholar]
- Wisniewski M, Balakrishnan M, Palaniappan C, Fay PJ, Bambara RA. Unique progressive cleavage mechanism of HIV reverse transcriptase RNase H. Proc Natl Acad Sci U S A. 2000;97(22):11978–11983. doi: 10.1073/pnas.210392297. [DOI] [PMC free article] [PubMed] [Google Scholar]