

Abstract
Metropolis Monte Carlo (MMC) loop refinement has been performed on the three extracellular loops (ECLs) of rhodopsin and opsin-based homology models of the thyroid-stimulating hormone receptor transmembrane domain, a class A type G protein-coupled receptor. The Monte Carlo sampling technique, employing torsion angles of amino acid side chains and local moves for the six consecutive backbone torsion angles, has previously reproduced the conformation of several loops with known crystal structures with accuracy consistently less than 2 Å. A grid-based potential map, which includes van der Waals, electrostatics, hydrophobic as well as hydrogen-bond potentials for bulk protein environment and the solvation effect, has been used to significantly reduce the computational cost of energy evaluation. A modified sigmoidal distance-dependent dielectric function has been implemented in conjunction with the desolvation and hydrogen-bonding terms. A long high-temperature simulation with 2 kcal/mol repulsion potential resulted in extensive sampling of the conformational space. The slow annealing leading to the low-energy structures predicted secondary structure by the MMC technique. Molecular docking with the reported agonist reproduced the binding site within 1.5 Å. Virtual screening performed on the three lowest structures showed that the ligand-binding mode in the inter-helical region is dependent on the ECL conformations.
Keywords: Metropolis Monte Carlo (MMC), TSHR, class A GPCR, ECL, homology modeling, virtual screening
Introduction
The G protein-coupled receptor (GPCR) super family consists of 4% of the entire protein-coding genome and has ~800 members (Stone & Molliver, 2009). GPCRs form a class of proteins that contain a seven-helix transmembrane domain (TMD). They sense compounds ranging from small molecules to peptides outside the cell, including hormones, neurotransmitters, and odors, as well as light, which activates the signal transduction pathways and finally elicits cellular responses. This makes them unique targets of approximately 50% of medicinal drugs (Gilman, 1987; Overington, Al-Lazikani, & Hopkins, 2006).
The thyroid-stimulating hormone receptor (TSHR) is a member of the GPCR super family and is the primary regulator of thyrocyte function. The TSHR is a major autoantigen in autoimmune thyroid disease and the target of stimulating and blocking TSHR autoantibodies, which cause increases or decreases in circulating T3 and T4 hormone levels, causing hyperthyroidism or hypothyroidism (Latif, Morshed, Zaidi, & Davies, 2009), respectively. In recent work, the crystal structures of the ectodomain of TSHR bound with either stimulating or blocking-type autoantibody have been reported (Sanders et al., 2007, 2011). However, as of today, no X-ray structure for the hinge and transmembrane regions of the TSHR is available. In such scenario, homology modeling of GCPRs has been very useful for functional and drug-target utilities (Ananthan, Zhang, & Hobrath, 2009; de Graaf & Rognan, 2009; McRobb, Capuano, Crosby, Chalmers, & Yuriev, 2010; Mobarec, Sanchez, & Filizola, 2009). The accuracy, reliability, and utility in drug discovery of such a GPCR model can be assessed by the success of virtual screening, targeting the model (Katritch, Rueda, Lam, Yeager, & Abagyan, 2010; Shacham et al., 2004). Besides the transmembrane helices, the literature reports that GPCR’s extracellular loops (ECLs), including those of the TSHR, play key roles in the G protein-activation process (Kleinau et al., 2008; Lawson & Wheatley, 2004; Neumann, Claus, & Paschke, 2005).
Although an area of vigorous research in the past 20 years, protein-loop modeling still has been identified as an area with several setbacks and structural speculations in most of the available state-of-art computational strategies (Fiser, Do, & Šali, 2000; Rohl, Strauss, Chivian, & Baker, 2004; Rossi, Weigelt, Nayeem, & Krystek, 1999). Despite the limitations, mainly due to the longer size of the loops, a number of recent works have successfully reported loop predictions for several GPCRs (de Graaf, Foata, Engkvist, & Rognan, 2008; Goldfeld, Zhu, Beuming, & Friesner, 2011; Mehler, Hassan, Kortagere, & Weinstein, 2006). In this work, we have adopted a Monte Carlo method to model the three ECLs of the TSHR transmembrane employing a local torsion move and a grid-based force field method (Cui, Mezei, & Osman, 2008; Mezei, 2003). Besides modeling the three ECLs of the TSHR of the TMD, we have performed virtual screening with three programs, namely Autodock-4 (Huey, Morris, Olson, & Goodsell, 2007), Autodock-Vina (Trott & Olson, 2010), and eHiTS (Ravitz, Zsoldos, & Simon, 2011; Zsoldos, Reid, Simon, Sadjad, & Johnson, 2006). The docking results have been analyzed and functionalities of the ligand molecules have been evaluated for their biological activities.
Computational strategies and methods
Homology modeling of TSHR TMD
Two homology models of the TSHR transmembrane have been made based on native opsin (PDB 3CAP) and rhodopsin (1F88) crystal structures (Palczewski et al., 2000; Park, Scheerer, Hofmann, Choe, & Ernst, 2008). Figure 1 shows the sequence alignment of the TSHR-TMB to rhodopsin and opsin. A BLAST search with the sequence of the TSHR-TMB in the PDB server for suitable crystal template identification yielded two crystal structures of rhodopsin and opsin with resolutions of 2.8 and 2.9 Å, respectively. Both the templates belong to the class A type GPCR-like TSHR itself and showed very low (desirable) E-values of ~5.68E−8. We used the SWISS-MODEL server (URL: http://swissmodel.expasy.org) to create the initial model based on the opsin crystal structure (Arnold, Bordoli, Kopp, & Schwede, 2006; Kiefer, Arnold, Kunzli, Bordoli, & Schwede, 2009). The SWISS-MODEL report indicated low confidence in the loop region, in contrast to the highly optimized helical regions. The second initial homology model based on the rhodopsin template was obtained from the Uniprot server (Consortium, 2012). The rhodopsin-based model was chosen for comparable RMSD values with the opsin-based structure. Before initiating the loop refinement, we also checked both the structures by validity servers (Chen et al., 2010; Lüthy, Bowie, & Eisenberg, 1992) as the helical regions were not subjected to Monte Carlo sampling.
Figure 1.

Alignment of the TSHR-TMD with rhodopsin. The three ECLs are marked.
Force field
The present work used the simulation protocol and force field developed in a previous publication (Cui et al., 2008). That work showed that this protocol can reproduce the crystal structure loop conformations of several different proteins with RMSD < 2 Å. The force field consists of the following terms:
where eT(φi) is the torsion term of the dihedrals sampled, represented by the CHARMM force field and e(rij) is the sum of electrostatic (eEle), van der Waals (eLJ), hydrogen-bonding (eHB), and desolvation terms (eDes). Note that the term ‘energy’ is used loosely here – the desolvation term is really free energy and the use of the dielectric constant incorporates a free-energy component into the electrostatic term as well.
Electrostatics with distance-dependent dielectric
Based on the work of Mehler and Solmajer (1991), the Coulomb potential eEle(r) was used along with a sigmoidal distance-dependent dielectric function e(r):
where
van der Waals (VDW)
For VDW, a 12–6 Lennard-Jones potential was used:
where the parameters c6 and c12 used for the interaction between mobile atoms were taken from the all-atom CHARMM force field, (Brooks et al., 1983) while the parameters from the Autodock-4 force field (Huey et al., 2007) were used for the VDW interactions between the rigid and mobile atoms (via potential grids), based on Autodock atom types (Huey et al., 2007; Morris et al., 1998).
Hydrogen bond
Hydrogen bonds were represented by a 12–10 potential for bond length range between 1.65 and 3.00 Å and A … H-D angle 90° < θ ≤ 180°:
Desolvation
The free-energy contribution from the loss of solvation during ligand binding is estimated by the method of Wesson and Eisenberg (1992):
where V is the volume of atoms that surround a given atom and shelter it from solvent weighted by S, the solvation parameter. The desolvation term was calculated only for non-polar carbon atoms (q < .2e).
The parameter values used for the various atom types and for the modified sigmoidal dielectric are listed in (Cui et al., 2008) and are implemented as default values in the program MMC (URL: http://inka.mssm.edu/~mezei/mmc), which was used in the simulations described in this paper.
Grid-based force field
To reduce the computational cost of energy evaluation, for each atom type a potential map has been generated to represent interactions with the rigid part of the protein (the transmembrane helices and the intracellular loops). Each map includes the electrostatics, VDW, and desolvation terms, as well as the donor part of the hydrogen-bond potentials. Interactions between the rigid part and the mobile atoms were computed from the eight nearest grid point of the map corresponding to the atom type of the mobile atom by linear interpolation. A cubic grid box of size of 161 × 161 × 161 with a fine grid resolution of .25 Å has been used. For hydrogen bonds, where the mobile atom is the donor, no such map can be generated due to the presence of the cos θ factor. Instead, a linked-cell approach was used where for cubes of volume 33 Å3 the acceptors within hydrogen-bonding range (if any) were listed so the calculation of eHB could be performed efficiently.
Monte Carlo sampling
The two end points (anchor atoms) of each loop were kept fixed at their coordinate in the homology model and the torsion angles of the loop residues around all bonds, not in a ring, were sampled. The list of the torsion angles involving the ECLs was extracted by Simulaid (Dodd, Boone, & Theodorou, 1993) from the initial model. Torsions in the side chains were changed one at a time and accepted by the simple Metropolis criterion. This option is not available for torsions involving backbone bonds since both ends of the chain are fixed. In this case, a so-called ‘local move’ was performed: the random change of a selected backbone torsion angle was followed by judiciously chosen change in the six consecutive backbone torsion angles so that the rest of the chain could remain unchanged. Note that for such moves, the Metropolis criterion has to be supplemented by a Jacobian representing the constraints on the torsion space accessible to the move (Banfelder, Speidel, & Mezei, 2009; Hoffmann & Knapp, 1996).
Each local move has been filtered by the ‘reverse proximity criterion’ as the method has been found to be highly efficient in conformational sampling and ergodic in nature (Mezei, 2003). The step sizes (the range of torsion angles from which the randomly chosen new value is selected) have been tuned to ~30% acceptance rate with the algorithm described in (Mezei, 2010). This automated tuning was a significant help in maintaining the quality of simulation during the simulated annealing (SA) (vide infra), where the calculations go through a wide temperature range requiring different step sizes for efficient sampling.
MC loop sampling and SA
The final conformations of the three ECLs of THSR-TMD were generated in two stages. In the first stage, a long high-temperature simulation was run using a potential map where the maximum repulsion energy was set to 2 kcal/mol. Lowering the energy barriers helps the simulation to fully sample the conformational space. In the second stage, multiple SA had been carried out (in parallel) using the unmodified energy maps starting from distinct conformations that have been generated from the high-temperature run.
The high-temperature simulation was run at T = 5000 K for 2 × 10⁸ (200 M) MC steps. The conformations with the lowest energy in each 105 (100 K) successive segments were clustered using the program Simulaid (Dodd et al., 1993) into 100 clusters using the K-means clustering method (Hartigan & Wong, 1979). SA was performed starting with the lowest energy conformation from each of the 100 clusters. The SA employed a geometric cooling schedule to reach T = 10 K in 122 steps and then linear schedule for the last 10 K with 1 K increment. At each temperature, 3 M MC steps were performed. The final structure was selected based on the energy scoring.
Docking of agonist on TSHR transmembrane
We have tested the TSHR-TMD structure by docking the reported agonist molecule on the TSHR-TMD (Neumann et al., 2009). Three-dimensional geometry optimization of the agonist molecule has been carried out by the Gaussian 09 program using HF/6-31G* basis implementing tight binding self-consistent field (Frisch et al., 2009). The Gaussian output was converted to mol2 format using the AMBER RESP charge scheme in Antechamber tools (Wang, Wang, Kollman, & Case, 2006; Wang, Wolf, Caldwell, Kollman, & Case, 2004). Another MM-based 3D optimization was done by the Marvin Chemaxon built-in force field (https://www.chemaxon.com). The two geometry optimized structures obtained were docked to the TSHR-TMD by all three docking methods as described above. In order to confirm the binding residue site and mode of agonist conformation, we performed docking with a grid box enclosing the entire physiological receptor target.
Virtual screening of chemical libraries by Autodock-4, Autodock-Vina, and eHiTS
Virtual screening has been carried out by three docking programs: Autodock-4, Autodock-Vina, and eHiTS. While both Autodock-4 and Autodock-Vina use genetic algorithms to repeatedly dock each ligand to the target, eHiTS breaks the ligand into small fragments that are docked separately and the docked-fragment poses are reassembled to putative-ligand poses. The orientation of the TSHR-TMD was adjusted using Simulaid (Dodd et al., 1993) to fit the helices and the three ECLs of the receptor into the grid box of volume size 126 × 126 × 126 with .375 Å grid resolution. All batch job submissions in our Linux cluster were facilitated by platform-portable scripts that interface all three docking programs (URL: http://inka.mssm.edu/~mezei/dockres).
The library used for screening was obtained from Chembridge, designed particularly for the GPCRs covering a wide chemical space (URL: http://www.chembridge.com/). The 2D-SDF format structure of the library as received was optimized to 3D structure using the LigPrep software to include the tautomeric states (LigPrep, version 2.3, Schrödinger, LLC, New York, NY, 2009). Before the docking process, each ligand was given Gasteiger charges while the receptor atoms were assigned Kollman charges.
The docking results were analyzed using the Dockres program and other supporting script tools (Mezei & Zhou, 2010). A program called Compligset was run to extract the common ligand molecules with the highest scores predicted by each of the three docking programs (URL: http://inka.mssm.edu/~mezei/dockres).
Results and discussion
In recent times, virtual screening on GPCR homology models has found extensive applications in drug discovery efforts (Congreve, Langmead, Mason, & Marshall, 2011; Costanzi, 2008). Several published GPCR crystal structures have facilitated computational efforts for modeling this receptor class (Lodowski, Angel, & Palczewski, 2009; Palczewski et al., 2000; Warne et al., 2008). Often, the homology-modeling tool has included a post-modeling energy minimization scheme for loop regions implementing the fast molecular dynamics (MD) technique (Fiser et al., 2000; Šali & Blundell, 1993). The fast MD technique is inherently restricted by limited sampling of the conformational space, particularly for the loop regions. In most cases, insufficient conformational sampling results in missing the native basin and a false minimum could be selected (Kim, Blum, Bradley, & Baker, 2009). Due to this major limitation, consistent high-resolution loop prediction cannot be achieved with simple MD runs (Jamroz & Kolinski, 2010). Besides, the conformation of loops can also affect the local membrane environment (Mehler, Periole, Hassan, & Weinstein, 2002). The work presented here is based on the protocol recently developed that reproduced several crystal structure loops within an RMSD of 2 Å (Cui et al., 2008), employing an efficient conformational sampling technique (Mezei, 2003).
High sampling of conformational space
We have refined the initial homology models of the three ECLs of the TSHR-TMD that were obtained as discussed above. The initial high-temperature run at 5000 K with low truncation of the potential barriers obtained a diverse set of structures, out of any local minimum. Figure 2(A) and (B) show the backbones of the 100 cluster representatives obtained from the high-temperature run demonstrating extensive sampling of the conformational space of all three ECL loops. Figure 3 shows the cluster membership of the 2000 structures saved during the high-temperature run demonstrating that most clusters had members from different stretches of the run – another indicator of extensive sampling of the conformation space of these loops. Figure 4 shows the final three low-energy ECL loops with the red color showing the lowest energy conformation, selected for virtual screening. We repeated checking the structure in Verify 3D and MolProbity servers on the post-annealed structure (Chen et al., 2010; Lüthy et al., 1992).
Figure 2.
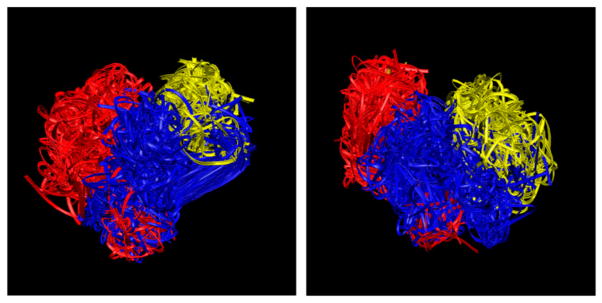
The backbones of the 100 cluster-representative TSHR ECL structures obtained from the 2000 structures extracted from the high-temperature runs and used as initial conformations for SA: rhodopsin template ((A) on left) and opsin template ((B) on right).
Notes: Red: ECL1; Blue: ECL2; Yellow: ECL3.
Figure 3.
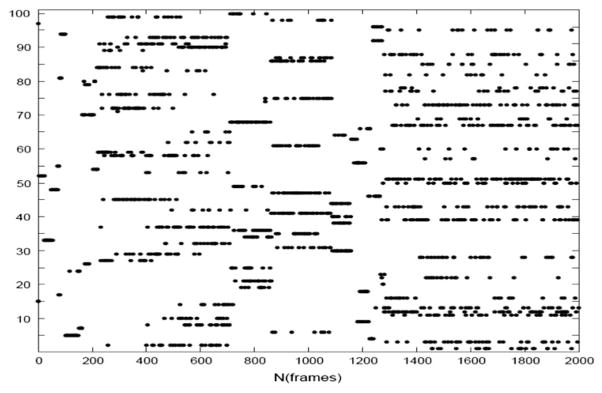
Cluster membership of 2000 structures saved during the high-temperature rhodopsin-based run.
Figure 4.
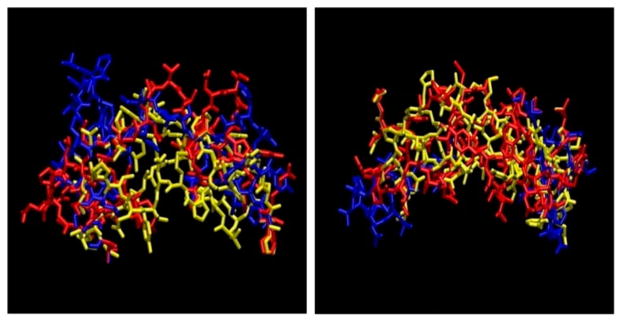
The three lowest energy ECL loops structure for rhodopsin ((A) on left) and opsin templates ((B) on right).
Formation of secondary structure by MC sampling
Reconstitution of the small helical region within ECL1 of the opsin-based model is an interesting observation that we have noticed after the annealing treatment. Besides the small helix in ECL1, there were two more initial beta-sheet regions in ECL2 that completely melted down after the high-temperature sampling at 5000 K. When analyzing the post-annealed structure, we observed that, although the helix in ECL1 reappeared, the beta-sheet regions from homology modeling did not reproduce after extensive MC-conformational sampling. We then performed several high-temperature runs, as well as annealings, at different cooling rates. In all cases, we observed the reproducibility of the helix secondary structure with converged energy ranges for the final conformations. However, non-appearance of the beta sheet in ECL2 may indicate that some of the secondary-structure region from homology modeling, particularly in the loop regions, may be due to a local minima trap that could be validated only after extensive conformational sampling.
Docking poses of agonists and virtual screening
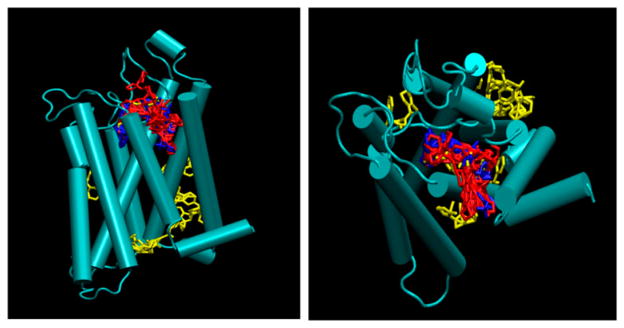
Besides checking the 3D structure in validity servers as above, we have also performed docking of the TSHR agonist molecule whose binding site has already been reported to be the residue ASN at position 5.47 (Neumann et al., 2009). Both the structures of the agonist, obtained in 2D SDF and converted to 3D by Gaussian 09 HF/6-31G* basis and Marvin MM force field, were docked against the TMD by all three docking methods. It was observed that the favorable conformation and binding regions of the agonist in all three docking methods were different, while the site predicted by eHiTS was closest to the reported work in which Dock, FlexS, and FlexX have been used (Neumann et al., 2009). Figure 5(A) and (B) show the binding site of the agonist as predicted by eHiTS as the closest to the reported one within 1.5 forming ASN residue (Neumann et al., 2009). As seen in Figures 4(A) and 5(B), MM-based 3D optimized geometry of the agonist also resulted in similar scoring function and binding residue proximity like the Gaussian 09 derived structure. The virtual screenings were performed on the two chemical libraries of Mount Sinai’s structure-based drug design core and on the GPCR-oriented library from Chembidge.
Figure 5.
Side ((A) on left) and top ((B) on right) view of the known agonist docked to the rhodopsin-based homology model. Agonist 3D geometry optimization has been performed by Gaussian HF/6-31G* basis (Blue) and Marvin Chemaxon MM force field (Red) structure.
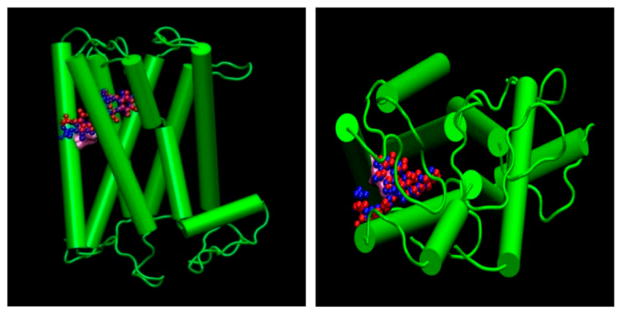
We found that three prominent binding clusters were mostly in the inter-helical regions for both rhodopsin and opsin-based models (Figure 6(A) and (B)). A set of small molecules identified by Dockres was chosen for biological testing that were top scoring as well as identified as common hits in all three docking suits.
Figure 6.
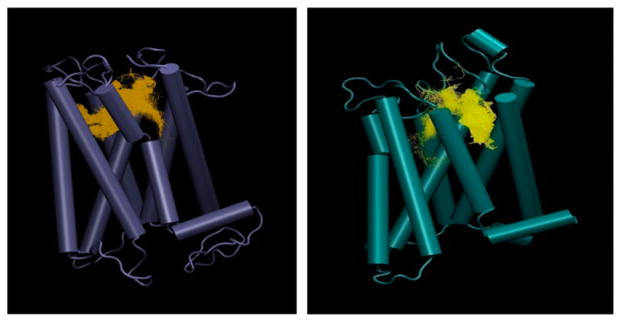
Docking cluster on rhodopsin-based (A) and opsin-based (B) TMD homology models by eHITS.
Integrated analysis of different docking results
Performing screenings with different docking softwares generally gives different sets of top-scoring molecules from each software (Cross et al., 2009; Cummings, DesJarlais, Gibbs, Mohan, & Jaeger, 2005; McGaughey et al., 2007). To integrate the entire chemical space specific to each docking suite, a recently written program called ‘Compligset’ (URL: http://inka.mssm.edu/~mezei/dockres/) was used. The program can integrate results from each virtual screening run from different docking suits. Conveniently, a custom library can be made based on the combined results comprised of the common hits by each docking program for bio-assay. In compiling the results, many top-scoring molecules ranked by individual screenings were eliminated in the final integrated list signifying that the versatility of individual docking algorithms results in wide variation in predicting small-molecule chemical space for a particular receptor. Interestingly, we found less than 17% overlap of the top 500 ligands list between Autodock4 and Vina, while targeting the same region of the receptor using identical docking parameters.
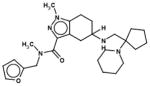
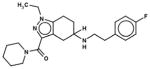
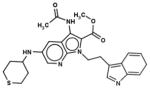
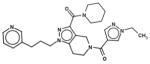
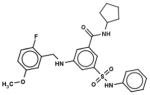
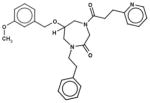
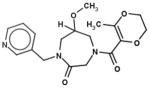
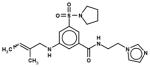
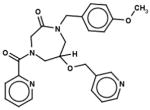
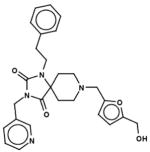
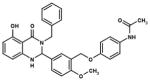
In Table 1, we have presented the 2D structures of the consensus top-scoring 10 molecules and the scoring function values obtained via docking by Autodock4, Autodock-Vina, and eHiTS; for comparison, the known agonist is also shown. These 10 molecules have been found to be common hits by each of the three docking programs. Although top-scoring molecules have relatively high-scoring functions with Autodock-4 and Autodock-Vina, they scored relatively low for eHiTS docking. Also, comparative docking scores highlight the variance in scoring functions, a common feature in the small-molecule docking field (Cross et al., 2009). Figure 7(A) and (B) show the predicted binding sites of the molecules by the three docking programs. Although the predicted binding sites of Autodock-4 and eHiTS are close, prediction by Vina placed clusters all over the receptor.
Table 1.
Consensus top-scoring molecules and their scores.
| Chembridge ID | Structural formula | Autodock 4 (kcal/mol) | Autoock Vina (kcal/mol) | eHiTS (kcal/mol) |
|---|---|---|---|---|
| 41070361 |
|
−9.2 | −8.3 | −5.3 |
| 21049419 |
|
−8.9 | −7.0 | −5.6 |
| 85971922 |
|
−8.1 | −7.3 | −5.1 |
| 54166233 |
|
−7.8 | −7.9 | −6.1 |
| 67411088 |
|
−7.5 | −6.9 | −5.1 |
| 41055215 |
|
−7.1 | −8.5 | −5.3 |
| 25106170 |
|
−7.0 | −6.0 | −5.0 |
| 54167736 |
|
−6.7 | −6.7 | −5.1 |
| 40201997 |
|
−6.5 | −5.9 | −5.2 |
| 42644077 |
|
−6.4 | −7.0 | −5.7 |
| Agonist |
|
−8.6 | −7.4 | −6.5 |
Figure 7.
Comparison of binding sites by Autodock4, Vina, and eHITS. (A): side view on left and (B): top view on right. Notes: Red: eHiTS; Blue: Autodock-4; Yellow: Autodock-Vina.
Ligand-binding selectivity depends on loop conformations
For each of the docking programs, we analyzed the docking data for the TSHR-TMD constructed at the three lowest energy ECLs. For each of the TMD structures, we then extracted the top 500 ranked molecules and checked for overlap with the other two structures implementing the same docking program. We performed the analysis for all loop conformations with Autodock-4, Autodock-Vina, and eHiTS in a similar manner. Table 2 shows the relative overlap of docking results of the top-scoring 500 ligands for each of the docking suit implemented. The results show significant changes in the binding pattern of top-ranked molecules for different loop conformations. In comparison to Autodock-4 and Autodock-Vina, eHiTS has less overlap between structures 1 and 2. But it is clear from the table that even a low energy deviation and conformation change can result in significant changes in the ligand-binding pattern in the TMD helical regions – as can be seen from the case of structures 1 and 3. Overall, the trend clearly indicated that the conformation of the loops plays a key role in ligand-binding selectivity and scoring pattern. The results observed are consistent with earlier reported work (Mehler et al., 2002).
Table 2.
Number of common ligands from docking to the three loop conformations.
| A | |||
|---|---|---|---|
| Autodock | 1 | 2 | 3 |
| 1 | 500 | 200 | 29 |
| 2 | 200 | 500 | 2 |
| 3 | 29 | 2 | 500 |
| B | |||
| Vina | 1 | 2 | 3 |
|
| |||
| 1 | 500 | 238 | 4 |
| 2 | 238 | 500 | 2 |
| 3 | 4 | 2 | 500 |
| C | |||
| eHiTS | 1 | 2 | 3 |
|
| |||
| 1 | 500 | 110 | 14 |
| 2 | 110 | 500 | 17 |
| 3 | 14 | 17 | 500 |
Summary
We report the homology models of the TSHR-TMD based on rhodopsin and opsin templates. We performed Monte Carlo loop sampling on all three ECLs reported as key to ligand binding and to the GPCR activation process. Docking of the known agonist by eHiTS on a rhodopsin-based template with methods implemented in this report showed close proximity to the reported binding site obtained by totally different computational strategies. Successful virtual screening on both models predicts the binding of small molecules in pockets of interhelical regions. Analysis showed that the binding sites of small molecules between helices 1 and 7 and located below ECL3 are influenced by loop conformations. The ligand-binding mode and the relative free-energy score for the three lowest energy loops signified the dependence on conformation. The Compligset program, available on the website (URL: http://inka.mssm.edu/~mezei/dockres), can integrate and compare the docking results from different docking programs. Extracting the top ligand set, occurring as overlap in different docking suits, enhance the process of identifying hit molecules in the structure-based drug molecule search applications.
Acknowledgments
We thank Professor Meng Cui, Virginia Commonwealth University for useful suggestions.
Funding
This work was supported in part by NIH [grant number DK069713] to TFD and in part by the computational resources and staff expertise provided by the Department of Scientific Computing at the Icahn School of Medicine at Mount Sinai.
Footnotes
Author contributions
The manuscript was written through contributions of all authors. All authors have given approval to the final version of the manuscript.
References
- Ananthan S, Zhang W, Hobrath J. Recent advances in structure-based virtual screening of G-protein coupled receptors. The AAPS Journal. 2009;11:178–185. doi: 10.1208/s12248-009-9094-3. [DOI] [PMC free article] [PubMed] [Google Scholar]
- Arnold K, Bordoli L, Kopp J, Schwede T. The SWISS-MODEL workspace: A web-based environment for protein structure homology modelling. Bioinformatics. 2006;22:195–201. doi: 10.1093/bioinformatics/bti770. [DOI] [PubMed] [Google Scholar]
- Banfelder J, Speidel J, Mezei M. Automatic determination of stepsize parameters in monte carlo simulation tested on a bromodomain-binding octapeptide. Algorithms. 2009;2:215–226. [Google Scholar]
- Brooks BR, Bruccoleri RE, Olafson BD, States DJ, Swaminathan S, Karplus M. CHARMM: A program for macromolecular energy, minimization, and dynamics calculations. Journal of Computational Chemistry. 1983;4:187–217. [Google Scholar]
- Chen VB, Arendall WB, III, Headd JJ, Keedy DA, Immormino RM, Kapral GJ, Richardson DC. MolProbity: All-atom structure validation for macromolecular crystallography. Acta Crystallographica Section D: Biological Crystallography. 2010;66:12–21. doi: 10.1107/S0907444909042073. [DOI] [PMC free article] [PubMed] [Google Scholar]
- Congreve M, Langmead CJ, Mason JS, Marshall FH. Progress in structure based drug design for G protein-coupled receptors. Journal of Medicinal Chemistry. 2011;54:4283–4311. doi: 10.1021/jm200371q. [DOI] [PMC free article] [PubMed] [Google Scholar]
- Consortium TU. Reorganizing the protein space at the universal protein resource (UniProt) Nucleic Acids Research. 2012;40:D71–D75. doi: 10.1093/nar/gkr981. [DOI] [PMC free article] [PubMed] [Google Scholar]
- Costanzi S. On the applicability of GPCR homology models to computer-aided drug discovery: A comparison between in silico and crystal structures of the β2-adrenergic receptor. Journal of Medicinal Chemistry. 2008;51:2907–2914. doi: 10.1021/jm800044k. [DOI] [PMC free article] [PubMed] [Google Scholar]
- Cross JB, Thompson DC, Rai BK, Baber JC, Fan KY, Hu Y, Humblet C. Comparison of several molecular docking programs: Pose prediction and virtual screening accuracy. Journal of Chemical Information and Modeling. 2009;49:1455–1474. doi: 10.1021/ci900056c. [DOI] [PubMed] [Google Scholar]
- Cui M, Mezei M, Osman R. Prediction of protein loop structures using a local move Monte Carlo approach and a grid-based force field. Protein Engineering Design and Selection. 2008;21:729–735. doi: 10.1093/protein/gzn056. [DOI] [PMC free article] [PubMed] [Google Scholar]
- Cummings MD, DesJarlais RL, Gibbs AC, Mohan V, Jaeger EP. Comparison of automated docking programs as virtual screening tools. Journal of Medicinal Chemistry. 2005;48:962–976. doi: 10.1021/jm049798d. [DOI] [PubMed] [Google Scholar]
- de Graaf C, Foata N, Engkvist O, Rognan D. Molecular modeling of the second extracellular loop of G-protein coupled receptors and its implication on structure-based virtual screening. Proteins: Structure, Function, and Bioinformatics. 2008;71:599–620. doi: 10.1002/prot.21724. [DOI] [PubMed] [Google Scholar]
- de Graaf C, Rognan D. Customizing G Protein-coupled receptor models for structure-based virtual screening. Current Pharmaceutical Design. 2009;15:4026–4048. doi: 10.2174/138161209789824786. [DOI] [PubMed] [Google Scholar]
- Dodd LR, Boone TD, Theodorou DN. A concerted rotation algorithm for atomistic Monte Carlo simulation of polymer melts and glasses. Molecular Physics. 1993;78:961–996. [Google Scholar]
- Fiser A, Do RKG, Šali A. Modeling of loops in protein structures. Protein Science. 2000;9:1753–1773. doi: 10.1110/ps.9.9.1753. [DOI] [PMC free article] [PubMed] [Google Scholar]
- Frisch MJ, Trucks GW, Schlegel HB, Scuseria GE, Robb MA, Cheeseman JR, Fox DJ. Gaussian 09, Revision B.01. Wallingford, CT: Gaussian, Inc; 2009. [Google Scholar]
- Gilman AG. G-proteins - Transducers of receptor-generated signals. Annual Review of Biochemistry. 1987;56:615–649. doi: 10.1146/annurev.bi.56.070187.003151. [DOI] [PubMed] [Google Scholar]
- Goldfeld DA, Zhu K, Beuming T, Friesner RA. Successful prediction of the intra- and extracellular loops of four G-protein-coupled receptors. Proceedings of the National Academy of Sciences. 2011;108:8275–8280. doi: 10.1073/pnas.1016951108. [DOI] [PMC free article] [PubMed] [Google Scholar]
- Hartigan JA, Wong MA. Algorithm AS 136: A K-means Clustering algorithm. Journal of the Royal Statistical Society: Series C (Applied Statistics) 1979;28:100–108. [Google Scholar]
- Hoffmann D, Knapp EW. Polypeptide folding with off-lattice Monte Carlo dynamics: The method. European Biophysics Journal. 1996;24:387–403. [Google Scholar]
- Huey R, Morris GM, Olson AJ, Goodsell DS. A semiempirical free energy force field with charge-based desolvation. Journal of Computational Chemistry. 2007;28:1145–1152. doi: 10.1002/jcc.20634. [DOI] [PubMed] [Google Scholar]
- Jamroz M, Kolinski A. Modeling of loops in proteins: A multi-method approach. BMC Structural Biology. 2010;10:5. doi: 10.1186/1472-6807-10-5. [DOI] [PMC free article] [PubMed] [Google Scholar]
- Katritch V, Rueda M, Lam PCH, Yeager M, Abagyan R. GPCR 3D homology models for ligand screening: Lessons learned from blind predictions of adenosine A2a receptor complex. Proteins: Structure, Function, and Bioinformatics. 2010;78:197–211. doi: 10.1002/prot.22507. [DOI] [PMC free article] [PubMed] [Google Scholar]
- Kiefer F, Arnold K, Kunzli M, Bordoli L, Schwede T. The SWISS-MODEL Repository and associated resources. Nucleic Acids Research. 2009;37:D387–D392. doi: 10.1093/nar/gkn750. [DOI] [PMC free article] [PubMed] [Google Scholar]
- Kim DE, Blum B, Bradley P, Baker D. Sampling bottlenecks in De novo protein structure prediction. Journal of Molecular Biology. 2009;393:249–260. doi: 10.1016/j.jmb.2009.07.063. [DOI] [PMC free article] [PubMed] [Google Scholar]
- Kleinau G, Jaeschke H, Mueller S, Raaka BM, Neumann S, Paschke R, Krause G. Evidence for cooperative signal triggering at the extracellular loops of the TSH receptor. The FASEB Journal. 2008;22:2798–2808. doi: 10.1096/fj.07-104711. [DOI] [PMC free article] [PubMed] [Google Scholar]
- Latif R, Morshed SA, Zaidi M, Davies TF. The thyroid-stimulating hormone receptor: Impact of thyroid-stimulating hormone and thyroid-stimulating hormone receptor antibodies on multimerization, cleavage, and signaling. Endocrinology and Metabolism Clinics of North America. 2009;38:319–341. doi: 10.1016/j.ecl.2009.01.006. [DOI] [PubMed] [Google Scholar]
- Lawson Z, Wheatley M. The third extracellular loop of G-protein-coupled receptors: More than just a linker between two important transmembrane helices. Biochemical Society Transactions. 2004;32:1048–1050. doi: 10.1042/BST0321048. [DOI] [PubMed] [Google Scholar]
- Lodowski DT, Angel TE, Palczewski K. Comparative analysis of GPCR crystal structures. Photochemistry and Photobiology. 2009;85:425–430. doi: 10.1111/j.1751-1097.2008.00516.x. [DOI] [PMC free article] [PubMed] [Google Scholar]
- Lüthy R, Bowie JU, Eisenberg D. Assessment of protein models with three-dimensional profiles. Nature. 1992;356:83–85. doi: 10.1038/356083a0. [DOI] [PubMed] [Google Scholar]
- McGaughey GB, Sheridan RP, Bayly CI, Culberson JC, Kreatsoulas C, Lindsley S, Cornell WD. Comparison of topological, shape, and docking methods in virtual screening. Journal of Chemical Information and Modeling. 2007;47:1504–1519. doi: 10.1021/ci700052x. [DOI] [PubMed] [Google Scholar]
- McRobb FM, Capuano B, Crosby IT, Chalmers DK, Yuriev E. Homology modeling and docking evaluation of aminergic G protein-coupled receptors. Journal of Chemical Information and Modeling. 2010;50:626–637. doi: 10.1021/ci900444q. [DOI] [PubMed] [Google Scholar]
- Mehler EL, Hassan SA, Kortagere S, Weinstein H. Ab initio computational modeling of loops in G-protein-coupled receptors: Lessons from the crystal structure of rhodopsin. Proteins: Structure, Function, and Bioinformatics. 2006;64:673–690. doi: 10.1002/prot.21022. [DOI] [PubMed] [Google Scholar]
- Mehler EL, Periole X, Hassan SA, Weinstein H. Key issues in the computational simulation of GPCR function: Representation of loop domains. Journal of Computer-Aided Molecular Design. 2002;16:841–853. doi: 10.1023/a:1023845015343. [DOI] [PubMed] [Google Scholar]
- Mehler EL, Solmajer T. Electrostatic effects in proteins: Comparison of dielectric and charge models. Protein Engineering, Design and Selection. 1991;4:903–910. doi: 10.1093/protein/4.8.903. [DOI] [PubMed] [Google Scholar]
- Mezei M. Efficient Monte Carlo sampling for long molecular chains using local moves, tested on a solvated lipid bilayer. The Journal of Chemical Physics. 2003;118:3874–3879. [Google Scholar]
- Mezei M. Simulaid: A simulation facilitator and analysis program. Journal of Computational Chemistry. 2010;31:2658–2668. doi: 10.1002/jcc.21551. [DOI] [PubMed] [Google Scholar]
- Mezei M, Zhou MM. Dockres: A computer program that analyzes the output of virtual screening of small molecules. Source Code for Biology and Medicine. 2010;5:2. doi: 10.1186/1751-0473-5-2. [DOI] [PMC free article] [PubMed] [Google Scholar]
- Mobarec JC, Sanchez R, Filizola M. Modern homology modeling of G-protein coupled receptors: Which structural template to use? Journal of Medicinal Chemistry. 2009;52:5207–5216. doi: 10.1021/jm9005252. [DOI] [PMC free article] [PubMed] [Google Scholar]
- Morris GM, Goodsell DS, Halliday RS, Huey R, Hart WE, Belew RK, Olson AJ. Automated docking using a Lamarckian genetic algorithm and an empirical binding free energy function. Journal of Computational Chemistry. 1998;19:1639–1662. [Google Scholar]
- Neumann S, Claus M, Paschke R. Interactions between the extracellular domain and the extracellular loops as well as the 6th transmembrane domain are necessary for TSH receptor activation. European Journal of Endocrinology. 2005;152:625–634. doi: 10.1530/eje.1.01891. [DOI] [PubMed] [Google Scholar]
- Neumann S, Huang W, Titus S, Krause G, Kleinau G, Alberobello AT, Gershengorn MC. Small-molecule agonists for the thyrotropin receptor stimulate thyroid function in human thyrocytes and mice. Proceedings of the National Academy of Sciences. 2009;106:12471–12476. doi: 10.1073/pnas.0904506106. [DOI] [PMC free article] [PubMed] [Google Scholar]
- Overington JP, Al-Lazikani B, Hopkins AL. How many drug targets are there? Nature Reviews Drug Discovery. 2006;5:993–996. doi: 10.1038/nrd2199. [DOI] [PubMed] [Google Scholar]
- Palczewski K, Kumasaka T, Hori T, Behnke CA, Motoshima H, Fox BA, Miyano M. Crystal structure of rhodopsin: A G protein-coupled receptor. Science. 2000;289:739–745. doi: 10.1126/science.289.5480.739. [DOI] [PubMed] [Google Scholar]
- Park JH, Scheerer P, Hofmann KP, Choe HW, Ernst OP. Crystal structure of the ligand-free G-protein-coupled receptor opsin. Nature. 2008;454:183–187. doi: 10.1038/nature07063. [DOI] [PubMed] [Google Scholar]
- Ravitz O, Zsoldos Z, Simon A. Improving molecular docking through eHiTS’ tunable scoring function. Journal of Computer-Aided Molecular Design. 2011;25:1033–1051. doi: 10.1007/s10822-011-9482-5. [DOI] [PubMed] [Google Scholar]
- Rohl CA, Strauss CE, Chivian D, Baker D. Modeling structurally variable regions in homologous proteins with rosetta. Proteins: Structure, Function, and Bioinformatics. 2004;55:656–677. doi: 10.1002/prot.10629. [DOI] [PubMed] [Google Scholar]
- Rossi KA, Weigelt CA, Nayeem A, Krystek SR. Loopholes and missing links in protein modeling. Protein Science. 1999;16:1999–2012. doi: 10.1110/ps.072887807. [DOI] [PMC free article] [PubMed] [Google Scholar]
- Šali A, Blundell TL. Comparative protein modelling by satisfaction of spatial restraints. Journal of Molecular Biology. 1993;234:779–815. doi: 10.1006/jmbi.1993.1626. [DOI] [PubMed] [Google Scholar]
- Sanders J, Chirgadze DY, Sanders P, Baker S, Sullivan A, Bhardwaja A, Smith BR. Crystal structure of the TSH receptor in complex with a thyroid-stimulating autoantibody. Thyroid. 2007;17:395–410. doi: 10.1089/thy.2007.0034. [DOI] [PubMed] [Google Scholar]
- Sanders P, Young S, Sanders J, Kabelis K, Baker S, Sullivan A, Rees Smith B. Crystal structure of the TSH receptor (TSHR) bound to a blocking-type TSHR autoantibody. Journal of Molecular Endocrinology. 2011;46:81–99. doi: 10.1530/JME-10-0127. [DOI] [PubMed] [Google Scholar]
- Shacham S, Marantz Y, Bar-Haim S, Kalid O, Warshaviak D, Avisar N, Becker OM. PREDICT modeling and in-silico screening for G-protein coupled receptors. Proteins: Structure, Function, and Bioinformatics. 2004;57:51–86. doi: 10.1002/prot.20195. [DOI] [PubMed] [Google Scholar]
- Stone LS, Molliver DC. In search of analgesia: Emerging poles of GPCRs in pain. Molecular Interventions. 2009;9:234–251. doi: 10.1124/mi.9.5.7. [DOI] [PMC free article] [PubMed] [Google Scholar]
- Trott O, Olson AJ. AutoDock Vina: Improving the speed and accuracy of docking with a new scoring function, efficient optimization, and multithreading. Journal of Computational Chemistry. 2010;31:455–461. doi: 10.1002/jcc.21334. [DOI] [PMC free article] [PubMed] [Google Scholar]
- Wang J, Wang W, Kollman PA, Case DA. Automatic atom type and bond type perception in molecular mechanical calculations. Journal of Molecular Graphics and Modelling. 2006;25:247–260. doi: 10.1016/j.jmgm.2005.12.005. [DOI] [PubMed] [Google Scholar]
- Wang J, Wolf RM, Caldwell JW, Kollman PA, Case DA. Development and testing of a general amber force field. Journal of Computational Chemistry. 2004;25:1157–1174. doi: 10.1002/jcc.20035. [DOI] [PubMed] [Google Scholar]
- Warne T, Serrano-Vega MJ, Baker JG, Moukhametzianov R, Edwards PC, Henderson R, Schertler GFX. Structure of a [bgr]1-adrenergic G-protein-coupled receptor. Nature. 2008;454:486–491. doi: 10.1038/nature07101. [DOI] [PMC free article] [PubMed] [Google Scholar]
- Wesson L, Eisenberg D. Atomic solvation parameters applied to molecular dynamics of proteins in solution. Protein Science. 1992;1:227–235. doi: 10.1002/pro.5560010204. [DOI] [PMC free article] [PubMed] [Google Scholar]
- Zsoldos Z, Reid D, Simon A, Sadjad BS, Johnson AP. eHiTS: An innovative approach to the docking and scoring function problems. Current Protein and Peptide Science. 2006;7:421–435. doi: 10.2174/138920306778559412. [DOI] [PubMed] [Google Scholar]