

Abstract
We sought to determine whether functional connectivity streams that link sensory, attentional, and higher‐order cognitive circuits are atypical in attention‐deficit/hyperactivity disorder (ADHD). We applied a graph‐theory method to the resting‐state functional magnetic resonance imaging data of 120 children with ADHD and 120 age‐matched typically developing children (TDC). Starting in unimodal primary cortex—visual, auditory, and somatosensory—we used stepwise functional connectivity to calculate functional connectivity paths at discrete numbers of relay stations (or link‐step distances). First, we characterized the functional connectivity streams that link sensory, attentional, and higher‐order cognitive circuits in TDC and found that systems do not reach the level of integration achieved by adults. Second, we searched for stepwise functional connectivity differences between children with ADHD and TDC. We found that, at the initial steps of sensory functional connectivity streams, patients display significant enhancements of connectivity degree within neighboring areas of primary cortex, while connectivity to attention‐regulatory areas is reduced. Third, at subsequent link‐step distances from primary sensory cortex, children with ADHD show decreased connectivity to executive processing areas and increased degree of connections to default mode regions. Fourth, in examining medication histories in children with ADHD, we found that children medicated with psychostimulants present functional connectivity streams with higher degree of connectivity to regions subserving attentional and executive processes compared to medication‐naïve children. We conclude that predominance of local sensory processing and lesser influx of information to attentional and executive regions may reduce the ability to organize and control the balance between external and internal sources of information in ADHD. Hum Brain Mapp 36:2544–2557, 2015. © 2015 Wiley Periodicals, Inc.
Keywords: attention‐deficit/hyperactivity disorder, resting‐state functional magnetic resonance imaging, ventral attention network, default mode network, sensorimotor network
INTRODUCTION
Attention‐deficit/hyperactivity disorder (ADHD) is common, with prevalence in school‐age children estimated at up to 9% [Visser et al., 2014]. Clinically, ADHD is a heterogeneous syndrome characterized by age‐inappropriate levels of inattention, motor hyperactivity, and impulsivity that interfere with social and academic functioning [American Psychiatric Association, 2013].
Classical neuropsychological theories of ADHD posit that symptoms arise from deficits in executive functions [Barkley, 1997] or reward‐processing brain systems [Sagvolden et al., 2005; Tripp and Alsop, 1999]. However, recent neurobiological formulations describe a more complex scenario, implicating brain systems that range from low‐level sensory–motor integration to high‐level cognitive association cortex [Castellanos and Proal, 2012; Posner et al., 2014]. Based on this perspective, ADHD may be considered to result from atypical deviations of the internal information‐processing pipeline at multiple brain levels, rather than affecting single circuits [Castellanos and Proal, 2012]. This conclusion is based on structural and functional connectivity studies comparing children with ADHD to typically developing children (TDC), which have demonstrated differences in multiple large‐scale brain systems in ADHD. For instance, using resting‐state functional magnetic resonance imaging (R‐fMRI), researchers have observed reduced functional connectivity in the default mode network [Castellanos et al., 2008; Fair et al., 2010] or atypical functional connectivity within visual [Cao et al., 2006; Wang et al., 2009], auditory [Tian et al., 2008], and somatosensory systems [An et al., 2013; Di Martino et al., 2013; Tian et al., 2008] in patients with ADHD. Aside from abnormalities within specific networks, R‐fMRI studies have also detected functional connectivity differences between brain circuits, such as task‐positive and task‐negative networks [Castellanos et al., 2008; Hoekzema et al., 2014; Sun et al., 2012]. Atypical functional connectivity within and between networks affecting sensory and higher‐order cognitive domains suggests that the typical hierarchical flow of information from sensation‐to‐cognition in the human connectome is likely compromised in ADHD.
Based on a network framework, the central aim of this study was to investigate functional connectivity streams from primary sensory cortex—visual, auditory and somatosensory—to higher brain systems in children and adolescents with ADHD. Following the suggestion that alterations in sensory circuits might result from dysfunctional regulation of sensory regions by attentional circuits [Castellanos and Proal, 2012], we hypothesized that subjects with ADHD will show alternative functional stream assemblies linking sensory and attentional control circuits. To test this hypothesis, we used a recently developed analysis technique called “stepwise functional connectivity” (SFC) applied to R‐fMRI data of TDC and children with ADHD to characterize functional paths that connect sensory cortex to other regions of the brain in a specific number of relay stations—known as link‐step distances [Sepulcre, 2014; Sepulcre et al., 2012]. As secondary aims, we explored the potential effects of medication status on SFC patterns by comparing medicated versus medication‐naïve ADHD samples.
MATERIALS AND METHODS
Study Participants and Selection of MRI Data
Table 1 shows the clinical‐demographic characteristics of the study sample. We used a subsample of the open source multisite R‐fMRI dataset deposited at http://fcon_1000.projects.nitrc.org/indi/adhd200/. When we downloaded the data for this study, the database contained clinical, phenotypic, and neuroimaging data from 853 children/adolescents (527 typically developing and 326 diagnosed with ADHD according to DSM‐IV‐TR criteria [American Psychiatric Association, 2013]). The original dataset was filtered to include only right‐handed (defined as Edinburgh Handedness Inventory ≥0.4 [Oldfield, 1971]) male participants with an estimated full‐scale IQ ≥80, with no history of neurological disease or head trauma and not meeting diagnostic criteria for any comorbid psychiatric disorder except for oppositional defiant disorder, learning disorder, or specific phobia. Since the DSM‐IV‐TR hyperactive‐impulsive subtype was under‐represented in the original release, we only included ADHD participants belonging to the combined or predominantly inattentive subtypes.
Table 1.
Clinical‐demographic characteristics of the sample
| TDC | ADHD | |||||
|---|---|---|---|---|---|---|
| Characteristic | N | Mean | SD | N | Mean | SD |
| ADHD subtype | ||||||
| Combined | 67 | |||||
| Inattentive | 53 | |||||
| Age (range 7–17) | 120 | 12.03 | 2.2 | 120 | 12.06 | 2.2 |
| Medication status | ||||||
| Medicated | NA | 31 | ||||
| Medication‐naïve | NA | 58 | ||||
| Comorbidity | ||||||
| LD | 0 | 7 | ||||
| LD, ODD | 0 | 7 | ||||
| LD, SP | 0 | 1 | ||||
| ODD | 0 | 18 | ||||
| SP | 2 | 2 | ||||
| IQ | ||||||
| Full scale | 120 | 114.31 | 13.5 | 120 | 106.8b | 13.7 |
| Verbal | 97 | 115.1 | 14.2 | 120 | 110.5a | 15.4 |
| Performance | 97 | 110.46 | 13.6 | 120 | 101.33b | 14.4 |
| ADHD score | ||||||
| ADHD‐RS | ||||||
| Total | 42 | 29.29 | 5.7 | 55 | 50.8b | 8.2 |
| H/I | 42 | 13.46 | 3.6 | 55 | 22.4b | 5.9 |
| Inat | 42 | 15.82 | 3.8 | 55 | 28.36b | 3.6 |
| ADHD‐CPRS‐LV | ||||||
| Total | 39 | 46.46 | 7.9 | 60 | 70b | 6.7 |
| H/I | 39 | 46.87 | 5.2 | 60 | 68.67b | 10.9 |
| Inat | 39 | 46.64 | 7.8 | 60 | 69.48b | 7.7 |
TDC, Typically developing children; ADHD, Attention‐deficit/hyperactivity disorder Sample; ODD, Oppositional Defiant Disorder; LD, Learning Disorder; SP, Specific Phobia; IQ, Estimated Intelligence Quotient; ADHD‐RS, ADHD Rating Scales–IV [DuPaul et al., 1998] H/I, Hyperactive/Impulsive symptoms subscale; Inat, Inattention Symptoms subscale; ADHD‐CPRS‐LV, Conners' parent Rating Scale‐Revised, Long version [Conners et al., 1998].
Significant between‐group differences based on 2‐sample t tests (P < 0.05).
Significant between‐group differences based on 2‐sample t tests (P < 0.001).
With respect to imaging acquisition parameters, we assured comparability of data density across individuals by including only the first 120 volumes for each participant and hence only included participants having an R‐fMRI sequence containing at least 120 time points. We then re‐estimated motion parameters and discarded subjects with a mean framewise displacement, as measured by mcflirt [Jenkinson et al., 2002], exceeding 0.5 mm. Finally, we selected a subsample of TDC that matched 1:1 each of the subjects with ADHD on age (maximum difference ±4 months) and mean framewise displacement (maximum difference ±0.1 mm). The final sample consisted of 120 right‐handed males with DSM‐IV‐TR diagnosis of ADHD (67 with combined subtype, 53 with inattentive subtype, 31 with history of psychostimulant medication treatment, 58 who were medication‐naïve, and 31 with unknown medication status) individually matched by age and framewise displacement with 120 right‐handed male TDC (age range 7–17 years old; framewise displacement range 0.02–0.45 mm). The medicated group did not differ in framewise displacement from the medication‐naïve group (mean [sd]: medicated= 0.071 mm [0.062], medication‐naïve= 0.067 mm [0.042]; P = 0.75) the group with inattentive subtype did not differ from its age‐matched TDC group (mean [sd]: inattentive = 0.063 mm [0.06], age‐matched TDC = 0.055 mm [0.026]; P = 0.33) nor did the combined subtype group differ from its age‐matched TDC group (mean [sd]: combined= 0.07 mm [0.043], age‐matched TDC = 0.069 mm [0.055]; P = 0.86). Furthermore, there were no significant between‐group differences in the number of volumes with movement exceeding 0.1 mm (all P > 0.35) or 0.5 mm (all P > 0.37).
As data for this investigation were aggregated retrospectively, ADHD diagnostic criteria and MRI acquisitions protocols varied across institutions. Detailed information about institution‐specific procedures is provided in Supporting Information 1A. The identification codes of included participants, which correspond to their publically available images, are provided in Supporting Information 1B. For reference purposes, Figure 2 includes a previously characterized sample of adults (N = 100; mean age = 21.3 (3.5); 37% male) [Sepulcre et al., 2012]. Informed written consent and assent were obtained from all participants, and procedures complied with the Institutional Review Boards at respective centers. Of note, although our study sample includes both children and adolescents, we use the term children henceforth to refer to both, for brevity.
Figure 2.
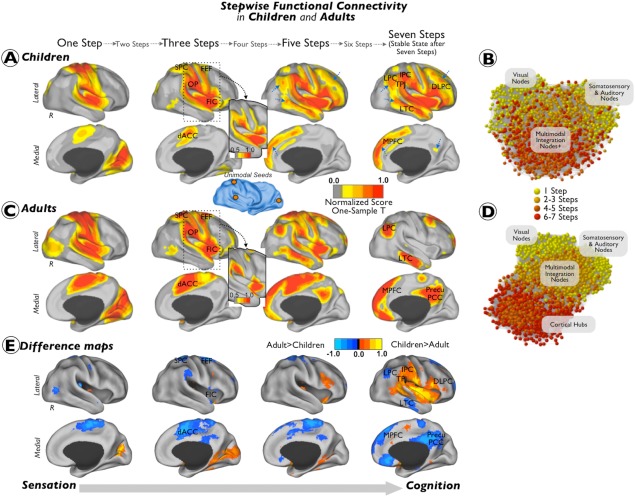
Combined SFC maps in children and adults. Combined SFC maps of typically developing children (A and B) and neurotypical adults (C and D). Results are depicted in surface space (A and B) and in network topological space (C and D). Section E of the figure displays the difference between the children and the adult z‐scores maps (children maps minus adult maps). Results from the one‐sample t‐tests were displayed using a Caret normalized color scale from 0 to 1, where 0 is the t intensity value corresponding to an experimentwise alpha level of P < 0.0001 after cluster extent correction and 1 is the maximum t intensity value of the image corresponding to the smallest P‐value. Insets show the cortical maps with a more restrictive visualization threshold. Blue arrows point to regions where the degree of connectivity in the children/adolescents sample is reduced as visually compared to the adult sample. Graphs show the functional connectivity networks of children and adults using a K–K energy layout. Nodes are colored using a yellow to red scale, where yellow correspond to initial link‐steps and red to terminal link steps. The label for the nodes is based on the distribution coordinates extracted from Sepulcre et al. [2012]. The difference maps (section E) were displayed using a Caret normalized color scale from 0 to 1, where 0 is the intensity value corresponding to differences below 1 standard deviation and 1 is the maximum intensity value of the image corresponding to the greatest difference between the groups. Abbreviations: R = right hemisphere; FIC = frontoinsular cortex; dACC = dorsal anterior cingulate cortex; OP = operculum parietale; SPC = superior parietal cortex; FEF = frontal eye field; MPFC = medial prefrontal cortex; LTC = lateral temporal cortex; TPJ = temporo‐parietal junction; DLPFC = dorsolateral prefrontal cortex; LPC = lateral parietal cortex; IPC = inferior parietal cortex; Precu/PCC = precuneus/posterior cingulate cortex. [Color figure can be viewed in the online issue, which is available at http://wileyonlinelibrary.com.]
Image Processing
Participants included in the study were scanned on five different 3.0 Tesla scanners using standard R‐fMRI T2*‐weighted echo‐planar imaging (see Supporting Information 1A for detailed acquisition parameter information of TDC, children with ADHD and adult samples). Functional resting‐state images were preprocessed using AFNI (http://afni.nimh.nih.gov/afni) and FSL (http://fsl.fmrib.ox.ac.uk/fsl/fslwiki) running on the Athena computer cluster at the Virginia Tech ARC (http://www.arc.vt.edu/). Broadly, preprocessing steps included removal of the first four volumes to allow for T2‐equilibration, slice timing correction, motion correction, normalization to MNI152 standard space at 4 mm isotropic voxel resolution, regression of nuisance covariates including head motion parameters, global mean, white matter, and cerebrospinal fluid signals, band‐pass filtering the time‐series data (0.009 Hz < f < 0.08 Hz) to reduce low‐frequency drift and high‐frequency physiological noise, and spatial smoothing with a 6 mm full‐width‐at‐half‐maximum Gaussian kernel. For further preprocessing details, see http://www.nitrc.org/plugins/mwiki/index.php/neurobureau:AthenaPipeline. Beyond standard preprocessing, we down‐sampled the preprocessed R‐fMRI data to 8 mm isotropic voxels to reduce computational demands [Sepulcre et al., 2012].
SFC Analysis
SFC analysis is a graph‐theory‐based method that detects both direct and indirect functional couplings of a given seed region to other regions in the brain. It complements conventional seed‐based functional connectivity approaches by allowing voxel‐level functional connections to be assessed at a range of intermediate relay stations. The method is described in detail elsewhere [Sepulcre, 2014; Sepulcre et al., 2012] and schematically represented in Figure 1. Briefly, we computed the Pearson correlation coefficient R between all voxels of the normalized brain of each individual. Only positive correlations were retained in this step due to the ambiguous interpretation of negative correlations [Murphy et al., 2009; Van Dijk et al., 2010]. We then applied a false discovery rate correction (q < 0.001) to the associated P values of the correlation matrix to limit the rate of false‐positive associations. Next, we binarized each subject's connectivity matrix to obtain undirected and unweighted matrices. Finally, we used these matrices to compute the degree of SFC of specific sensory‐related seed regions—visual, auditory, and somatosensory. The degree of SFC of a given voxel of the brain is defined as the number of functional paths connecting that voxel with an a priori selected seed region at a specific link‐step distance (Fig. 1). A link‐step distance is defined as the number of edges that pertain to a path connecting a given voxel to the seed area. Therefore, the degree of stepwise connectivity of a voxel j for a given step distance l and a seed area i (Djil) is computed from the count of all paths that:
connect voxel j and any voxel in seed area i, and
have an exact length of l (see example in Fig. 1).
Figure 1.
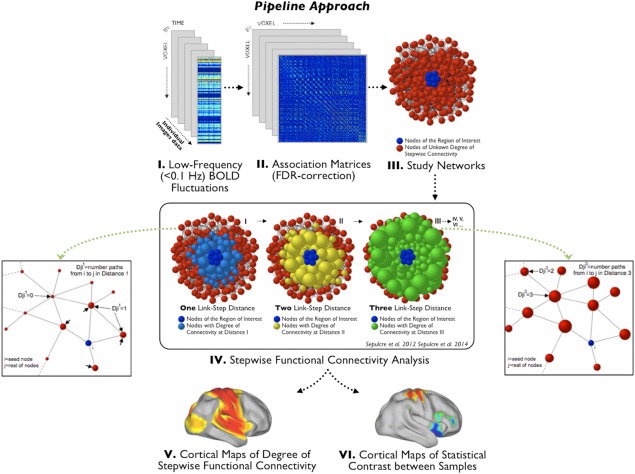
The stepwise functional connectivity (SFC) analysis. Figure adapted from Sepulcre et al. [2012], and Sepulcre [2014] describing the SFC analysis. The preprocessed resting‐state functional magnetic resonance image data (I) is used to calculate the whole connectivity association matrix of the individual brains (II) and then, based on this matrix, create the subjects's binary connecitivity matrix (III). The binary connectivity matrix is the input to compute the degree of SFC. The squared parts of the figure illustrate, in a hypothetical network, how the SFC method calculates, for all the voxels of the brain, the number of functional paths (degree of connectivity) connecting that voxel to any of the voxels within the region of interest or seed region (dark blue nodes) at consecutive link‐step distances. Node size, which represents the degree of connectivity of the voxel, was rescaled for each link‐step distance. Once the SFC maps are calculated for each individual, we perform the pertinent statistical analysis to characterize the pattern of network transitions in a given population (V) and calculate statistical contrast images to compare samples (VI). For further details about the method see Sepulcre et al. [2012] and Sepulcre [2014]. (Reproduced with permission from Elsevier, Integration of visual and motor functional streams in the human brain, Neuroscience Letters (2014), 567: 68–73.) [Color figure can be viewed in the online issue, which is available at http://wileyonlinelibrary.com.]
The SFC values were standardized at each link step to normalize the effect of the escalating probability of connections with the seeds when the number of steps increases. In order to obtain SFC values which are independent of the link step, Z standardized SFC values were calculated by subtracting the whole brain mean of the SFC map and dividing by its standard deviation. Therefore, each map represents the relative increase of the degree of connectivity across the different link‐step distances.
The three sensory seed regions were adapted from the study of Sepulcre et al. [2012] to match the image dimensions of our data. Specifically, seeds were defined as cubic regions of eight voxels each, with reference MNI coordinates (x, y, z) for the more lateral, anterior, and superior voxels (8, −76, 10) for the visual seed, (56, −12, 10) for the auditory seed, and (0, −28, 66) for the somatosensory seed. Since we are interested in investigating how sensory information is differentially propagated in ADHD, without a specific hypothesis about which sensory modality may be compromised, we used two complementary approaches: (1) a method known as combined SFC that computes the degree of SFC to the three main sensory cortical areas—visual, auditory, and somatosensory—simultaneously, to obtain a combined map of all sensory functional streams [Sepulcre et al., 2012]; and (2) the SFC method that computes the SFC maps of the sensory modalities separately [Sepulcre et al., 2012]. For simplicity, we show the combined SFC findings in the main text (Figs. 2, 3, 4, 5), but results for each individual sensory modality are shown in Supporting Information Figure 3. Moreover, the functional pathways “collapse” into the cortical hubs of the adult human brain after a large number of relay stations [Buckner et al., 2009; Sepulcre et al., 2010]. Accordingly, we constrained our SFC analysis to seven link‐step distances, the optimal number to fully explore the whole range of functional pathways in the adult human functional connectome [Sepulcre et al., 2012]. Additionally, we confirmed that our study samples of children and adults reached a connectional stable state in seven link‐step distances. In summary, for each participant, we obtained seven degrees of SFC maps for the combined approach and for each individual sensory seed.
Figure 3.
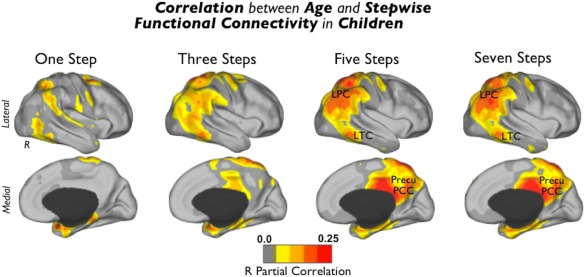
Correlation between age and SFC in TDC. Regions where the degree of connectivity is positively associated with age in typically developing children. Images were displayed using the partial correlation R values (http://dbm.neuro.uni-jena.de/vbm/threshold-and-transform-spmt-maps/). Abbreviations: R = right hemisphere; LPC = lateral parietal cortex; LTC = lateral temporal cortex; and Precu/PCC = precuneus/posterior cingulate cortex. [Color figure can be viewed in the online issue, which is available at http://wileyonlinelibrary.com.]
Figure 4.
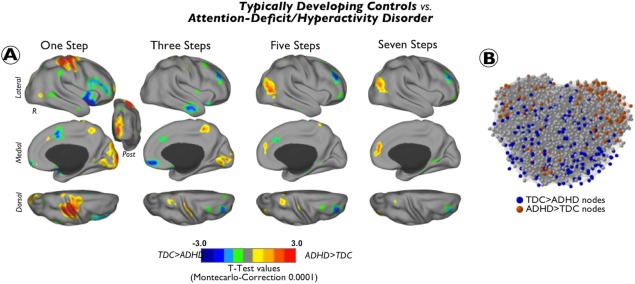
Differences between ADHD and TDC groups in the degree of connectivity at different link‐step distances. Cortical maps of significant differences in the degree of stepwise connectivity between subjects with attention‐deficit/hyperactivity disorder (ADHD) and typically developing children (TDC) at different link‐step distances along the sensation to cognition continuum. Results are depicted in surface space (A) and in network topological space (B). Cool colors indicate regions where ADHD subjects have reduced degree of connectivity compared to TDC and warm colors indicate regions where ADHD subjects show increased degree of connectivity compared to TDC. To aid visualization, each image was displayed using a Caret normalized color scale from 0 to 1, where 0 is the t intensity value corresponding to an experimentwise alpha level of P < 0.0001 after cluster extent correction and 1 is the maximum t intensity value of the image corresponding to the smallest P value. Graphs show the network location of nodes displaying statistically significant differences between TDC and children with ADHD. We use as a graph template the TDC graph from Figure 2. Nodes are colored using a results of cortical maps in A (blue: TDC > ADHD; red: ADHD > TDC). [Color figure can be viewed in the online issue, which is available at http://wileyonlinelibrary.com.]
Figure 5.
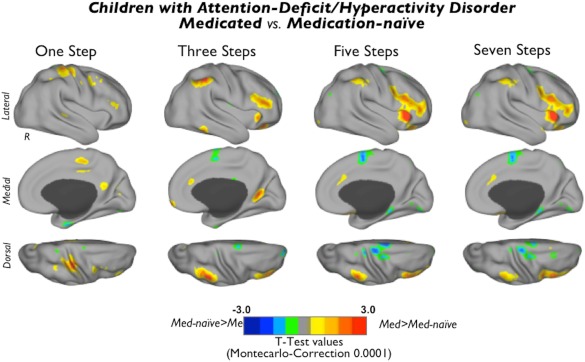
Differences between medicated subjects with ADHD and medication‐naïve subjects with ADHD in degree of connectivity at different link‐step distances. Cortical maps of significant differences in the degree of stepwise connectivity between medicated and medication‐naïve subjects with ADHD at different link‐step distances of the sensation to cognition continuum. Cool colors indicate regions where medication‐naïve subjects (Med‐naïve) have increased degree of connectivity compared to medicated subjects (Med) and warm colors indicate regions where medicated subjects show increased degree of connectivity compared to medication‐naïve subjects. To aid visualization, each image was displayed using a Caret normalized color scale from 0 to 1, where 0 is the t intensity value corresponding to an experimentwise alpha level of P < 0.0001 after cluster extent correction and 1 is the maximum t intensity value of the image corresponding to the smallest P value. [Color figure can be viewed in the online issue, which is available at http://wileyonlinelibrary.com.]
Statistical Analysis
Characterizing TDC
We applied a one‐sample t‐test to each cortical map to properly visualize the typical patterns of SFC in the TDC and neurotypical adult samples and to detect potential differences between the samples (Fig. 2A; controlling for head movement and the use of different scanners using SPM8 http://www.fil.ion.ucl.ac.uk/spm). We also performed a regression analysis between SFC cortical maps and age to investigate potential maturation patterns in the TDC sample (Fig. 3; controlling for scanner and head movement).
As supplementary analysis, we also applied the same one‐sample t‐tests to the maps of the ADHD sample (scanner and head movement were introduced as nuisance regressors). Supporting Information Figure 1 displays the ADHD and TDC together for visualization purposes.
Group comparisons
Differences between TDC and children with ADHD in SFC degree from primary sensory regions – whether combined or separately for each seed—were calculated by performing an analysis of covariance (ANCOVA; SPM8), with scanner type and mean head movement as nuisance covariates, for each of the seven link‐step distance maps, separately. Although our samples of TDC and ADHD did not differ significantly in MRI framewise displacement (see Study Participants and Selection of MRI Data section), we also controlled for head movement in the group comparisons tests using the individual mean framewise displacement as an additional precaution [Van Dijk et al., 2010; Yan et al., 2013]. To estimate the potential effects of medication history, we performed an ANCOVA for each of the link‐step distance maps comparing the medicated ADHD sample against the medication‐naïve ADHD sample, again controlling for scanner, mean framewise displacement, and age. As supplementary analyses, we repeated the ANCOVAs (regressing out the effect of scanner and mean framewise displacement) to compare: (1) the combined ADHD subtype sample and its age‐matched TDC sample; and (2) the inattentive ADHD subtype sample and its age‐matched TDC sample.
For group effects, we used Monte‐Carlo simulation based on cluster size (http://www2.bc.edu/~slotnics/scripts.htm [accessed May 6, 2011]) to correct for multiple comparisons. Since the majority of our data comes from the Peking dataset, we entered Peking's R‐fMRI acquisition parameters as input to the Monte‐Carlo simulation. Only clusters exceeding 1,024 mm3 at the voxelwise threshold of P < 0.05, resulting in a corrected experiment‐wise alpha level of P < 0.0001, are reported.
Cortical and Network Visualization
Volume maps from the statistical analysis were projected onto the right and left cerebral hemispheres of the PALS surface (PALS‐B12) provided with Caret software using the “interpolated algorithm” and “multifiducial mapping” settings [Van Essen and Dierker, 2007]. In the main figures of the text, we only present the surface projections of the right hemisphere of odd link‐step maps (one, three, five, and seven) to avoid redundancy between consecutive SFC maps. For presentation of left and right hemispheres and maps of all link‐steps, see Supporting Information Figure 2. For network graph displays, we used Pajek software [Nooy et al., 2005] and the Kamada and Kawai (K–K) energy layout algorithm [Kamada and Kawai, 1989]. The K–K algorithm is a force layout method based on a network energy minimization procedure that takes into account the differences between geometric and pairwise shortest‐path distances of nodes in the graph.
RESULTS
SFC Maps in TDC and Normal Adults
Figure 2 illustrates the combined sensory SFC maps for TDC (Fig. 2A,B) and neurotypical adults (Fig. 2C,D) and a difference map between the two groups (Fig. 2E). Overall, we observe that children and adults use similar connectivity pathways at early link‐step distances (Fig. 2A,C). Specifically, we found that both groups display a net stepwise connectivity of primary sensory areas to dorsal regions, such as dorsal anterior cingulate cortex, superior parietal cortex, and frontal eye fields, and ventral regions, such as operculum parietale and frontoinsular cortex (Fig. 2A,C). However, the sensory functional streams of children and adults diverge substantially at large link‐step distances. Primary sensory streams of TDC, regardless of the number of relay stations, remain strongly connected to operculum parietale and frontoinsular cortex, with only slight connectivity to regions of the higher‐order cognitive circuits such as the dorsolateral prefrontal, inferior lateral parietal cortex, medial prefrontal cortex, or the lateral temporal cortex (blue arrows in Fig. 2A). By contrast, primary sensory streams of neurotypical adults connect to lateral parietal cortex, medial prefrontal cortex, the lateral temporal cortex, and precuneus/posterior cingulate cortex of the brain at large link‐step distances (Fig. 2C). Especially notable is the difference between TDC and adults in stepwise connectivity to higher‐order cognitive circuits, with the most evident “missing” area the precuneus/posterior cingulate cortex (blue arrow in Fig. 2A,E). As depicted in the network graphs, adults display an interface of interconnector nodes (“2–5 steps” nodes; multimodal integration nodes in Fig. 2D) that integrate connectivity from unisensory regions (“1 step” nodes; visual, auditory and somatosensory nodes in Fig. 2D) and cortical hubs of the cerebral network (“6–7 steps” nodes; cortical hubs in Fig. 2D). However, unimodal, multimodal integration, and cortical hub nodes are less differentiated in TDC (Fig. 2B). Indeed, although nodes interface sensory‐related areas (“2–5 steps” nodes; multimodal integration nodes in Fig. 2B), we did not find, for instance, a distinguishable cortical hub module in TDC as in adults (Fig. 2B,D). A regression analysis in Fig. 3 illustrates that functional connectivity streams of sensory cortex correlate positively at large link‐step distances with age in areas such as lateral parietal cortex, lateral temporal cortex, and precuneus/posterior cingulate cortex in TDC (Fig. 3).
Differences in SFC Maps Between TDC and Children with ADHD
In contrast to mature adult brains (Fig. 2C), SFC maps obtained in the sample of children with ADHD show analogous topological cortical distribution to those from TDC (Supporting Information Figs. 1 and 2A). However, detailed statistical group comparisons between them reveal significant differences (Fig. 4). At one and two link‐step distances from primary sensory seeds, subjects with ADHD showed increased degree of connectivity in somatomotor (postcentral, precentral, and supplementary motor area) and visual (cuneus and middle occipital gyrus) cortex. When functional pathways with 5–7 relay stations were analyzed, we found that ADHD children present a higher degree of connectivity in the lateral‐superior part of the occipital cortex and medial prefrontal cortex than TDC (Fig. 4A; warm colors). With regard to the opposite contrast (TDC > ADHD), the ADHD group exhibited a decreased degree of connectivity at initial link‐step distances in anterior insula extending toward inferior frontal gyrus, as well as in dorsal anterior cingulate cortex. At intermediate link‐step distances, we found significantly lower degree of SFC in patients with ADHD in orbitofrontal cortex and lateral temporal cortex. Across 2–7 link‐steps, we detected a reduced degree of SFC in the dorsolateral prefrontal cortex and the left inferior parietal cortex (Fig. 4A and Supporting Information Fig. 2; cool colors). Network graphs in Figure 4B show the corresponding node locations of cortical areas displaying statistically significant changes. In addition, Supporting Information Figure 2 shows all cortical maps from one to seven link‐step distances projected onto both cerebral hemispheres. Supporting Information Figure 3 shows the individual SFC analyses for the visual, auditory, and somatosensory seeds. Although some of the individual analyses of sensory areas differ, particularly at initial functional connectivity steps, the main results match those obtained with the combined SFC approach. Results from subtype comparisons are presented in Supporting Information Tables 1 and II. Aside specific subtype alterations, we found that, consistent with our main results, both, inattentive and combined subtype children present increased degree of connectivity in the primary sensory cortex (one and two link‐step distances), reduced degree of connectivity in the inferior frontal and anterior insular cortex (one and two link‐step distances) and reduced degree of connectivity in regions of the dorsolateral prefrontal cortex (four and five link‐step distances). The analysis also revealed that the reduced degree of connectivity in the anterior cingulate and inferior parietal cortex at initial and intermediate link‐step distances is more prominent in the inattentive subtype than in the combined subtype, whereas the increased degree of connectivity in the occipital cortex at terminal link‐step distances is more evident in the combined than in the inattentive subtype. Interestingly, we also found that whereas the degree of connectivity of the medial prefrontal cortex at initial link‐step distances (one, two, and three) was increased in children with inattentive subtype, it was decreased in children with combined subtype.
Medicated Versus Medication‐Naïve Children with ADHD
Compared to medication‐naïve patients, medicated children showed a higher degree of SFC in a small area of the somatosensory cortex at one link‐step distance and the parieto‐occipital sulcus at three link‐step distances. After three link‐step distances, medicated children showed a higher degree of SFC in the inferior parietal cortex and the anterior insular cortex extending toward the inferior frontal gyrus and the ventrolateral prefrontal cortex (Fig. 5; warm colors). In addition, we detected a decreased degree of SFC in the supplementary motor area and the visual cortex in medicated subjects compared to medication‐naïve subjects—all of these differences taking place at 3–7 link‐step distances (Fig. 5; cool colors).
DISCUSSION
Brain connectivity analysis can reveal atypical network organization in neurodevelopmental conditions. Here, we characterized functional connectivity streams linking primary sensory and higher‐order brain cognitive circuits in TDC and children with ADHD. We selected ADHD because the broad range of associated symptoms has been linked to hypothesized abnormal integration of distributed brain regions [Castellanos and Proal, 2012]. Our findings support that view and provide a detailed description of the differential functional connectivity streams found in children with ADHD.
Sensory Functional Streams and Cortical Integration in TDC
Maturation of brain networks entails progressing from local to distributed connectivity organization [Fair et al., 2009]. With increasing age and cognitive maturation, functional networks undergo processes of segregation and integration to arrive at adult levels of organization [de Bie et al., 2012; Fair et al., 2009; Rubia, 2013; Supekar et al., 2009]. Whereas primary sensory–motor regions seem to attain brain maturation in early childhood, networks supporting higher‐order cognitive abilities, such as the default mode network (DMN) and the frontoparietal network, seem to mature later [de Bie et al., 2012; Hoff et al., 2013]. In our study, we found a positive association between age and functional connectivity of modal streams reaching the DMN and cortical hubs. Not surprisingly, some of these areas, such as the precuneus, have been previously identified as predictors of brain connectivity maturity [Dosenbach et al., 2010]. In prior work, we found that neurotypical adults display functional connectivity streams that can be traced from primary sensory circuits to multimodal/attentional networks and to cortical hubs [Sepulcre et al., 2012]. By contrast, TDC maps show certain features that are compatible with brain functional immaturity. For instance, they show a dominant core of connections among multimodal integration areas, such as frontoinsular and operculum parietale regions, with little connectivity to cortical hub regions. In other words, functional connectivity streams of TDC do not reach the full level of integration among multiple cognitive systems achieved by adults. Instead, TDC functional pathways remain strongly connected inside multimodal/attentional areas without evidence of additional stepwise linkages. The frontoinsular cortex can regulate nodes of different cognitive circuits by activating either the frontoparietal executive or default mode systems [Sridharan et al., 2008]. Interestingly, weaker decoupling of the frontoinsular region has been observed in TDC compared to adults [Supekar and Menon, 2012]. Therefore, if we take in to consideration that (1) frontoinsular and multimodal integration areas are over‐interconnected in children, whereas (2) connectivity to cortical hubs is diminished—probably due to maturity‐related factors—then, alterations in the connectional mechanisms subserving regulatory functions of the frontoinsular system of children are plausible.
Sensory and Motor Connectivity are Locally Increased in ADHD Children
Sensory and motor circuits have been increasingly implicated in the pathophysiology of ADHD in recent years [Proal et al., 2011; Valera et al., 2010]. Previous studies using intrinsic functional connectivity analysis have reported high regional homogeneity and network centrality in visual [Cao et al., 2006; Wang et al., 2009] and somatomotor cortex [An et al., 2013; Di Martino et al., 2013; Tian et al., 2008] in subjects with ADHD. Part of our results involves similar findings. We find that ADHD is associated with increased number of functional connections linking primary cortex with surrounding areas. An intensification of primary connectivity at the local level may generate delays in the perceptual pipeline and information transmission to subsequent systems. Nevertheless, it is unlikely that connectivity changes at the neighboring level of sensory, motor, and visual systems explain by themselves all the diverse behavioral features observed in ADHD. We believe that these local connectivity changes must be interpreted together with other changes along the functional processing streams to provide a fuller description of the sensation‐to‐cognition continuum in ADHD.
From Sensory to Attentional and Executive Systems in Children with ADHD
We have noted that TDC and adults differ in functional connectivity streams, likely as a consequence of brain immaturity in the former. We have also observed that functional pathways of ADHD children resemble those of TDC in terms of qualitative cortical distribution. However, children with ADHD manifest striking functional connectivity stream differences at the quantitative level compared to TDC. The ADHD sample showed a significant reduction of degree of connectivity in the frontoinsular cortex and the dorsal anterior cingulate cortex. These regions are key nodes of to the ventral attention system [Yeo et al., 2011], also referred to as salience network [Menon, 2011], a system that also subserves multimodal integration in the human brain [Sepulcre et al., 2012]. The ventral attention system is a task‐positive network that closely interacts with the dorsal attention system to enable attentional control in relation to top‐down goals and bottom‐up sensory stimulation [Vossel et al., 2014]. In particular, the ventral attention system has been associated with detecting stimulus relevance and initiating cognitive control by dynamically switching dominance between the frontoparietal executive network and the DMN [Sridharan et al., 2008]. In the past, ADHD‐related abnormalities in the frontoinsular and the dorsal anterior cingulate cortex have been extensively reported in the literature (see Bush [2010], for a review). Furthermore, a meta‐analysis of task‐based functional MRI studies found that 44% of the voxels that are hypoactive in children with ADHD during cognitive task performance correspond to the ventral attention network [Cortese et al., 2012]. However, alterations in the frontoinsular and the dorsal anterior cingulate cortex have been conventionally interpreted as an indication of executive control deficits in ADHD and the specific role of the ventral attention system in ADHD has been rarely explored.
Based on our findings, we speculate that combined observations of locally over‐connected sensory systems, as well as under‐connected multimodal integration and attentional control systems along the functional streams may underlie the tendency to continuously interact with the environment and to have difficulty favoring relevant over irrelevant stimuli which characterize individuals with ADHD.
A frontoparietal system includes the dorsolateral prefrontal cortex and the inferior parietal sulcus. This task‐positive network is critically involved in keeping on‐line working memory representations necessary for problem solving, decision‐making, and other goal‐directed and executive processes [D'Ardenne et al., 2012]. In line with the classical interpretation of ADHD as an executive function disorder [Barkley, 1997], the frontoparietal executive system has been found hypoactive in ADHD during the performance of cognitive tasks [Cortese et al., 2012]. Although we believe the executive disorder hypothesis is too constrained to fit the varied cognitive deficits in ADHD [Rhodes et al., 2005], it also finds some support in our data. Our results show that the dorsolateral prefrontal cortex is profoundly under‐connected in the final steps of the modal connectivity streams in ADHD compared to TDC. The dorsolateral prefrontal cortex is not the only significant change occurring when modal streams connect to areas with a large number of relay stations across the connectome. The lateral‐superior occipital cortex and the anteromedial PFC also belong to this group, but in a totally opposite sense. They display a high degree of connectivity in ADHD. Therefore, the scenario is more complex than expected. Although some executive‐related regions have decreased functional connectivity, other regions show connectivity enhancements. If we interpret these results from a network information flow viewpoint, we can postulate, on one hand, that the decreased stepwise connectivity to executive areas might reduce probabilities of information transitioning from perceptual circuits to networks involved in guiding cognitive execution processes. On the other hand, the increased connectivity areas may reflect an allocation of information toward alternative processing systems, such as default mode and advanced visual areas, instead of to frontoparietal executive modules. This interpretation is consistent with the “default‐mode network interference hypothesis” [Sonuga‐Barke and Castellanos, 2007].
Regarding medication effects, we found that medicated subjects, compared with medication‐naïve subjects, differ significantly in functional connectivity organization. Medicated ADHD children exhibit more “routes” that functionally connect primary sensory regions to circuits involved in goal‐directed executive processing and to salience circuits in charge of detecting stimulus salience and switching dominance between default mode network and frontoparietal executive network. These results fit with previous reports on the effects of ADHD medication on executive processing circuits [Cubillo et al., 2013] and network regulation [Peterson et al., 2009].
Maturational‐Lag in Children with ADHD
The concept of a maturational‐lag as an underlying cause of ADHD was proposed since its earliest descriptions [Kinsbourne, 1973]. Longitudinal MRI studies have detected immature cortical characteristics in ADHD [Shaw et al., 2006, 2007, 2009a, 2012] that appear to be modulated by exposure to stimulant medication [Shaw et al., 2009b]. Recently, R‐fMRI studies also found evidence of immature functional connectivity in ADHD. For instance, researchers found that the functional connectivity within DMN [Sripada et al., 2014] and between the DMN and the ventral attention [Sato et al., 2012; Sripada et al., 2014] and frontoparietal networks [Sripada et al., 2014], is significantly lagged in ADHD. In addition, there are also reports supporting aberrant developmental trajectories in the functional connectivity within the DMN and between the sensorimotor network and the ventral attention networks [Choi et al., 2013].
Our findings indicate that ADHD functional network transitions are characterized by increased degree of stepwise connectivity in sensory and motor circuits, known to mature in early childhood [Hoff et al., 2013] and reduced degree of connectivity in ventral attention and frontoparietal networks, which are subject to protracted development [Hoff et al., 2013]. In a sense, the results reported here suggest an immature state of functional networks transitions in ADHD that appears to be partially compensated by pharmacological treatment. However, we also found that ADHD has increased functional connectivity pathways toward medial prefrontal regions of the DMN that is known to attain functional maturation at late adolescence. Therefore, it might be imprecise that the ADHD immaturity features can be fully explained by a regular but delayed maturation trajectory. Longitudinal or cross‐sectional designs that enable the assessment of maturational courses controlling for phenotypical features, such as age, symptom remission/persistence, and exposure to stimulant treatment, are necessary to draw conclusions about whether the observed alterations and drug effects reflect delayed brain development, atypical brain development or a combination of the two.
LIMITATIONS
The limitations of this study mainly concern the nature of the sample, which was aggregated from different sites and scanners, with different image acquisition parameters and different clinical measures of ADHD symptoms severity. A variable of site, which combines effects of scanner, associated imaging parameters, and other intersite differences, was entered as a nuisance covariate in our analyses. Still, future work with a more homogeneous sample will improve the internal validity of findings, while perhaps being less representative. Finally, because of computational demands, we down‐sampled to relatively coarse‐sized voxels (8‐mm isotropic). Thus, high‐resolution boundaries of our results must be examined at smaller voxel‐sizes in future work.
CONCLUSION
In conclusion, we used a graph theory and data‐driven approach in children with ADHD and TDC to assess functional connectivity streams from sensation to cognition. At early steps, we found that functional streams of ADHD subjects exhibit local connectivity enhancements in sensory processing areas, accompanied by reduced number of connections to salience and executive control systems. At subsequent steps, functional streams of ADHD subjects show high connectivity to default mode and advanced visual processing systems. In summary, we observed connectional fingerprints that may explain how information flows are differentially propagated in the ADHD brain. If replicated, these novel results will extend and concretize models of ADHD pathophysiology.
Supporting information
Supplementary Information
Supplementary Information Figure 1.
Supplementary Information Figure 2.
Supplementary Information Figure 3.
Supplementary Information Tables.
ACKNOWLEDGMENTS
The authors thank the ADHD‐200 Consortium (http://fcon_1000.projects.nitrc.org/indi/adhd200/) and the Neuroimaging Informatics Tools and Resources Clearinghouse (http://www.NITRC.org) for collecting, organizing and hosting the data used in this study. The authors also thank Yasser Aleman and Joost Jansen from the Instituto de Investigación Sanitaria Gregorio Marañón, Madrid, Spain, for their helpful discussions and suggestions on the manuscript. Last, the authors acknowledge the children and parents who generously contributed to this research. The authors do not have conflicts of interest to declare.
REFERENCES
- American Psychiatric Association A (2000): Diagnostic and Statistical Manual of Mental Disorders, (4th ed., text rev.) Washington DC: American Psychiatric Association. [Google Scholar]
- American Psychiatric Association A (2013): Diagnostic and Statistical Manual of Mental Disorders. 5th ed Washington DC: American Psychiatric Association. [Google Scholar]
- An L, Cao XH, Cao QJ, Sun L, Yang L, Zou QH, Katya R, Zang YF, Wang YF (2013): Methylphenidate normalizes resting‐state brain dysfunction in boys with attention deficit hyperactivity disorder. Neuropsychopharmacology 38:1287–1295. [DOI] [PMC free article] [PubMed] [Google Scholar]
- Barkley RA (1997): Behavioral inhibition, sustained attention, and executive functions: Constructing a unifying theory of ADHD. Psychol Bull 121:65–94. [DOI] [PubMed] [Google Scholar]
- Buckner RL, Sepulcre J, Talukdar T, Krienen FM, Liu H, Hedden T, Andrews‐Hanna JR, Sperling RA, Johnson KA (2009): Cortical hubs revealed by intrinsic functional connectivity: Mapping, assessment of stability, and relation to Alzheimer's disease. J Neurosci 29:1860–1873. [DOI] [PMC free article] [PubMed] [Google Scholar]
- Bush G (2010): Attention‐deficit/hyperactivity disorder and attention networks. Neuropsychopharmacology 35:278–300. [DOI] [PMC free article] [PubMed] [Google Scholar]
- Cao Q, Zang Y, Sun L, Sui M, Long X, Zou Q, Wang Y (2006): Abnormal neural activity in children with attention deficit hyperactivity disorder: A resting‐state functional magnetic resonance imaging study. Neuroreport 17:1033–1036. [DOI] [PubMed] [Google Scholar]
- Castellanos FX, Proal E (2012): Large‐scale brain systems in ADHD: Beyond the prefrontal‐striatal model. Trends Cogn Sci 16:17–26. [DOI] [PMC free article] [PubMed] [Google Scholar]
- Castellanos FX, Margulies DS, Kelly C, Uddin LQ, Ghaffari M, Kirsch A, Shaw D, Shehzad Z, Di Martino A, Biswal B, Sonuga‐Barke EJ, Rotrosen J, Adler LA, Milham MP (2008): Cingulate‐precuneus interactions: A new locus of dysfunction in adult attention‐deficit/hyperactivity disorder. Biol Psychiatry 63:332–337. [DOI] [PMC free article] [PubMed] [Google Scholar]
- Choi J, Jeong B, Lee SW, Go HJ (2013): Aberrant development of functional connectivity among resting state‐related functional networks in medication‐naive ADHD children. PLoS One 8:e83516. [DOI] [PMC free article] [PubMed] [Google Scholar]
- Conners CK, Sitarenios G, Parker JD, Epstein JN (1998): The revised Conners' Parent Rating Scale (CPRS‐R): factor structure, reliability, and criterion validity. J Abnorm Child Psychol 26:257–268. [DOI] [PubMed] [Google Scholar]
- Cortese S, Kelly C, Chabernaud C, Proal E, Di Martino A, Milham MP, Castellanos FX (2012): Toward systems neuroscience of ADHD: A meta‐analysis of 55 fMRI studies. Am J Psychiatry 169:1038–1055. [DOI] [PMC free article] [PubMed] [Google Scholar]
- Cubillo A, Smith AB, Barrett N, Giampietro V, Brammer M, Simmons A, Rubia K (2013): Drug‐specific laterality effects on frontal lobe activation of atomoxetine and methylphenidate in attention deficit hyperactivity disorder boys during working memory. Psychol Med:1–14. [DOI] [PubMed] [Google Scholar]
- D'Ardenne K, Eshel N, Luka J, Lenartowicz A, Nystrom LE, Cohen JD (2012): Role of prefrontal cortex and the midbrain dopamine system in working memory updating. Proc Natl Acad Sci USA 109:19900–19909. [DOI] [PMC free article] [PubMed] [Google Scholar]
- de Bie HM, Boersma M, Adriaanse S, Veltman DJ, Wink AM, Roosendaal SD, Barkhof F, Stam CJ, Oostrom KJ, Delemarre‐van de Waal HA, Sanz‐Arigita EJ (2012): Resting‐state networks in awake five‐ to eight‐year old children. Hum Brain Mapp 33:1189–1201. [DOI] [PMC free article] [PubMed] [Google Scholar]
- De Nooy W, Mrvar A, Batageli V (2005): Exploratory network analysis with Pajek. Cambridge, UK: Cambridge UP. [Google Scholar]
- Di Martino A, Zuo XN, Kelly C, Grzadzinski R, Mennes M, Schvarcz A, Rodman J, Lord C, Castellanos FX, Milham MP (2013): Shared and distinct intrinsic functional network centrality in autism and attention‐deficit/hyperactivity disorder. Biol Psychiatry 74:623–632. [DOI] [PMC free article] [PubMed] [Google Scholar]
- Dosenbach NU, Nardos B, Cohen AL, Fair DA, Power JD, Church JA, Nelson SM, Wig GS, Vogel AC, Lessov‐Schlaggar CN, Barnes KA, Dubis JW, Feczko E, Coalson RS, Pruett JR, Jr ., Barch DM, Petersen SE, Schlaggar BL (2010): Prediction of individual brain maturity using fMRI. Science 329:1358–1361. [DOI] [PMC free article] [PubMed] [Google Scholar]
- DuPaul GJ, Power TJ, Anastopoulos AD, Reid R (1998): ADHD Rating Scale ‐ IV. New York: Guilford Press. [Google Scholar]
- Fair DA, Cohen AL, Power JD, Dosenbach NU, Church JA, Miezin FM, Schlaggar BL, Petersen SE (2009): Functional brain networks develop from a “local to distributed” organization. PLoS Comput Biol 5:e1000381. [DOI] [PMC free article] [PubMed] [Google Scholar]
- Fair DA, Posner J, Nagel BJ, Bathula D, Dias TG, Mills KL, Blythe MS, Giwa A, Schmitt CF, Nigg JT (2010): Atypical default network connectivity in youth with attention‐deficit/hyperactivity disorder. Biol Psychiatry 68:1084–1091. [DOI] [PMC free article] [PubMed] [Google Scholar]
- Hoekzema E*, Carmona S*, Ramos‐Quiroga JA, Richarte Fernández V, Bosch R, Soliva JC, Rovira M, Bulbena A, Tobeña A, Casas M, Vilarroya O (2014): An independent components and functional connectivity analysis of resting state fMRI data points to neural network dysregulation in adult ADHD. Hum Brain Mapp 35:1261–1272. [DOI] [PMC free article] [PubMed] [Google Scholar]
- Hoff GE, Van den Heuvel MP, Benders MJ, Kersbergen KJ, De Vries LS (2013): On development of functional brain connectivity in the young brain. Front Hum Neurosci 7:650. [DOI] [PMC free article] [PubMed] [Google Scholar]
- Jenkinson M, Bannister P, Brady M, Smith S (2002): Improved optimization for the robust and accurate linear registration and motion correction of brain images. Neuroimage 17:825–841. [DOI] [PubMed] [Google Scholar]
- Kamada T, Kawai S (1989): An algorithm for drawing general undirected graphs. Inf Process Lett Arch 31:7–15. [Google Scholar]
- Kinsbourne M (1973): Minimal brain dysfunction as a neurodevelopmental lag. Ann N Y Acad Sci 205:268–273. [DOI] [PubMed] [Google Scholar]
- Menon V (2011): Large‐scale brain networks and psychopathology: A unifying triple network model. Trends Cogn Sci 15:483–506. [DOI] [PubMed] [Google Scholar]
- Murphy K, Birn RM, Handwerker DA, Jones TB, Bandettini PA (2009): The impact of global signal regression on resting state correlations: Are anti‐correlated networks introduced? Neuroimage 44:893–905. [DOI] [PMC free article] [PubMed] [Google Scholar]
- Oldfield RC (1971): The assessment and analysis of handedness: The Edinburgh inventory. Neuropsychologia 9:97–113. [DOI] [PubMed] [Google Scholar]
- Peterson BS, Potenza MN, Wang Z, Zhu H, Martin A, Marsh R, Plessen KJ, Yu S (2009): An FMRI study of the effects of psychostimulants on default‐mode processing during Stroop task performance in youths with ADHD. Am J Psychiatry 166:1286–1294. [DOI] [PMC free article] [PubMed] [Google Scholar]
- Posner J, Park C, Wang Z (2014): Connecting the dots: A review of resting connectivity MRI studies in attention‐deficit/hyperactivity disorder. Neuropsychol Rev 24:3–15. [DOI] [PMC free article] [PubMed] [Google Scholar]
- Proal E, Reiss PT, Klein RG, Mannuzza S, Gotimer K, Ramos‐Olazagasti MA, Lerch JP, He Y, Zijdenbos A, Kelly C, Milham MP, Castellanos FX (2011): Brain gray matter deficits at 33‐year follow‐up in adults with attention‐deficit/hyperactivity disorder established in childhood. Arch Gen Psychiatry 68:1122–1134. [DOI] [PMC free article] [PubMed] [Google Scholar]
- Rhodes SM, Coghill DR, Matthews K (2005): Neuropsychological functioning in stimulant‐naive boys with hyperkinetic disorder. Psychol Med 35:1109–1120. [DOI] [PubMed] [Google Scholar]
- Rubia K (2013): Functional brain imaging across development. Eur Child Adolesc Psychiatry 22:719–731. [DOI] [PMC free article] [PubMed] [Google Scholar]
- Sagvolden T, Johansen EB, Aase H, Russell VA (2005): A dynamic developmental theory of attention‐deficit/hyperactivity disorder (ADHD) predominantly hyperactive/impulsive and combined subtypes. Behav Brain Sci 28:397–419;discussion 419–468. [DOI] [PubMed] [Google Scholar]
- Sato JR, Hoexter MQ, Castellanos XF, Rohde LA (2012): Abnormal brain connectivity patterns in adults with ADHD: A coherence study. PLoS One 7:e45671. [DOI] [PMC free article] [PubMed] [Google Scholar]
- Sepulcre J (2014): Integration of visual and motor functional streams in the human brain. Neurosci Lett 567:68–73. [DOI] [PubMed] [Google Scholar]
- Sepulcre J, Liu H, Talukdar T, Martincorena I, Yeo BT, Buckner RL (2010): The organization of local and distant functional connectivity in the human brain. PLoS Comput Biol 6:e1000808. [DOI] [PMC free article] [PubMed] [Google Scholar]
- Sepulcre J, Sabuncu MR, Yeo TB, Liu H, Johnson KA (2012): Stepwise connectivity of the modal cortex reveals the multimodal organization of the human brain. J Neurosci 32:10649–10661. [DOI] [PMC free article] [PubMed] [Google Scholar]
- Shaw P, Lerch J, Greenstein D, Sharp W, Clasen L, Evans A, Giedd J, Castellanos FX, Rapoport J (2006): Longitudinal mapping of cortical thickness and clinical outcome in children and adolescents with attention‐deficit/hyperactivity disorder. Arch Gen Psychiatry 63:540–549. [DOI] [PubMed] [Google Scholar]
- Shaw P, Eckstrand K, Sharp W, Blumenthal J, Lerch JP, Greenstein D, Clasen L, Evans A, Giedd J, Rapoport JL (2007): Attention‐deficit/hyperactivity disorder is characterized by a delay in cortical maturation. Proc Natl Acad Sci USA 104:19649–19654. [DOI] [PMC free article] [PubMed] [Google Scholar]
- Shaw P, Lalonde F, Lepage C, Rabin C, Eckstrand K, Sharp W, Greenstein D, Evans A, Giedd JN, Rapoport J (2009a): Development of cortical asymmetry in typically developing children and its disruption in attention‐deficit/hyperactivity disorder. Arch Gen Psychiatry 66:888–896. [DOI] [PMC free article] [PubMed] [Google Scholar]
- Shaw P, Sharp WS, Morrison M, Eckstrand K, Greenstein DK, Clasen LS, Evans AC, Rapoport JL (2009b): Psychostimulant treatment and the developing cortex in attention deficit hyperactivity disorder. Am J Psychiatry 166:58–63. [DOI] [PMC free article] [PubMed] [Google Scholar]
- Shaw P, Malek M, Watson B, Sharp W, Evans A, Greenstein D (2012): Development of cortical surface area and gyrification in attention‐deficit/hyperactivity disorder. Biol Psychiatry 72:191–197. [DOI] [PMC free article] [PubMed] [Google Scholar]
- Sonuga‐Barke EJ, Castellanos FX (2007): Spontaneous attentional fluctuations in impaired states and pathological conditions: A neurobiological hypothesis. Neurosci Biobehav Rev 31:977–986. [DOI] [PubMed] [Google Scholar]
- Sridharan D, Levitin DJ, Menon V (2008): A critical role for the right fronto‐insular cortex in switching between central‐executive and default‐mode networks. Proc Natl Acad Sci USA 105:12569–12574. [DOI] [PMC free article] [PubMed] [Google Scholar]
- Sripada CS, Kessler D, Angstadt M (2014): Lag in maturation of the brain's intrinsic functional architecture in attention‐deficit/hyperactivity disorder. Proc Natl Acad Sci USA 111:14259–14264. [DOI] [PMC free article] [PubMed] [Google Scholar]
- Sun L, Cao Q, Long X, Sui M, Cao X, Zhu C, Zuo X, An L, Song Y, Zang Y, Wang Y (2012): Abnormal functional connectivity between the anterior cingulate and the default mode network in drug‐naive boys with attention deficit hyperactivity disorder. Psychiatry Res 201:120–127. [DOI] [PubMed] [Google Scholar]
- Supekar K, Menon V (2012): Developmental maturation of dynamic causal control signals in higher‐order cognition: A neurocognitive network model. PLoS Comput Biol 8:e1002374. [DOI] [PMC free article] [PubMed] [Google Scholar]
- Supekar K, Musen M, Menon V (2009): Development of large‐scale functional brain networks in children. PLoS Biol 7:e1000157. [DOI] [PMC free article] [PubMed] [Google Scholar]
- Tian L, Jiang T, Liang M, Zang Y, He Y, Sui M, Wang Y (2008): Enhanced resting‐state brain activities in ADHD patients: A fMRI study. Brain Dev 30:342–348. [DOI] [PubMed] [Google Scholar]
- Tripp G, Alsop B (1999): Sensitivity to reward frequency in boys with attention deficit hyperactivity disorder. J Clin Child Psychol 28:366–375. [DOI] [PubMed] [Google Scholar]
- Valera EM, Spencer RM, Zeffiro TA, Makris N, Spencer TJ, Faraone SV, Biederman J, Seidman LJ (2010): Neural substrates of impaired sensorimotor timing in adult attention‐deficit/hyperactivity disorder. Biol Psychiatry 68:359–367. [DOI] [PMC free article] [PubMed] [Google Scholar]
- Van Dijk KR, Hedden T, Venkataraman A, Evans KC, Lazar SW, Buckner RL (2010): Intrinsic functional connectivity as a tool for human connectomics: Theory, properties, and optimization. J Neurophysiol 103:297–321. [DOI] [PMC free article] [PubMed] [Google Scholar]
- Van Essen DC, Dierker DL (2007): Surface‐based and probabilistic atlases of primate cerebral cortex. Neuron 56:209–225. [DOI] [PubMed] [Google Scholar]
- Visser SN, Danielson ML, Bitsko RH, Holbrook JR, Kogan MD, Ghandour RM, Perou R, Blumberg SJ (2014): Trends in the parent‐report of health care provider‐diagnosed and medicated attention‐deficit/hyperactivity disorder: United States, 2003–2011. J Am Acad Child Adolesc Psychiatry 53:34–46 e2. [DOI] [PMC free article] [PubMed] [Google Scholar]
- Vossel S, Geng JJ, Fink GR (2014): Dorsal and ventral attention systems: Distinct neural circuits but collaborative roles. Neuroscientist 20:150–159. [DOI] [PMC free article] [PubMed] [Google Scholar]
- Wang L, Zhu C, He Y, Zang Y, Cao Q, Zhang H, Zhong Q, Wang Y (2009): Altered small‐world brain functional networks in children with attention‐deficit/hyperactivity disorder. Hum Brain Mapp 30:638–649. [DOI] [PMC free article] [PubMed] [Google Scholar]
- Yan CG, Cheung B, Kelly C, Colcombe S, Craddock RC, Di Martino A, Li Q, Zuo XN, Castellanos FX, Milham MP (2013): A comprehensive assessment of regional variation in the impact of head micromovements on functional connectomics. Neuroimage 76:183–201. [DOI] [PMC free article] [PubMed] [Google Scholar]
- Yeo BT, Krienen FM, Sepulcre J, Sabuncu MR, Lashkari D, Hollinshead M, Roffman JL, Smoller JW, Zollei L, Polimeni JR, Fischl B, Liu H, Buckner RL (2011): The organization of the human cerebral cortex estimated by intrinsic functional connectivity. J Neurophysiol 106:1125–1165. [DOI] [PMC free article] [PubMed] [Google Scholar]
Associated Data
This section collects any data citations, data availability statements, or supplementary materials included in this article.
Supplementary Materials
Supplementary Information
Supplementary Information Figure 1.
Supplementary Information Figure 2.
Supplementary Information Figure 3.
Supplementary Information Tables.