

Abstract
Background
Clinicians reported an increasing trend of rapid progression (RP) (AIDS within 3 years of infection) in Cuba.
Methods
Recently infected patients were prospectively sampled, 52 RP at AIDS diagnosis (AIDS-RP) and 21 without AIDS in the same time frame (non-AIDS). 22 patients were sampled at AIDS diagnosis (chronic-AIDS) retrospectively assessed as > 3 years infected. Clinical, demographic, virological, epidemiological and immunological data were collected. Pol and env sequences were used for subtyping, transmission cluster analysis, and prediction of resistance, co-receptor use and evolutionary fitness. Host, immunological and viral predictors of RP were explored through data mining.
Findings
Subtyping revealed 26 subtype B strains, 6 C, 6 CRF18_cpx, 9 CRF19_cpx, 29 BG-recombinants and other subtypes/URFs. All patients infected with CRF19 belonged to the AIDS-RP group. Data mining identified CRF19, oral candidiasis and RANTES levels as the strongest predictors of AIDS-RP. CRF19 was more frequently predicted to use the CXCR4 co-receptor, had higher fitness scores in the protease region, and patients had higher viral load at diagnosis.
Interpretation
CRF19 is a recombinant of subtype D (C-part of Gag, PR, RT and nef), subtype A (N-part of Gag, Integrase, Env) and subtype G (Vif, Vpr, Vpu and C-part of Env). Since subtypes D and A have been associated with respectively faster and slower disease progression, our findings might indicate a fit PR driving high viral load, which in combination with co-infections may boost RANTES levels and thus CXCR4 use, potentially explaining the fast progression. We propose that CRF19 is evolutionary very fit and causing rapid progression to AIDS in many newly infected patients in Cuba.
Keywords: CRF19, HIV-1, Variant, Progression to AIDS, Cuba
Highlights
-
•
We propose that CRF19 is evolutionary very fit, causing rapid progression to AIDS in many newly infected patients in Cuba.
-
•
CRF19 is a recombinant of subtype D, subtype A and subtype G, with a subtype D protease estimated to be particularly fit.
-
•
A fit protease with high viral load and co-infections, may boost RANTES levels and thus CXCR4 use, hence fast progression.
1. Introduction
Despite a low HIV-1 prevalence, diverse clades are circulating in Cuba (Thomson and Nájera, 2005) mainly subtypes B, C, G and H, BG recombinant forms and complex circulating recombinant forms (CRFs) CRF18_cpx and CRF19_cpx (Thomson and Nájera, 2005, Casado et al., 2005, Sierra et al., 2007, Delatorre and Bello, 2013). Whereas the BG recombinants have a Cuban origin, CRF18_cpx and CRF19_cpx seem African (Thomson and Nájera, 2005, Casado et al., 2005, Sierra et al., 2007, Delatorre and Bello, 2013), but became epidemic only in Cuba. This diversity is in contrast with the almost exclusive subtype B epidemic (94%) in the rest of the Caribbean (Vaughan et al., 2003). From 2008 to 2011, 1200 to 1800 individuals have been newly diagnosed with HIV-1 in Cuba each year, of whom 13 to 16% had AIDS at diagnosis, more than in the previous decade (Abrahantes Rodríguez et al., 2010).
Rapid progression to AIDS (within 3 years after seroconversion (Casado et al., 2010)) has been associated to virus genetics (Pushker et al., 2010, Lemey et al., 2007, Ng et al., 2014), epidemiological factors (Helleberg et al., 2013, Murphy et al., 2013), co-receptor use (Kaleebu et al., 2007), co-infection (Secor, 2012, Pawlowski et al., 2012, Alemu et al., 2013, Hernandez and Sherman, 2011), and immune activation (Liovat et al., 2012, Giorgi et al., 1999, Roberts et al., 2011). Rapid progression is associated with poorer cellular immune response (Demarest et al., 2001) and, occasionally, also to poorer HIV-specific humoral immune response (Sapsutthipas et al., 2013, Bártolo et al., 2009). In addition, higher expression of immunosuppression markers (Lajoie et al., 2009) and specific host genetic variants (Casado et al., 2010, Le Clerc et al., 2009, Limou et al., 2009) is also associated with AIDS rapid progression. Compared to subtype A, subtype D is associated with a higher risk of progressing to AIDS (Baeten et al., 2007, Kaleebu et al., 2002). Infection with A/D recombinant viruses resulted in significantly faster progression to AIDS than did infection with pure subtype A (Kiwanuka et al., 2008). Phenotypic switching from CCR5 to CXCR4-using variants is well-known to be associated with rapid progression in subtype B (Esbjörnsson et al., 2010), while recent data report similar fast progression in patients infected with CXCR4-using variants of other clades (Li et al., 2014). However, no subtype or CRF has been exclusively associated with rapid progression.
To investigate this potentially increased proportion of patients with rapid progression to AIDS over the last decade in Cuba, we set up an exploratory study evaluating the association of rapid progression with epidemiological, clinical, viral and immunological parameters, comparing three groups of patients. The first two groups were newly diagnosed patients with an HIV negative test less than three years earlier recruited prospectively who within 3 years after seroconversion either were already diagnosed with AIDS (AIDS-RP) or were still AIDS-free (non-AIDS) and chronically infected HIV-1 patients with AIDS recruited retrospectively (chronic-AIDS).
2. Patients and Methods
2.1. Study Population
From November 2007 onwards, adult HIV-1 patients attending the Institute for Tropical Medicine “Pedro Kourí” (IPK) for medical care were consecutively recruited when 1) having a negative HIV test less than 3 years before HIV-1 diagnosis and 2) being therapy-naive (Table 1). HIV seroconversion date was the midpoint between last negative and first positive HIV test. AIDS was defined if CD4 count < 200 cells/μl, CD4% < 14% or if at least 1 of any 26 enlisted opportunistic infections and/or cancers were documented (Rutledge and Boyd, 2008). Patients were classified as a) rapid progressors (AIDS-RP) when diagnosed with AIDS within 3 years after seroconversion and had at least opportunistic infection or previous consecutive (with at least 1 month interval) CD4 counts < 350 cells/μl to exclude potential false-positive AIDS diagnosis due to transient low CD4 counts during acute HIV-1 infection (Casado et al., 2010); b) non-AIDS patients when still AIDS-free 3 years after seroconversion (non-AIDS); or c) as chronically infected AIDS patients (chronic-AIDS) when diagnosed with AIDS during the study period more than 3 years (judged retrospectively) after seroconversion. Median year of HIV-1 diagnosis for chronic-AIDS patients was 2001 (IQR = 1997–2002) and of AIDS definition it was 2008 (IQR = 2008–2008) (Supplementary figure 1A). Recruitment into the study did not interfere with standard medical care, and patients were treated according to the prevailing Cuban/WHO guidelines. The study was in accordance with the Helsinki Declaration and approved by the ethics committee of IPK. All participants provided written informed consent.
Table 1.
Patient characteristics at HIV diagnosis for the non-AIDS, chronic-AIDS and AIDS-RP groups. Data are expressed as median values with interquartile ranges, or as proportion (%) with number of patients between brackets. Disease progression statistical differences were tested using Kruskal–Wallis or Chi-square test for trend. Statistical tests were considered significant at p-value < 0.05 (displayed in bold). N = number of patients. NS = not significant.
| Non-AIDS (N = 21) | Chronic-AIDS (N = 22) | AIDS-RP (N = 52) | p value | |
|---|---|---|---|---|
| Last negative HIV test before HIV diagnosis (months) | 22.0 (10.5–25.0) (N = 21) | 22.0 (12.0–24.0) (N = 22) | 14.0 (5.3–23.5) (N = 52) | 0.17 |
| Log VL at HIV diagnosis (RNA copies/ml plasma) | < 1.7 (< 1.7–3.5) (N = 12) | 3.2 (< 1.7–3.9) (N = 8) | 4.8 (4.1–5.4) (N = 41) | < 0.0001 |
| CD4% at HIV diagnosis | 27 (19–35) (N = 20) | 24 (19–30) (N = 21) | 13 (10–19) (N = 49) | < 0.0001 |
| CD4 count at HIV diagnosis (cells per μl blood) | 577 (441–815) (N = 20) | 522 (374–782) (N = 22) | 276 (152–386) (N = 49) | < 0.0001 |
| Age at HIV diagnosis (years) | 29 (22–37) (N = 20) | 31 (24–35) (N = 22) | 34 (26–41) (N = 51) | 0.34 |
| Number of sexual partners in the year before diagnosis | 2.0 (1.0–4.8) (N = 20) | 2.0 (1.0–5.3) (N = 22) | 2.0 (1.0–3.0) (N = 51) | 0.54 |
| Acute retroviral syndrome at HIV diagnosis | 65.0% (13/20) | 50.0% (11/22) | 45.1% (23/51) | 0.15 |
| Gender (proportion of male) | 85.0% (17/20) | 86.4% (19/22) | 74.5% (38/51) | 0.24 |
| Skin color | ||||
| White | 60.0% (12/20) | 45.5% (10/22) | 64.7% (33/51) | 0.49 |
| Black | 15.0% (3/20) | 18.2% (4/22) | 23.5% (12/51) | 0.40 |
| Mulatto | 25.0% (5/20) | 36.4% (8/22) | 11.8% (6/51) | 0.09 |
| Anal sex (as reported by both males and females of various sexual orientation) | 80.0% (16/20) | 54.6% (12/22) | 50.0% (25/50) | 0.031 |
| Always condom use after diagnosis | 45.0% (9/20) | 45.5% (10/22) | 19.6% (10/51) | 0.016 |
| Sexual orientation | ||||
| Heterosexual | 20.0% (4/20) | 36.4% (8/22) | 49.0% (25/51) | 0.023 |
| Homosexual | 65.0% (13/20) | 45.5% (10/22) | 41.2% (21/51) | 0.087 |
| Bisexual | 15.0% (3/20) | 18.2% (4/22) | 9.8% (5/51) | 0.44 |
| Residence in Havana | 66.7% (14/21) | 71.4% (15/21) | 68.0% (34/50) | 0.97 |
| Sexual contact with known HIV seropositive | 55.0% (11/20) | 81.8% (18/22) | 54.9% (28/51) | 0.60 |
| AIDS definition criteria CD4 low (< 200 cells/mm3 or < 14%) | – | 95.46% (21/22) | 98.08% (51/52) | 0.52 |
| Waste Syndrome | – | 9.09% (2/22) | 9.62% (5/52) | 0.94 |
| Opportunistic infections | – | 13.64% (3/22) | 25.00% (13/52) | 0.28 |
| Pneumocystis jirovecii | – | 0.00% (0/22) | 13.46% (7/52) | 0.071 |
Supplementary Fig. 1.

Years of inclusion and follow-up for AIDS patients. A) Year of HIV diagnosis and AIDS definition of chronic-AIDS patients. B) Years of follow-up for AIDS-RP and chronic-AIDS patients.
2.2. Measurement of Immunological Markers and Viral Load
CD4 cell counts were determined by FACScan (Becton Dickinson, USA), plasma HIV-1 viral loads by NucliSENS (Biomérieux, France), cytokine and chemokine plasma levels by FlowCytomix (eBioscience, USA): human IL-1b, IL-2, IL-4, IL-5, IL-6, IL-8, IL-10, IL-12p70, G-CSF, TNF-α, TNF-β, IFN-α and IFN-γ, MIP-1α, MIP-1β, IP-10, MIG, MCP-1 and RANTES. Neopterin (IBL Inc., Germany), β2-microglobulin (Immundiagnostik AG, Germany), FasL (IBL Inc., Germany) and sFas (IBL Inc., Germany) plasma levels were quantified using ELISA kits.
2.3. HIV Genetic Analyses
Population-based bi-directional Sanger sequencing of pol and env fragments resulted in on average 1300 NT for pol (HXB2 NT position 2253–3554) and 2078 NT for env (HXB2 NT position 6417–8497) (Pérez et al., 2013, Van Laethem et al., 2005) (Supplementary Table 1).
Initial subtype classification was using COMET version 2 (http://comet.retrovirology.lu) (Struck et al., 2010) and REGA version 3 (http://regatools.med.kuleuven.be/typing/v3/hiv/typingtool/) (De Oliveira et al., 2005, Pineda-Peña et al., 2013), confirmed with manual phylogenetic analysis (Pérez et al., 2006). Because of similar breakpoints in the pol region and lack of breakpoints in the env region, pol and env sequences initially assigned to CRF20_BG, CRF23_BG or CRF24_BG were aligned with the pol and env regions from all full genome sequences of these three CRFs and the full genome subtype reference sequences available in Los Alamos database (accessed August 2013), then a Maximum Likelihood (ML) tree was constructed with RaxML (GTR + Γ model and 1000 bootstrap replicates) (Stamatakis, 2006). All potential CRF20_BG, CRF23_BG and CRF24_BG study sequences clustered mainly outside the cluster of the respective CRF reference sequences precluding a reliable CRF assignment, but together they were monophyletic and were therefore called CRF20–CRF23–CRF24_BG. Similarly, CRF19_cpx does not have breakpoints in pol (subtype D) and env (subtype A), however, CRF19 identification was consistent among subtyping tools, while clustering inside the clade of the reference sequences, consequently CRF19_cpx assignment was considered reliable.
Transmitted drug resistance was predicted using the 2009 WHO list (Bennett et al., 2009) (http://cpr.stanford.edu/cpr.cgi).
Co-receptor use prediction was with geno2pheno[co-receptor]: sequences with a false-positive rate (FPR) < 5% are mainly CXCR4-using (X4) and ≥ 20% are mainly CCR5-using (R5) variants. Therefore, we classified V3 loop sequences with FPR ≥ 20% as R5 viruses, with FPR ≥ 5% and < 20% as dual-tropic viruses and with FPR < 5% as X4 viruses. Our motivation for this classification is as follows. Standard methods for co-receptor prediction only classify HIV-1 variants into two categories, namely CCR5 and CXCRX4-using viruses (Lengauer et al., 2007). The group of CXCRX4-using viruses comprises dual-tropic viruses and X4 viruses. Dual-tropic viruses can use both the CCR5 and CXCR4 co-receptors for cell entry, while X4 viruses can use CXCR4 but not CCR5. The term dual/mixed is used by geno2pheno[co-receptor], referring to either dual tropic viruses or to an unresolved mixture of viruses that can use one or the other co-receptor, geno2pheno[co-receptor] cannot discriminate between dual and mixed tropic viruses. If the V3 loop of clinical samples are determined by single population-based Sanger sequences, the European guidelines on the clinical management of HIV-1 tropism testing state that an FPR of geno2pheno[co-receptor] ≥ 20% can be considered as evidence for an R5 virus, while an FPR < 20% would indicate a CXCRX4-using virus (Vandekerckhove et al., 2011). As in this study we were interested in comparing X4 viruses and R5 viruses, we evaluated whether it is possible to differentiate between X4 and dual-tropic viruses given the geno2pheno[co-receptor] FPR. Previously, it has been shown for the PSSM method that dual-tropic viruses mainly had a score between the scores of X4 viruses and R5 viruses (Jensen et al., 2003). We show here that the same holds for the FPR generated by the geno2pheno[co-receptor] prediction tool. Supplementary Fig. 2A shows the FPR distribution according to phenotypically confirmed R5 only, X4 only, or dual/mixed strains, for sequences that were published at the LANL HIV sequence database between 2009 and July 2013 (LANL_recent), while Supplementary Fig. 2B shows all sequences with phenotype information available in July 2013 (LANL_all). Note that some of the sequences of the “LANL_all” data set were also used for training geno2pheno[co-receptor]. It can be seen that the FPRs of dual/mixed viruses are between the ones from R5 and X4 viruses for both data sets. The 25th percentile for R5 viruses was 20.7% and 17.8% for LANL_recent and LANL_all, respectively. This, in combination with the fact that the European guidelines state that the HIV sequences with a geno2pheno[co-receptor] FPR ≥ 20% are considered R5 viruses, motivated us to utilize this threshold also in our study. Since the median FPR for dual/mixed viruses was 3.4% and 5.3% for the two data sets and the median for X4 viruses was 0.3% and 0.5%, respectively, we chose 5% as the FPR threshold for deciding whether a virus is X4 or not. This is also supported by the German and Austrian guidelines for viral tropism determination stating that patients harboring HIV variants with geno2pheno[co-receptor] FPRs below 5% should not be treated with Maraviroc, while patients with an FPR ≥ 5% might still benefit even if the FPR is not above the R5 threshold (Anon., n.d.).
Supplementary Fig. 2.

Distribution of geno2pheno[co-receptor] FPRs among V3 loop sequences with phenotypic co-receptor information. A) Boxplots of geno2pheno[co-receptor] FPRs for 170 HIV-1 V3 loop sequences that were published at the LANL HIV sequence database between 2009 and July 2013 and that were classified as R5, dual/mixed or X4 by phenotypic co-receptor testing. The central mark is the median and the edges of the box are the 25th and 75th percentiles. Outliers are plotted individually as crosses. Note that none of these sequences were used in the training data set for geno2pheno[co-receptor]. B) Boxplots of geno2pheno[co-receptor] FPRs for 7446 HIV-1 V3 loop sequences from the LANL HIV sequence database that were classified as R5, dual/mixed or X4 by phenotypic co-receptor testing. Note that this set of sequences also contains sequences that had been used for training geno2pheno[co-receptor].
Evolutionary fitness of pol sequences (PR and RT regions) was estimated through a quantitative genotypic fitness landscape for PR and RT separately (Theys et al., 2012).
For transmission cluster analysis, pol sequences were pooled with a) all other available Cuban sequences at IPK; b) the 30 most similar sequences to each of the study sequences retrieved from NCBI (http://blast.ncbi.nlm.nih.gov/Blast.cgi); and c) all sequences retrieved from the Los Alamos database (http://www.hiv.lanl.gov in December 2013) by using the search term “Cuba” and duplicates were removed. Analysis was done per subtype or CRF separately including also the respective subtype reference sequences (from the Los Alamos database), outgroup for subtype B was subtype D, and for all other subtypes and CRFs it was subtype B. Sequences were aligned with MUSCLE, minimally edited with Mega 5 (Edgar, 2004, Tamura et al., 2011), drug resistance related positions (Bennett et al., 2009) were removed to avoid the effect of convergent evolution (Lemey et al., 2005). An ML phylogenetic tree was constructed using FastTree (Price et al., 2010) on 837 sequences for subtype B, 288 sequences for CRF19_cpx, and 204 for CRF20–CRF23–CRF24_BG (average of 918 nucleotides) and transmission clusters were identified with Cluster Picker (Ragonnet-Cronin et al., 2013) using as cut-off genetic distances of 0.03, 0.045 and 0.06 with a bootstrap support of 98% (Frentz et al., 2013, Leigh Brown et al., 2011).
2.4. Statistical Analysis
Parametric and non-parametric tests were used according to Kolmogorov–Smirnov test for normality: Mann Whitney test, Spearman correlation, Pearson correlation, Chi-square test for trend, Chi-square test, One-way ANOVA with Holm–Sidak's multiple comparison post-test and Kruskal–Wallis test with Dunn's multiple comparison post-test. These were all two-tailed with a significance level of 5% (GraphPad Prism 5.0 software).
2.5. Data Mining
Bayesian network (BN) learning (using B-course adapted by Deforche et al. (2006)) was used to describe and visualize conditional dependencies between the multiple variables found significant in univariate analysis, discretizing continuous variables into quartiles. Dependencies are represented qualitatively by a directed acyclic graph where each node corresponds to a variable, and a direct arc between nodes represents a direct influence. Robustness of the arcs was scored with a non-parametric bootstrap test (100 × replicates) (Friedman and WA, 1999) and only arcs with more than 35% support were depicted. Included variables were (Table 1, Table 2): AIDS-RP (AIDS-RP versus chronic-AIDS + non-AIDS), non-AIDS (non-AIDS versus AIDS-RP + chronic-AIDS), RANTES, IP-10, MCP-1, β2-microglobulin, neopterin, viral load at sampling, heterosexual, anal contact, not always using condom, oral candidiasis, subtype CRF19_cpx, and not subtype B. Because of their strict association with AIDS definition, collinearity and redundancy, CD4 levels at HIV diagnosis, viral load at HIV diagnosis, CD4 levels at sampling and opportunistic infections were excluded to clarify other dependencies that we were interested in.
Table 2.
Clinical, immunological and virological markers at sampling for the three studied groups. Data are expressed as median values with interquartile ranges, or as proportion (%) with number of patients between brackets. Statistical differences between groups were tested using Kruskal–Wallis or Chi-square test for trend. Results were considered significant at p-value < 0.05 (displayed in bold). N = number of patients. TDR (transmitted drug resistance): NRTI resistance mutations M41L, F116Y/T215S/K219Q, M41L/T215D and D67N/T215S/K219Q; NNRTI resistance mutations twice K103N and PI resistance mutations N88DN and M46L.
*MIP-1β and IL-8 statistical graphs are depicted in Supplementary Fig. 6A and B, respectively.
| Non-AIDS (N = 21) | Chronic-AIDS (N = 22) | AIDS-RP (N = 52) | p value | |
|---|---|---|---|---|
| Years elapsed from HIV seroconversion to sampling | 1.75 (1.25–2.33) (21) | 9.82 (7.97–12.06) (22) | 1.40 (0.79–2.16) (52) | – |
| Log VL at sampling (RNA copies/ml plasma) | 3.7 (3.0–4.3) (N = 20) | 4.7 (4.2–5.4) (N = 22) | 4.7 (4.0–5.4) (N = 47) | 0.0012 |
| CD4 count at sampling (cells per μl blood) | 501 (408–641) (N = 17) | 212 (113–266) (N = 17) | 189 (91–225) (N = 51) | < 0.0001 |
| CD4% at sampling | 23 (18–32) (N = 17) | 12 (9–13) (N = 17) | 11 (8–13) (N = 51) | < 0.0001 |
| RANTES/CCL5 (pg/ml) | 944 (719–1184) (N = 18) | 1291 (932–1430) (N = 21) | 1398 (1103–1630) (N = 47) | 0.00060 |
| MCP-1 (pg/ml) | 0.0 (0.0–128.3) (N = 18) | 127.1 (0.0–218.9) (N = 21) | 122.70 (0.0–289.0) (N = 47) | 0.046 |
| MIP-1β (pg/ml) | 0.0 (0.0–0.0) (N = 18) | 0.0 (0.0–0.0) (N = 21) | 0.0 (0.0–0.0) (N = 47) | * |
| IP-10/CXCL10 (pg/ml) | 0.0 (0.0–129.5) (N = 18) | 0.0 (0.0–97.2) (N = 21) | 79.43 (0.0–229.3) (N = 47) | 0.047 |
| MIG/CXCL9 (pg/ml) | 0.0 (0.0–138.8) (N = 18) | 139.1 (0.0–212.6) (N = 21) | 125.8 (0.0–209.9) (N = 47) | 0.15 |
| IL-8 (pg/ml) | 0.0 (0.0–0.0) (N = 18) | 0.0 (0.0–0.0) (N = 21) | 0.0 (0.0–0.0) (N = 47) | * |
| FAS/APO (pg/ml) | 750 (600–1197) (N = 18) | 1094 (795–1154) (N = 21) | 1030 (886–1381) (N = 48) | 0.11 |
| Neopterin (ng/ml) | 1.0 (0.7–2.6) (N = 18) | 2.1 (1.5–4.1) (N = 21) | 2.7 (1.4–7.4) (N = 48) | 0.020 |
| β2-microglobulin (mg/ml) | 1.1 (0.8–1.7) (N = 18) | 1.91 (1.47–2.52) (N = 21) | 1.92 (1.2–3.6) (N = 48) | 0.0012 |
| Hemoglobin (g/l) | 131.5 (123.0–140.0) (N = 18) | 125.0 (120.0–139.0) (N = 21) | 130.0 (112.8–140.0) (N = 46) | 0.95 |
| Co-infections (proportion) | ||||
| Oral candidiasis | 4.8% (1/21) | 0.0% (0/22) | 23.1% (12/52) | 0.013 |
| Gonorrhea | 28.6% (6/21) | 9.1% (2/22) | 17.3% (9/52) | 0.40 |
| HCV(1)/HBV(5) | 9.5% (2/21) | 9.1% (2/22) | 3.9% (2/52) | 0.96 |
| Herpes simplex | 23.8% (5/21) | 45.5% (10/22) | 15.4% (8/52) | 0.18 |
| Condyloma | 19.1% (4/21) | 13.6% (3/22) | 7.7% (4/52) | 0.16 |
| Herpes zoster | 4.8% (1/21) | 22.7% (5/22) | 13.5% (7/52) | 0.52 |
| Syphilis | 4.8% (1/21) | 18.2% (4/22) | 7.7% (4/52) | 0.98 |
| Other co-morbidities (chronic non-infectious diseases) | ||||
| Allergy | 33.3% (7/21) | 27.3% (6/22) | 23.1% (12/52) | 0.42 |
| Hypertension | 4.8% (1/21) | 9.1% (2/22) | 11.5% (6/52) | 0.35 |
| HIV subtypes (proportion) | ||||
| Subtype B | 42.1% (8/19) | 42.9% (9/21) | 17.3% (9/52) | 0.016 |
| Subtype C | 0.0% (0/19) | 4.8% (1/21) | 9.6% (5/52) | 0.13 |
| CRF18_cpx | 10.5% (2/19) | 9.5% (2/21) | 3.8% (2/52) | 0.28 |
| CRF19_cpx | 0.0% (0/19) | 0.0% (0/21) | 17.3% (9/52) | 0.012 |
| CRF20,23,24_BG | 36.8% (7/19) | 23.8% (5/21) | 32.7% (17/52) | 0.91 |
| TDR | 10.5% (2/19) | 4.8% (1/21) | 9.6% (5/52) | 0.95 |
| Prediction of co-receptor use | ||||
| X4 (FPR < 5%) | 0.0% (0/13) | 18.8% (3/16) | 16.2% (6/37) | 0.21 |
| R5X4 (5% ≤ FPR < 20%) | 30.8% (3/13) | 31.3% (5/16) | 37.8% (14/37) | 0.59 |
| R5 (FPR ≥ 20%) | 70.6% (10/13) | 50.0% (8/16) | 45.95% (17/37) | 0.07 |
3. Results
3.1. Descriptive Characteristics of Study Population
We recruited 95 treatment-naive HIV-1-infected patients, up to a number of 52 in the AIDS-RP group, up to 21 in the non-AIDS group, and up to 22 in the chronic-AIDS group. Study plasma samples and clinical, epidemiological and laboratory data were collected (Table 1, Table 2). The patients were predominantly white young males from Havana (median 33.0 years old at HIV diagnosis, 80% male) with no significant difference in age, gender and skin color distribution among groups (Table 1).
For all groups, the median time between last negative and first positive HIV test was similar: 16.0 months (IQR = 9.3–24.0 months), its midpoint being the estimated seroconversion date. Median time between seroconversion and AIDS was 1.4 years in the AIDS-RP group and 9.82 years in the chronic-AIDS group (Supplementary Fig. 1B). Sampling was a median of 1.75 years after seroconversion for non-AIDS and AIDS-RP groups (Table 2). At AIDS diagnosis, 16 patients were identified with opportunistic infections, 13 in the AIDS-RP group (25%) and 3 in the chronic-AIDS group (14%). The most common opportunistic infection was Pneumocystis jirovecii (Table 1).
For 92 patients, at least partial pol and for 70 patients, both partial pol and partial env regions sequences were available. Twenty six patients were infected with subtype B, 6 with subtype C, 6 with CRF18_cpx, 9 with CRF19_cpx and 29 with CRF20–23–24_BG (Fig. 1A). The others were infected with various other subtypes and URFs (Supplementary Fig. 3).
Fig. 1.

CRF19_cpx is associated with rapid progression to AIDS. A) HIV subtype distribution among the three studied groups: non-AIDS, chronic-AIDS and AIDS-RP, classified according to the disease progression rates (see Patients and methods). B) Variables found to be significantly associated with AIDS-RP (AIDS-RP versus non-AIDS + chronic-AIDS) or non-AIDS (non-AIDS versus chronic-AIDS + AIDS-RP) patients in univariate analysis were included in the BN model. A central role for CRF19_cpx in rapid progression to AIDS was demonstrated, showing direct influences (arcs) between AIDS-RP, CRF19_cpx, oral candidiasis, higher RANTES, not always using condoms and not subtype B (red contours and arcs). The stability of the dependency was assessed with a non-parametric bootstrap (100 × replicates). All arcs with bootstrap over 35% are depicted in the network. All arcs with dashed lines represent antagonistic dependencies. C) The ML phylogenetic tree for subtype CRF19_cpx (pol region) was constructed using FastTree. CRF19-cpx-infected AIDS-RP (red), CRF19_cpx reference sequences and all other CRF19_cpx sequences retrieved from Los Alamos database (black), all other available CRF19_cpx sequences from IPK (black), and subtype B Los Alamos reference sequences (blue). One of the nine CRF19_cpx sequences was incomplete for pol region and not included in the ML phylogenetic tree analysis. D) Mosaic structure of the CRF19_cpx genome as taken from the Los Alamos HIV Sequence Database (http://www.hiv.lanl.gov/content/sequence/HIV/CRFs/breakpoints.html#CRF19). (For interpretation of the references to color in this figure legend, the reader is referred to the web version of this article.)
Supplementary Fig. 3.

Phylogenetic analysis of all subtypes. Phylogenetic analyses were performed on 2121 sequences for the analysis of all subtypes (average length of 918 nucleotides). The ML phylogenetic tree was constructed using FastTree and transmission clusters were identified with the program Cluster Picker using as cut-off genetic distances of 0.03, 0.045 and 0.06 with a bootstrap support of 98%. AIDS-RP (red), Chronic-AIDS (blue), non-AIDS (green) and reference sequences (magenta). Two transmission clusters included four patients from the AIDS-RP and chronic-AIDS cohorts. One subtype B cluster involved two patients from the non-AIDS, one patient from the chronic-AIDS and one patient from the AIDS-RP group, while one CRF20_BG cluster included two patients from the non-AIDS group together with two individuals of the AIDS-RP group. None of the patients from our study carrying a CRF19_cpx virus clustered together (Fig. 1C).
3.2. Variables Associated With AIDS-RP
In univariate analysis with multiple comparison posttest correction, several significant differences were observed (Table 1, Table 2, Table 3 and Supplementary Fig. 4A–I). As expected, at HIV diagnosis AIDS-RP patients had a significantly higher median log viral load (4.8 log c/ml) (non-AIDS < 1.7 log c/ml, chronic-AIDS 3.2 log c/mL); and significantly lower CD4 levels (276 cells/mm3) (non-AIDS 577 cells/μl, chronic-AIDS 522 cells/μl) (Table 1, Table 3). At sampling, levels of RANTES/CCL5, MCP-1, β2-microglobulin, neopterin, and viral load were significantly higher and CD4 count significantly lower in AIDS-RP group than in the non-AIDS group (Table 2, Table 3 and Supplementary Fig. 4A–I); while AIDS-RP was not associated with a different proportion of transmitted drug resistance (Table 2) or a higher proportion of X4-predicted viruses, irrespective of the cut-off used (< 5% or ≤ 20% FPR) (Table 2).
Table 3.
Multiple comparison posttest for the attributes significantly associated with disease progression. Data are expressed as median values with interquartile ranges, or as proportion (%) with number of patients between brackets. Statistical differences between AIDS-RP vs. non-AIDS and AIDS-RP vs. chronic-AIDS groups were tested using Dunn's multiple comparison test or Chi-square test. Results were considered significant at p-value < 0.05 (displayed in bold). N = number of patients.
| Non-AIDS (N = 21) | Chronic-AIDS (N = 22) | AIDS-RP (N = 52) | Multiple comparison posttest AIDS-RP vs. non-AIDS |
Multiple comparison posttest AIDS-RP vs. chronic-AIDS |
Multiple comparison posttest Chronic-AIDS vs. non-AIDS |
|
|---|---|---|---|---|---|---|
| Log VL at HIV diagnosis (RNA copies/ml plasma) | < 1.7 (< 1.7–3.5) (N = 12) | 3.2 (< 1.7–3.9) (N = 8) | 4.8 (4.1–5.4) (N = 41) | < 0.0001 | 0.0054 | > 0.99 |
| CD4% at HIV diagnosis (%) | 27 (19–35) (N = 20) | 24 (19–30) (N = 21) | 13 (10–19) (N = 49) | < 0.0001 | < 0.0001 | > 0.99 |
| CD4 count at HIV diagnosis (cells per μl blood) | 577 (441–815) (N = 20) | 522 (374–782) (N = 22) | 276 (152–386) (N = 49) | < 0.0001 | < 0.0001 | > 0.99 |
| Log VL at sampling (RNA copies/ml plasma) | 3.7 (3.0–4.3) (N = 20) | 4.7 (4.2–5.4) (N = 22) | 4.7 (4.0–5.4) (N = 47) | 0.0028 | > 0.99 | 0.0033 |
| CD4 count at sampling (cells per μl blood) | 501 (408–641) (N = 17) | 212 (113–266) (N = 17) | 189 (91–225) (N = 51) | < 0.0001 | > 0.99 | 0.0001 |
| CD4% at sampling (%) | 23 (18–32) (N = 17) | 12 (9–13) (N = 17) | 11 (8–13) (N = 51) | < 0.0001 | > 0.99 | < 0.0001 |
| RANTES/CCL5 (pg/ml) | 944 (719–1184) (N = 18) | 1291 (932–1430) (N = 21) | 1398 (1103–1630) (N = 47) | 0.0004 | 0.41 | 0.11 |
| MCP-1 (pg/ml) | 0.0 (0.0–128.3) (N = 18) | 127.1 (0.0–218.9) (N = 21) | 122.70 (0.0–289.0) (N = 47) | 0.047 | 0.66 | 0.83 |
| IP-10/CXCL10 (pg/ml) | 0.0 (0.0–129.5) (N = 18) | 0.0 (0.0–97.2) (N = 21) | 79.43 (0.0–229.3) (N = 47) | 0.22 | 0.093 | > 0.99 |
| Neopterin (ng/ml) | 1.0 (0.7–2.6) (N = 18) | 2.1 (1.5–4.1) (N = 21) | 2.7 (1.4–7.4) (N = 48) | 0.016 | 0.94 | 0.34 |
| β2-microglobulin (mg/ml) | 1.1 (0.8–1.7) (N = 18) | 1.91 (1.47–2.52) (N = 21) | 1.92 (1.2–3.6) (N = 48) | 0.0016 | > 0.99 | 0.0063 |
| Anal sex (as reported by both males and females of various sexual orientation) | 80.0% (16/20) | 54.6% (12/22) | 50.0% (25/50) | 0.021 | 0.72 | 0.081 |
| Always condom use after diagnosis | 45.0% (9/20) | 45.5% (10/22) | 19.6% (10/51) | 0.030 | 0.023 | 0.98 |
| Sexual orientation | ||||||
| Heterosexual | 20.0% (4/20) | 36.4% (8/22) | 49.0% (25/51) | 0.025 | 0.32 | 0.24 |
| Co-infections (proportion) | ||||||
| Oral candidiasis | 4.8% (1/21) | 0.0% (0/22) | 23.1% (12/52) | 0.064 | 0.014 | 0.30 |
| HIV subtypes (proportion) | ||||||
| Subtype B | 38.1% (8/21) | 40.9% (9/22) | 17.3% (9/52) | 0.057 | 0.031 | 0.85 |
| CRF19_cpx | 0.0% (0/21) | 0.0% (0/22) | 17.3% (9/52) | 0.042 | 0.037 | – |
Supplementary Fig. 4.

Comparison of CD4, viral load, RANTES, MCP-1, IP-10, neopterin and β2 microglobulin according to the disease progression rates (non-AIDS, chronic-AIDS and AIDS-RP). A) CD4+ levels at HIV diagnosis (Kruskal–Wallis test, p < 0.0001, with Dunn's multiple comparison test, ****p < 0.0001). B) CD4+ levels at sampling (Kruskal–Wallis test, p < 0.0001, with Dunn's multiple comparison test, ***p < 0.001 and ****p < 0.0001). C) Log of viral load at HIV diagnosis (Kruskal–Wallis test, p < 0.0001, with Dunn's multiple comparison test, ****p < 0.0001 and **p < 0.01). D) Log of viral load at sampling (Kruskal–Wallis test, p = 0.0012, with Dunn's multiple comparison test, **p < 0.01). E) RANTES levels at sampling (Kruskal–Wallis test, p = 0.0006, with Dunn's multiple comparison test, **p < 0.01). F) MCP-1 levels at sampling (Kruskal–Wallis test, p = 0.046, with Dunn's multiple comparison test, *p < 0.05). G) IP-10 levels at sampling (Kruskal–Wallis test, p = 0.047). H) Neopterin levels at sampling (Kruskal–Wallis test, p = 0.020, with Dunn's multiple comparison test, *p < 0.05). I) β2 microglobulin levels at sampling (Kruskal–Wallis test, p = 0.0012, with Dunn's multiple comparison test, **p < 0.01).
However, we found some surprising associations. Compared to the combined non-AIDS and chronic-AIDS group, AIDS-RP were significantly more often heterosexual (49%), less prone to protect themselves from superinfection or STIs (only 19.6% were always using condoms after diagnosis), presented more often with oral candidiasis (23.1%), were less frequently infected with subtype B (17.3%) and more frequently with CRF19_cpx (17.3%) (Fig. 1A, Table 1, Table 2, Table 3). Strikingly, all 9 CRF19_cpx infected patients belonged to the AIDS-RP group (Fig. 1A and Table 2). Another unusual association was non-AIDS with anal sex. While we cannot exclude underreporting of injecting drug use in our cohort, according to the Cuban epidemiological information center, there are no reports of IDU infected with HIV in the last years in Cuba.
Because of a complete overlap between some variables (e.g., all CRF19_cpx were AIDS-RP), the assumptions of the classical regression model were violated by multicollinearity, prohibiting us to calculate odds ratios using logistic regression. We therefore used a multivariate Bayesian Network analysis (BN) and compiled all patient information significantly associated with disease progression groups in the univariate analysis. The AIDS-RP and non-AIDS groups were displayed explicitly in the graph (Fig. 1B), by coding the groups' binary (only two of the three groups are displayed, such that chronic-AIDS is coded implicitly as not AIDS-RP and not non-AIDS). This display allowed us to capture better the difference between AIDS-RP and the other two groups, however we sacrifice clarity for associations with chronic-AIDS. As expected, the BN approach revealed that a lower viral load at sampling was associated with non-AIDS, whereas infection with CRF19_cpx, oral candidiasis, increased expression of RANTES, “not always using condoms” and not infected with subtype B were associated with AIDS-RP (red in Fig. 1B). The most robust association was with oral candidiasis (75% of bootstraps) and with CRF19_cpx (62% of bootstraps). Moreover, the BN approach demonstrated that CRF19_cpx, RANTES and oral candidiasis were also robustly interconnected (Fig. 1B).
3.3. Rapid Progression to AIDS is Associated With CRF19_cpx Subtype
One of the surprising findings from the BN analysis was the robust association of CRF19_cpx with rapid progression. Our AIDS-RP patients were infected with divergent CRF19_cpx strains and had thus not transmitted a particular virulant variant among each other: none of them clustered in a transmission cluster (Fig. 1C), while we did find some transmission clusters among the other clades (Supplementary Fig. 3). When considering all CRF19_cpx sequences in this analysis, there was either no information on disease progression, they belonged to rapid progressors (including our AIDS-RP), or had fragmented information not in contradiction with rapid progression. CRF19_cpx is a complex recombinant HIV-1 virus consisting of subtype D sequence fragments (C-part of Gag, PR, RT and nef), subtype A sequence fragments (N-part of Gag, Integrase, Env) and subtype G fragments (Vif, Vpr, Vpu and C-terminal part of Env) (Casado et al., 2005) (Fig. 1D).
3.4. CRF19_cpx-infected Patients Have High Viral Replication, High Immune Activation and Frequent Co-infection
For all three groups, compared to subtype B and CRF20-23-24_BG as the only other clades with a sufficient number of sequences, CRF19 infected patients had significantly higher viral load at HIV diagnosis, whereas at sampling the difference was only significant compared to CRF20–23–24_BG (Fig. 2A and B). CRF19 pol sequences at sampling had a significantly higher estimated in vivo fitness score for protease (logF = 3.67) as compared to CRF20–23–24_BG (logF = 0.95) (Fig. 2C), but not for reverse transcriptase (data not shown), and this score was positively associated with log viral load at HIV diagnosis and at sampling (Supplementary Fig. 5A and B). CRF19 infected patients had more frequently oral candidiasis (Fig. 2D) and higher RANTES levels than subtype B or CRF20–23–24_BG infected patients (Fig. 2E). Consistent with RANTES being a CCR5 ligand/competitor, CRF19 strains were more often X4 viruses (< 5% FPR cut-off) (Fig. 2F).
Fig. 2.

Comparison of viral load, RANTES, estimated evolutionary fitness, oral candidiasis and co-receptor use prediction among the most frequent HIV subtypes in our study (non-AIDS, chronic-AIDS and AIDS-RP groups). A) Viral load (log copies/ml) at HIV diagnosis (One-way ANOVA, p = 0.0002, with Holm–Sidak's multiple comparison test, *p < 0.05 and ***p < 0.001). B) Viral load (log copies/ml) at sampling (One-way ANOVA, p = 0.0043, with Holm–Sidak's multiple comparison test, *p < 0.05). C) Evolutionary fitness estimated from protease sequence (log of fitness value, logF) at sampling (Kruskal–Wallis test, p < 0.0001, with Dunn's multiple comparison test, ****p < 0.0001). D) Proportion with oral candidiasis at sampling (Chi-square test, p = 0.0005). E) RANTES levels (pg/ml) at sampling (Kruskal–Wallis test, p = 0.038, with Dunn's multiple comparison test, *p < 0.05). F) Proportion of co-receptor use at sampling (Chi-square test, p = 0.0051).
Supplementary Fig. 5.

Correlation between viral load at diagnosis and sampling and estimated evolutionary fitness at sampling (based on the protease sequence) pooling all three study groups (non-AIDS, chronic-AIDS and AIDS-RP). A) Estimated evolutionary fitness vs viral load at HIV diagnosis. B) Estimated evolutionary fitness vs viral load at sampling. Pearson's correlation coefficient.
Strikingly, when considering only the AIDS-RP group and compared to the other clades, CRF19_cpx infected patients had a significantly higher viral load at HIV diagnosis and in vivo estimated fitness at sampling (logVL = 6.23, and logF = 3.67, Fig. 3A and B), although viral load at sampling was not significantly different (Fig. 3C). In addition, CRF19_cpx infected patients had more often oral candidiasis and had higher RANTES levels (Fig. 3D and E), and CRF19 strains were also more often predicted as X4 (Fig. 3F). Together, these results suggest a high evolutionary fitness of CRF19_cpx.
Fig. 3.

Comparison of viral load, RANTES, estimated evolutionary fitness, oral candidiasis and co-receptor use between CRF19_cpx and all other HIV subtypes among AIDS-RP. A) Viral load (log copies/ml) at HIV diagnosis (Mann Whitney test, *p < 0.05). B) Evolutionary fitness estimated from protease sequence (log of fitness landscape, logF) at sampling (Mann Whitney test, ***p < 0.001). C) Viral load (log copies/ml) at sampling (Mann Whitney test, p = 0.33). D) Proportion with oral candidiasis at sampling (Chi-square test, p = 0.013). E) RANTES levels (pg/ml) at sampling (Mann Whitney test, *p < 0.05). F) Proportion of co-receptor use at sampling (Chi-square test, p = 0.014).
4. Discussion
It has been speculated that inter-subtype recombination may give rise to more pathogenic strains if genomic fragments from different subtypes join together in a better replicating virus, but no direct evidence for this scenario has so far been found. CRF19_cpx is a genetic (Casado et al., 2005) form hitherto only reported in Cuba, but with evidenced central African ancestry (Thomson and Nájera, 2005, Casado et al., 2005, Delatorre and Bello, 2013). Recently, clinicians in Cuba noted an increasing trend of rapid progression to AIDS (< 3 years since seroconversion) (Abrahantes et al., 2010). Here, we propose that this increase is at least in part due to the spread of CRF19_cpx, which we found exclusively associated with rapid progression to AIDS (within 3 years of infection), whereas for other subtypes and CRFs, the disease progression was distributed as is generally seen in other parts of the world.
We set up an exploratory study in Cuba to investigate the association of rapid progression with epidemiological, clinical, viral and immunological parameters, comparing three groups of patients. The first two groups were recruited prospectively who at sampling within 3 years after seroconversion either were already diagnosed with AIDS (AIDS-RP) or who were still AIDS-free (non-AIDS) and chronically infected HIV-1 patients with AIDS recruited retrospectively and sampled at AIDS diagnosis (chronic-AIDS). Bayesian network analysis showed that rapid progression to AIDS in Cuba, being infected with CRF19_cpx, having oral candidiasis, and having higher levels of RANTES are strongly linked. CRF19_cpx was exclusively found among rapid progressors. Compared to other patients in Cuba, CRF19_cpx infected patients have a higher viral load at comparable times since infection, higher levels of RANTES and are more frequently co-infected with oral candidiasis. Additionally, the virus at sampling had higher estimated protease fitness and was predominantly using the CXCR4 co-receptor, potentially explaining the rapid disease progression. Surprisingly however, even when restricting the analysis to the 52 rapid progressors only, CRF19 infection was significantly associated with oral candidiasis, CXCR4 co-receptor use prediction, higher RANTES levels, higher protease fitness at sampling and higher viral load at HIV diagnosis, whereas viral load at sampling was not. Together the higher viral load and higher estimated in vivo fitness of the viral protease suggest that CRF19 is an evolutionary fit virus. However, confirmation by a phenotypic assay is still warranted.
CRF19_cpx is composed of subtype D fragments (C-part of Gag, PR, RT and nef), subtype A fragments (N-part of Gag, Integrase, Env) and subtype G fragments (Vif, Vpr, Vpu and C-terminal part of Env) (Casado et al., 2005). Several studies have reported the association of HIV subtype D with faster disease progression and subtype A with slower disease progression (Baeten et al., 2007, Kaleebu et al., 2002, Kiwanuka et al., 2008). The probability of having an CXCR4-using virus is higher in subtype D than in subtype A infections in non-AIDS clinical status (Kaleebu et al., 2007), suggesting an earlier switch to CXCR4 since dual tropism is not common in subtype D (Tscherning et al., 1998). These findings cannot explain our observations since in CRF19_cpx, the env region responsible for CXCR4 tropism is derived from subtype A. The high viral load, the higher production of RANTES (known to block CCR5 receptors) perhaps resulting from the high viral load (Annunziato et al., 2000) and/or the co-infections (Huang and Levitz, 2000), might be the reason for the high prevalence of CXCR4 use in this CRF19_cpx, and this may be the cause of the rapid disease progression. This high viral load may be related to and potentially caused by the high protease fitness we observed in CRF19_cpx, and thus could suggest a more important role of pol (subtype D portion), and especially of protease, in disease progression, as compared to the env region (subtype A portion) of CRF19_cpx.
Nevertheless, other subtype D genes in CRF19_cpx (gag and nef) not investigated in this study might also be associated with increased viral replication and in vivo pathogenesis. In HIV-1, Gag and Nef have been documented to contain the highest CD8 epitope density and are more frequently recognized by the immune system (Frahm et al., 2004). Notably, amino acid substitution T242N in the Gag p24 TW10 epitope is highly associated with viral escape from the immune system (Leslie et al., 2004). Subtype D-infected patients more often, and subtype A infected patient less often display this T242N (Li et al., 2013). However, T242N in subtype D reduces the viral replication and fitness of the virus (Martinez-Picado et al., 2006), while CRF19-infected patients present a very high viral load. Another important protein is Nef, which is responsible for the down-regulation of CD4 and HLA expression and up-regulation of immature HLA class II expression (Wang, 2013). Furthermore, infection by HIV-1 with a truncated Nef contributes to low-level viral replication and non-pathogenicity (Deacon et al., 1995). However, subtype B Nef was found to be a better HLA class I down-regulator in normal progressors than subtype D Nef. Yet, subtypes D and A were similar in Nef-mediated CD4 and HLA class I down-regulation (Mann et al., 2013).
Our study has several limitations. Even though the statistical link between fast progression and being infected with CRF19_cpx is very strong, we only presented data on 9 such patients. An in depth study on progression in patients infected with CRF19_cpx is needed. We used two different genomic regions and a stringent method of subtyping to increase our confidence in subtyping, however, since we did not have access to the full genome, we cannot exclude recombination in non-sequenced regions. We did not have sufficiently representative data to investigate the trend of CRF19_cpx incidence over the time period that the increase in rapid progression was noted. However, CRF19_cpx prevalence at HIV diagnosis at IPK, Cuba, increased over the investigated time period (2007–2013) (data not shown). We were also not able to investigate the host genotype, however we did confirm that there was no significant difference in ethnic composition between the three groups. Future studies should evaluate HLA and others host genetic markers (CCR5) in new CRF19_cpx-infected patients. It would also be interesting to test humoral and cellular immune responses in new blood samples and to sequence more full-length CRF19_cpx genomes.
We propose that an evolutionary very fit CRF19_cpx together with co-infections is linked to the increase of rapid progression to AIDS in newly infected patients in Cuba. The robust and significant associations with a fitter protease, more circulating virus, higher immune-activation and CXCR4 co-receptor use suggest that CRF19_cpx may be a more pathogenic virus.
The following are the supplementary data related to this article.
Supplementary Fig. 6.
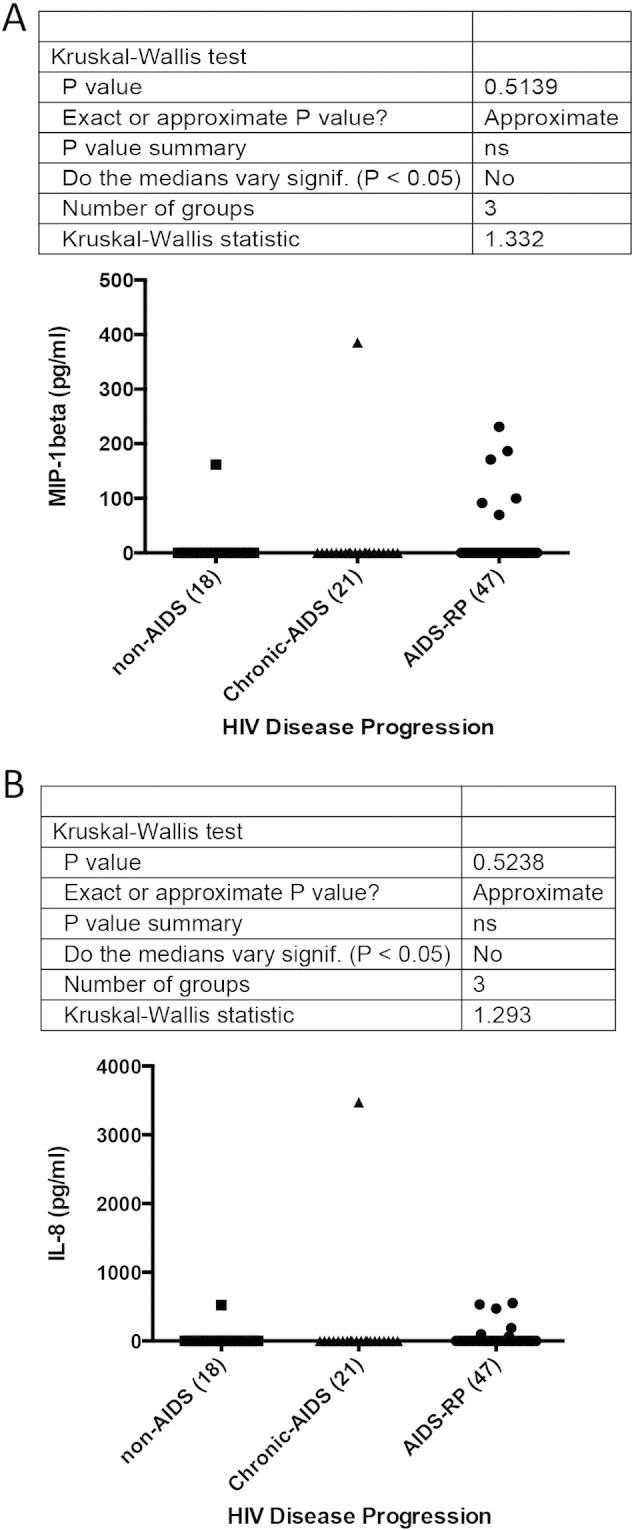
Comparison of MIP-1β and IL-8 levels according to the disease progression rates (non-AIDS, chronic-AIDS and AIDS-RP). A) MIP-1β levels at sampling (Kruskal–Wallis test, p = 0.51). B) MIP-1β levels at sampling (Kruskal–Wallis test, p = 0.52).
Nucleotide sequence accession numbers. Pol and V3 loop sequences were deposited in GenBank under the described accession numbers.
Authors' Contributions
Conceived and designed the experiments: Vivian Kouri, Ricardo Khouri, Michel Moutschen, Johan Van Weyenbergh, Nico Pfeifer, Kristel Van Laethem and Anne-Mieke Vandamme. Performed the experiments: Ricardo Khouri, Yoan Alemán and Yeissel Abrahantes. Analyzed the data: Ricardo Khouri, Andrea-Clemencia Pineda-Peña, Jurgen Vercauteren, Kristof Theys, Nico Pfeifer and Sarah Mergens. Wrote the paper: Ricardo Khouri, Andrea-Clemencia Pineda-Peña, Kristel Van Laethem and Anne-Mieke Vandamme. Contributed data/reagents/materials/analysis tools: Vivian Kouri, Ana B. Pérez, Jorge Pérez, Lissette Pérez and Nico Pfeifer.
Funding
This work was supported by grants from the Vlaamse Interuniversitaire Raad (VLIR) (ZEIN2008PR358), a collaborative fund between Wallony and Cuba (CF/JF/PD/Cu-2009/28422), the Global Fund to Fight AIDS, Tuberculosis and Malaria, the University of Leuven (PF/10/018) and the Fonds voor Wetenschappelijk Onderzoek Vlaanderen (1.5.236.11N and G.0692.14). The computational resources and services used in this work were provided by the Hercules Foundation and the Flemish Government — department EWI-FWO Krediet aan Navorsers (Theys, KAN2012 1.5.249.12); AMV was supported by "Programa Ciências sem fronteiras" Conselho Nacional de Desenvolvimento Cientifico e Tecnológico (CNPq) of Brazil. RK was supported by an IRO scholarship-KU Leuven and KT was supported by the Research Foundation — Flanders (FWO). We declare that funding sources had no role in the study design, data collection, data interpretation or writing of the report.
Conflict of Interest Disclosure
The Max Planck Institute for Informatics collaborates with a company in the area of medical diagnostics on the topic of viral tropism of HIV. In its context a version controlled implementation of geno2pheno[co-receptor] with secure access is maintained by Max Planck Institute for Informatics under a paid service agreement.
Acknowledgments
We would like to thank Yoeri Schrooten for his technical assistance.
References
- Abrahantes Rodríguez Y., Pérez Avila J., Kouri Cardellá V., Fonseca Gómez C., Baly Gil A., Tápanes Fernandez T. Factors linked to rapid progression to AIDS in Cuban subjects. Rev. Cubana Med. Trop. 2010;62:146–153. [PubMed] [Google Scholar]
- Alemu A., Shiferaw Y., Addis Z., Mathewos B., Birhan W. Effect of malaria on HIV/AIDS transmission and progression. Parasites Vectors. 2013;6:18. doi: 10.1186/1756-3305-6-18. [DOI] [PMC free article] [PubMed] [Google Scholar]
- Annunziato F., Galli G., Nappi F. Limited expression of R5-tropic HIV-1 in CCR5-positive type 1-polarized T cells explained by their ability to produce RANTES, MIP-1alpha, and MIP-1beta. Blood. 2000;95:1167–1174. [PubMed] [Google Scholar]
- Eberle J., Noah C., Wolf E., Stürmer M., Braun P., Korn K., Däumer M., Thielen A., Berg T., Obermeier M., Ehret R., WaLter H., Lengauer T., Verheyen J., Sierra S., Kaiser R. Empfehlungen zur Bestimmung des HIV-1-Korezeptor-Gebrauchs, (DAIG Recommendations for the HIV-1 Tropism Testing) 2014. http://www.daignet.de/site-content/hiv-therapie/leitlinien-1/Empfehlungen%20zur%20Bestimmung%20des%20HIV_1_Korezeptor_Gebrauchs.pdf (last accessed 2/3/2015)
- Baeten J.M., Chohan B., Lavreys L. HIV-1 subtype D infection is associated with faster disease progression than subtype A in spite of similar plasma HIV-1 loads. J. Infect. Dis. 2007;195:1177–1180. doi: 10.1086/512682. [DOI] [PubMed] [Google Scholar]
- Bártolo I., Camacho R., Barroso H., Bezerra V., Taveira N. Rapid clinical progression to AIDS and death in a persistently seronegative HIV-1 infected heterosexual young man. AIDS. 2009;23:2359–2362. doi: 10.1097/QAD.0b013e328332d5e1. [DOI] [PubMed] [Google Scholar]
- Bennett D.E., Camacho R.J., Otelea D. Drug resistance mutations for surveillance of transmitted HIV-1 drug-resistance: 2009 update. PLoS ONE. 2009;4:e4724. doi: 10.1371/journal.pone.0004724. [DOI] [PMC free article] [PubMed] [Google Scholar]
- Casado G., Thomson M.M., Sierra M., Nájera R. Identification of a novel HIV-1 circulating ADG intersubtype recombinant form (CRF19_cpx) in Cuba. J. Acquir. Immune Defic. Syndr. 2005;40:532–537. doi: 10.1097/01.qai.0000186363.27587.c0. [DOI] [PubMed] [Google Scholar]
- Casado C., Colombo S., Rauch A. Host and viral genetic correlates of clinical definitions of HIV-1 disease progression. PLoS ONE. 2010;5:e11079. doi: 10.1371/journal.pone.0011079. [DOI] [PMC free article] [PubMed] [Google Scholar]
- De Oliveira T., Deforche K., Cassol S. An automated genotyping system for analysis of HIV-1 and other microbial sequences. Bioinformatics. 2005;21:3797–3800. doi: 10.1093/bioinformatics/bti607. [DOI] [PubMed] [Google Scholar]
- Deacon N.J., Tsykin A., Solomon A. Genomic structure of an attenuated quasi species of HIV-1 from a blood transfusion donor and recipients. Science. 1995;270:988–991. doi: 10.1126/science.270.5238.988. [DOI] [PubMed] [Google Scholar]
- Deforche K., Silander T., Camacho R. Analysis of HIV-1 pol sequences using Bayesian Networks: implications for drug resistance. Bioinformatics. 2006;22:2975–2979. doi: 10.1093/bioinformatics/btl508. [DOI] [PubMed] [Google Scholar]
- Delatorre E., Bello G. Phylodynamics of the HIV-1 epidemic in Cuba. PLoS ONE. 2013;8:e72448. doi: 10.1371/journal.pone.0072448. [DOI] [PMC free article] [PubMed] [Google Scholar]
- Demarest J.F., Jack N., Cleghorn F.R. Immunologic and virologic analyses of an acutely HIV type 1-infected patient with extremely rapid disease progression. AIDS Res. Hum. Retroviruses. 2001;17:1333–1344. doi: 10.1089/08892220152596597. [DOI] [PubMed] [Google Scholar]
- Edgar R.C. MUSCLE: multiple sequence alignment with high accuracy and high throughput. Nucleic Acids Res. 2004;32:1792–1797. doi: 10.1093/nar/gkh340. [DOI] [PMC free article] [PubMed] [Google Scholar]
- Esbjörnsson J., Månsson F., Martínez-arias W. 2010. Frequent CXCR4 Tropism of HIV-1 Subtype A and CRF02_AG During Late-stage Disease — Indication of an Evolving Epidemic in West Africa; pp. 1–13. [DOI] [PMC free article] [PubMed] [Google Scholar]
- Frahm N., Korber B.T., Adams C.M. Consistent cytotoxic-T-lymphocyte targeting of immunodominant regions in human immunodeficiency virus across multiple ethnicities. J. Virol. 2004;78:2187–2200. doi: 10.1128/JVI.78.5.2187-2200.2004. [DOI] [PMC free article] [PubMed] [Google Scholar]
- Frentz D., Wensing A.M.J., Albert J. Limited cross-border infections in patients newly diagnosed with HIV in Europe. Retrovirology. 2013;10:36. doi: 10.1186/1742-4690-10-36. [DOI] [PMC free article] [PubMed] [Google Scholar]
- Friedman N.G.M., WA . UAI'99 Proceedings of the Fifteenth Conference on Uncertainty in Artificial Intelligence. 1999. Data analysis with bayesian networks: a bootstrap approach; pp. 196–205. [Google Scholar]
- Giorgi J.V., Hultin L.E., McKeating J.A. Shorter survival in advanced human immunodeficiency virus type 1 infection is more closely associated with T lymphocyte activation than with plasma virus burden or virus chemokine co-receptor usage. J. Infect. Dis. 1999;179:859–870. doi: 10.1086/314660. [DOI] [PubMed] [Google Scholar]
- Helleberg M., Afzal S., Kronborg G. Mortality attributable to smoking among HIV-1-infected individuals: a nationwide, population-based cohort study. Clin. Infect. Dis. 2013;56:727–734. doi: 10.1093/cid/cis933. [DOI] [PubMed] [Google Scholar]
- Hernandez M.D., Sherman K.E. HIV/hepatitis C coinfection natural history and disease progression. Curr. Opin. HIV AIDS. 2011;6:478–482. doi: 10.1097/COH.0b013e32834bd365. [DOI] [PMC free article] [PubMed] [Google Scholar]
- Huang C., Levitz S.M. Stimulation of macrophage inflammatory protein-1alpha, macrophage inflammatory protein-1beta, and RANTES by Candida albicans and Cryptococcus neoformans in peripheral blood mononuclear cells from persons with and without human immunodeficiency virus infec. J. Infect. Dis. 2000;181:791–794. doi: 10.1086/315250. [DOI] [PubMed] [Google Scholar]
- Jensen M.A., Li F.-S., van 't Wout A.B. Improved co-receptor usage prediction and genotypic monitoring of R5-to-X4 transition by motif analysis of human immunodeficiency virus type 1 env V3 loop sequences. J. Virol. 2003;77:13376–13388. doi: 10.1128/JVI.77.24.13376-13388.2003. [DOI] [PMC free article] [PubMed] [Google Scholar]
- Kaleebu P., French N., Mahe C. Effect of human immunodeficiency virus (HIV) type 1 envelope subtypes A and D on disease progression in a large cohort of HIV-1-positive persons in Uganda. J. Infect. Dis. 2002;185:1244–1250. doi: 10.1086/340130. [DOI] [PubMed] [Google Scholar]
- Kaleebu P., Nankya I.L., Yirrell D.L. Relation between chemokine receptor use, disease stage, and HIV-1 subtypes A and D: results from a rural Ugandan cohort. J. Acquir. Immune Defic. Syndr. 2007;45:28–33. doi: 10.1097/QAI.0b013e3180385aa0. [DOI] [PubMed] [Google Scholar]
- Kiwanuka N., Laeyendecker O., Robb M. Effect of human immunodeficiency virus Type 1 (HIV-1) subtype on disease progression in persons from Rakai, Uganda, with incident HIV-1 infection. J. Infect. Dis. 2008;197:707–713. doi: 10.1086/527416. [DOI] [PubMed] [Google Scholar]
- Lajoie J., Fontaine J., Tremblay C., Routy J.-P., Poudrier J., Roger M. Persistence of high levels of blood soluble human leukocyte antigen-G is associated with rapid progression of HIV infection. AIDS. 2009;23:1437–1440. doi: 10.1097/QAD.0b013e32832d0825. [DOI] [PubMed] [Google Scholar]
- Le Clerc S., Limou S., Coulonges C. Genomewide association study of a rapid progression cohort identifies new susceptibility alleles for AIDS (ANRS Genomewide Association Study 03) J. Infect. Dis. 2009;200:1194–1201. doi: 10.1086/605892. [DOI] [PubMed] [Google Scholar]
- Leigh Brown A.J., Lycett S.J., Weinert L., Hughes G.J., Fearnhill E., Dunn D.T. Transmission network parameters estimated from HIV sequences for a nationwide epidemic. J. Infect. Dis. 2011;204:1463–1469. doi: 10.1093/infdis/jir550. [DOI] [PMC free article] [PubMed] [Google Scholar]
- Lemey P., Derdelinckx I., Rambaut A. Molecular footprint of drug-selective pressure in a human immunodeficiency virus transmission chain. J. Virol. 2005;79:11981–11989. doi: 10.1128/JVI.79.18.11981-11989.2005. [DOI] [PMC free article] [PubMed] [Google Scholar]
- Lemey P., Kosakovsky Pond S.L., Drummond A.J. Synonymous substitution rates predict HIV disease progression as a result of underlying replication dynamics. PLoS Comput. Biol. 2007;3:e29. doi: 10.1371/journal.pcbi.0030029. [DOI] [PMC free article] [PubMed] [Google Scholar]
- Lengauer T., Sander O., Sierra S., Thielen A., Kaiser R. Bioinformatics prediction of HIV co-receptor usage. Nat. Biotechnol. 2007;25:1407–1410. doi: 10.1038/nbt1371. [DOI] [PubMed] [Google Scholar]
- Leslie A.J., Pfafferott K.J., Chetty P. HIV evolution: CTL escape mutation and reversion after transmission. Nat. Med. 2004;10:282–289. doi: 10.1038/nm992. [DOI] [PubMed] [Google Scholar]
- Li G., Verheyen J., Rhee S.-Y., Voet A., Vandamme A.-M., Theys K. Functional conservation of HIV-1 Gag: implications for rational drug design. Retrovirology. 2013;10:126. doi: 10.1186/1742-4690-10-126. [DOI] [PMC free article] [PubMed] [Google Scholar]
- Li X., Xue Y., Zhou L. Evidence that HIV-1 CRF01_AE is associated with low CD4 + T cell count and CXCR4 co-receptor usage in recently infected young men who have sex with men (MSM) in Shanghai, China. PLoS ONE. 2014;9:e89462. doi: 10.1371/journal.pone.0089462. [DOI] [PMC free article] [PubMed] [Google Scholar]
- Limou S., Le Clerc S., Coulonges C. Genomewide association study of an AIDS-nonprogression cohort emphasizes the role played by HLA genes (ANRS Genomewide Association Study 02) J. Infect. Dis. 2009;199:419–426. doi: 10.1086/596067. [DOI] [PubMed] [Google Scholar]
- Liovat A.-S., Rey-Cuillé M.-A., Lécuroux C. Acute plasma biomarkers of T cell activation set-point levels and of disease progression in HIV-1 infection. PLoS ONE. 2012;7:e46143. doi: 10.1371/journal.pone.0046143. [DOI] [PMC free article] [PubMed] [Google Scholar]
- Mann J.K., Byakwaga H., Kuang X.T. Ability of HIV-1 Nef to downregulate CD4 and HLA class I differs among viral subtypes. Retrovirology. 2013;10:100. doi: 10.1186/1742-4690-10-100. [DOI] [PMC free article] [PubMed] [Google Scholar]
- Martinez-Picado J., Prado J.G., Fry E.E. Fitness cost of escape mutations in p24 Gag in association with control of human immunodeficiency virus type 1. J. Virol. 2006;80:3617–3623. doi: 10.1128/JVI.80.7.3617-3623.2006. [DOI] [PMC free article] [PubMed] [Google Scholar]
- Murphy K., Hoover D.R., Shi Q. Association of self-reported race with AIDS death in continuous HAART users in a cohort of HIV-infected women in the United States. AIDS. 2013;27:2413–2423. doi: 10.1097/01.aids.0000432537.92958.73. [DOI] [PMC free article] [PubMed] [Google Scholar]
- Ng O.T., Laeyendecker O., Redd A.D. HIV type 1 polymerase gene polymorphisms are associated with phenotypic differences in replication capacity and disease progression. J. Infect. Dis. 2014;209:66–73. doi: 10.1093/infdis/jit425. [DOI] [PMC free article] [PubMed] [Google Scholar]
- Pawlowski A., Jansson M., Sköld M., Rottenberg M.E., Källenius G. Tuberculosis and HIV co-infection. PLoS Pathog. 2012;8:e1002464. doi: 10.1371/journal.ppat.1002464. [DOI] [PMC free article] [PubMed] [Google Scholar]
- Pérez L., Thomson M.M., Bleda M.J. HIV type 1 molecular epidemiology in Cuba: high genetic diversity, frequent mosaicism, and recent expansion of BG intersubtype recombinant forms. AIDS Res. Hum. Retroviruses. 2006;22:724–733. doi: 10.1089/aid.2006.22.724. [DOI] [PubMed] [Google Scholar]
- Pérez L., Kourí V., Alemán Y. Antiretroviral drug resistance in HIV-1 therapy-naive patients in Cuba. Infect. Genet. Evol. 2013;16:144–150. doi: 10.1016/j.meegid.2013.02.002. [DOI] [PubMed] [Google Scholar]
- Pineda-Peña A.-C., Faria N.R., Imbrechts S. Automated subtyping of HIV-1 genetic sequences for clinical and surveillance purposes: performance evaluation of the new REGA version 3 and seven other tools. Infect. Genet. Evol. 2013;19:337–348. doi: 10.1016/j.meegid.2013.04.032. [DOI] [PubMed] [Google Scholar]
- Price M.N., Dehal P.S., Arkin A.P. FastTree 2—approximately maximum-likelihood trees for large alignments. PLoS ONE. 2010;5:e9490. doi: 10.1371/journal.pone.0009490. [DOI] [PMC free article] [PubMed] [Google Scholar]
- Pushker R., Jacqué J.-M., Shields D.C. Meta-analysis to test the association of HIV-1 nef amino acid differences and deletions with disease progression. J. Virol. 2010;84:3644–3653. doi: 10.1128/JVI.01959-09. [DOI] [PMC free article] [PubMed] [Google Scholar]
- Ragonnet-Cronin M., Hodcroft E., Hué S. Automated analysis of phylogenetic clusters. BMC Bioinforma. 2013;14:317. doi: 10.1186/1471-2105-14-317. [DOI] [PMC free article] [PubMed] [Google Scholar]
- Roberts L., Passmore J.S., Williamson C. Disease progression. 2011;24:819–831. doi: 10.1097/QAD.0b013e3283367836. [DOI] [PMC free article] [PubMed] [Google Scholar]
- Rutledge T.F., Boyd M.F. 2008. Morbidity and Mortality Weekly Report Revised Surveillance Case Definitions for HIV Infection Among Adults, Adolescents, and Children Aged < 18 Months and for HIV Infection and AIDS Among Children Aged 18 Months to < 13 Years — United States; p. 57. (depa. 2008) [PubMed] [Google Scholar]
- Sapsutthipas S., Tsuchiya N., Pathipavanich P. CRF01_AE-specific neutralizing activity observed in plasma derived from HIV-1-infected Thai patients residing in northern Thailand: comparison of neutralizing breadth and potency between plasma derived from rapid and slow progressors. PLoS ONE. 2013;8:e53920. doi: 10.1371/journal.pone.0053920. [DOI] [PMC free article] [PubMed] [Google Scholar]
- Secor W.E. The effects of schistosomiasis on HIV/AIDS infection, progression and transmission. Curr. Opin. HIV AIDS. 2012;7:254–259. doi: 10.1097/COH.0b013e328351b9e3. [DOI] [PMC free article] [PubMed] [Google Scholar]
- Sierra M., Thomson M.M., Posada D. Identification of 3 phylogenetically related HIV-1 BG intersubtype circulating recombinant forms in Cuba. J. Acquir. Immune Defic. Syndr. 2007;45:151–160. doi: 10.1097/QAI.0b013e318046ea47. [DOI] [PubMed] [Google Scholar]
- Stamatakis A. RAxML-VI-HPC: maximum likelihood-based phylogenetic analyses with thousands of taxa and mixed models. Bioinformatics. 2006;22:2688–2690. doi: 10.1093/bioinformatics/btl446. [DOI] [PubMed] [Google Scholar]
- Struck D., Perez-Bercoff D., Devaux C.S.J. 8th European HIV Drug Resistance Workshop. 2010. COMET: a novel approach to HIV-1 subtype prediction. [Google Scholar]
- Tamura K., Peterson D., Peterson N., Stecher G., Nei M., Kumar S. MEGA5: molecular evolutionary genetics analysis using maximum likelihood, evolutionary distance, and maximum parsimony methods. Mol. Biol. Evol. 2011;28:2731–2739. doi: 10.1093/molbev/msr121. [DOI] [PMC free article] [PubMed] [Google Scholar]
- Theys K., Deforche K., Vercauteren J. Treatment-associated polymorphisms in protease are significantly associated with higher viral load and lower CD4 count in newly diagnosed drug-naive HIV-1 infected patients. Retrovirology. 2012;9:81. doi: 10.1186/1742-4690-9-81. [DOI] [PMC free article] [PubMed] [Google Scholar]
- Thomson M.M., Nájera R. Molecular epidemiology of HIV-1 variants in the global AIDS pandemic: an update. AIDS Rev. 2005;7:210–224. [PubMed] [Google Scholar]
- Tscherning C., Alaeus A., Fredriksson R. Differences in chemokine co-receptor usage between genetic subtypes of HIV-1. Virology. 1998;241:181–188. doi: 10.1006/viro.1997.8980. [DOI] [PubMed] [Google Scholar]
- Van Laethem K., Schrooten Y., Lemey P. A genotypic resistance assay for the detection of drug resistance in the human immunodeficiency virus type 1 envelope gene. J. Virol. Methods. 2005;123:25–34. doi: 10.1016/j.jviromet.2004.09.003. [DOI] [PubMed] [Google Scholar]
- Vandekerckhove L.P.R., Wensing A.M.J., Kaiser R. European guidelines on the clinical management of HIV-1 tropism testing. Lancet Infect. Dis. 2011;11:394–407. doi: 10.1016/S1473-3099(10)70319-4. [DOI] [PubMed] [Google Scholar]
- Vaughan H.E., Cane P., Pillay D., Tedder R.S. Characterization of HIV type 1 clades in the Caribbean using pol gene sequences. AIDS Res. Hum. Retroviruses. 2003;19:929–932. doi: 10.1089/088922203322493120. [DOI] [PubMed] [Google Scholar]
- Wang B. Viral factors in non-progression. Front. Immunol. 2013;4:355. doi: 10.3389/fimmu.2013.00355. [DOI] [PMC free article] [PubMed] [Google Scholar]
Associated Data
This section collects any data citations, data availability statements, or supplementary materials included in this article.
Supplementary Materials
Nucleotide sequence accession numbers. Pol and V3 loop sequences were deposited in GenBank under the described accession numbers.