

Abstract
Background
California treats the largest population of opioid dependent individuals in the US and is among a small group of states that applies regulations for opioid treatment that are more stringent than existing federal regulations. We aim to characterize changes in patient characteristics and treatment utilization over time, and identify determinants of successful completion of detoxification and MMT retention in repeated attempts.
Methods
State-wide administrative data was obtained from California Outcome Measurement System during the period: January 1st, 1991 to March 31st, 2012. Short-term detoxification treatment and long-term maintenance treatment, primarily with methadone, was available to study participants. Mixed effects regression models were used to define determinants of successful completion of the detoxification treatment protocol (as classified by treatment staff) and duration of maintenance treatment.
Results
The study sample consisted of 237,709 unique individuals and 885,971 treatment episodes; 83.7% were detoxification treatment episodes in 1994, dropping to 40.5% in 2010. Among individuals accessing only detoxification, the adjusted odds of success declined with each successive attempt (vs. 1st attempt: 2nd: OR: 0.679; 95% CI (0.610, 0.755); 3rd: 0.557 (0.484, 0.641); 4th: 0.526 (0.445, 0.622); 5th: 0.407 (0.334, 0.497); ≥6th: 0.339 (0.288, 0.399). For those ever accessing maintenance treatment, later subsequent attempts were longer in duration, and those with two or more prior attempts at detoxification had marginally longer subsequent maintenance episodes (hazard ratio: 0.97; 95% CI: 0.95, 0.99). Finally, only 10.9% of all detoxification episodes were followed by admission into maintenance treatment within 14 days.
Conclusions
This study has revealed high rates of detoxification treatment for opioid dependence in California throughout the study period, and decreasing odds of success in repeated attempts at detoxification.
Keywords: opioid dependence, detoxification treatment, methadone treatment, longitudinal
1. INTRODUCTION
The most populous state in the USA, California treats the largest population of opioid dependent individuals (Substance Abuse and Mental Health Services Administration (SAMHSA), 2011) and is among a small group of states that applies regulations for opioid treatment that are more stringent than existing federal regulations. Specifically, to qualify for admission to methadone maintenance treatment (MMT) federal regulations require fulfilment of diagnostic criteria and documentation of at least a one-year history of opioid dependence. In contrast, California regulations require a two-year documented history and, in addition to fulfilment of diagnostic criteria, two failed attempts at detoxification. Further, federal regulations do not limit the duration of detoxification treatment whereas California regulations limit it to 21 days. Individual and programmatic exceptions for long-term detoxification (up to 180 days) and immediate access to maintenance treatment (as opposed to requiring two failed detoxification attempts) are available in California and are believed to be widely applied. Finally, federal regulations specify that no patient may be admitted to the same detoxification program more than twice in a one year period without a patient-specific federal waiver. Although California regulations do not limit the number of admissions for detoxification, the state additionally requires at least seven days between detoxification treatment episodes (Stephenson, 2008).
Limited-term treatment for opioid-dependence is inconsistent with the disease’s known chronic, recurrent course (McLellan et al., 2000). Systematic reviews of detoxification for opioid dependence have noted high rates of relapse, and suggest that the goal of detoxification should not be to provide treatment per se but rather to remove or reduce dependence on heroin in a controlled fashion (Amato et al., 2004; SAMHSA, 2006). Critically, opioid-dependent individuals are exposed to substantially elevated risk of mortality when out of treatment. In a systematic review of heroin users in either detoxification or maintenance-oriented treatment, the relative risk of mortality out-of-treatment was estimated to be 2.4 times greater than during treatment (Degenhardt et al., 2011). Further, a population-level study of opioid substitution treatment clients in Australia found the risk of mortality peaks in the two weeks following initiation, and discontinuation of treatment (Degenhardt et al., 2009).
California’s opioid dependence treatment guidelines acknowledge the limitations of detoxification and the caveat that it should not be considered treatment for opioid dependence (Stephenson, 2008), yet it remains state-wide policy. As of March, 2010, California featured 146 state-certified opioid treatment programs; 93.0% offered only methadone detoxification, while 7.0% offered MMT (compared to 31.3% nationally; SAMHSA, 2010).
To be clear, MMT is the most effective form of treatment for opioid dependence (SAMHSA, 2010). Prolonged retention in methadone treatment typically results in decreases in illicit drug use, HIV risk behaviours, and acquisitive crime (Amato et al., 2005). While programmatic restrictions have had mixed results (Ball and Ross, 1991; McCarthy and Borders, 1985; Peles et al., 2006), higher daily doses (Faggiano et al., 2003; Nosyk et al., 2009) are known predictors of positive outcome, and retention improves in subsequent treatment attempts (Nosyk et al., 2009). Further, MMT can provide positive synergies with the treatment and prevention of HIV and Hepatitis C Virus (Volkow and Montaner, 2011; Alter and Liang, 2012).
Nationally, two key changes in the opioid dependence epidemic and treatment delivery occurred over the past 20 years. First, buprenorphine treatment was introduced into office-based settings in 2003 (US Food and Drug Administration, 2002). By 2008, it was estimated that some 140,000 patients in the US were receiving maintenance treatment using buprenorphine (Kleber, 2008). Second, prescribed opioids (PO) rapidly displaced heroin as the most prevalent opioids abused in America. It is estimated that there are approximately 2.3 million individuals in the USA with opioid dependence or abuse, 1.9 million of which abuse POs (SAMHSA, 2009).
It is within this context that we evaluate outcomes for the treatment of opioid dependence in the state of California. Using population-level data on opioid treatment in publicly-funded facilities from 1991-2012, we consider repeated attempts at opioid detoxification and MMT over time for a cohort of nearly a quarter-million unique individuals. We focus specifically on characterizing changes in patient characteristics and treatment utilization over time, and identifying determinants of successful completion of detoxification and MMT retention in repeated attempts.
2. METHODS
2.1 Study population
The study population included all individuals presenting for MMT in publicly-funded drug treatment centers (DTCs) in California from January 1st, 1991 to March 31st, 2012. Information received from all treatment programs receiving state or federal funding are recorded by the California Department of Alcohol and Drug Programs (ADP; California Department of Alcohol and Drug Programs, 2012, 2005). Each DTC licensed to dispense methadone in California is required to submit data on each client admitted to their program monthly to the state alcohol and drug programs office regardless of funding source (California Department of Alcohol and Drug Programs, 2012). There are 5 Veteran’s Health Administration-based DTCs that do not submit data to the system; as a result, opioid agonist treatment clients receiving treatment solely from these facilities were excluded from the analysis.
2.2 Data Collection
Data was entered into the California Alcohol and Drug Data System (CADDS) from 1991-2006, and the California Outcomes Monitoring system (CalOMS) from 2006-2011. Data compliance standards (Hser et al., 2003) specify data should be submitted each month and no later than 45 days after the end of the report month (i.e., the calendar month in which the admissions, discharges, or annual updates occur). Also, admission and discharge records can be corrected or deleted anytime within 75 days. Providers inspect and verify data compliance and quality through automated summary reports. Standard documentation (written, online, and periodic in-person training) is available to providers reporting to the system, and many specific research studies or county initiatives have included training for providers and have assessed compliance (Rawson and Crevecouer, 2005; Urada et al., 2010; Breslow and Clayton, 1993).
Treatment program staff entered information on medication or treatment type, individual demographic, drug use and other information at admission. At discharge, staff classify disposition of the episode as (completed treatment/recovery plan; left before completion, with satisfactory progress; left before completion, with unsatisfactory progress, or referred or transferred for further treatment). Discharge records are filed for methadone detoxification when the participant has missed appointments for ≥3 consecutive days without notifying the program, or in MMT, when the participant has missed appointments for ≥14 days without notifying the program.
Successive treatment episodes were merged when discharge and subsequent admission dates were within the 3- and 14-day discontinuation thresholds for detoxification and maintenance episodes, respectively, however detoxification episodes directly preceding maintenance episodes (ie. discharge within 3 days of maintenance treatment initiation) were not merged as transition from detoxification into a maintenance program can be considered a successful outcome and was thus an explicit point of analysis. The earliest available admission and latest available discharge status records of episodes consolidated from >1 treatment episode records were used. Otherwise, discharge dates were imputed if records were not available for episode t, but a subsequent episode t+1 was later initiated; in this case we assumed a discharge date of (episode start date(t+1) – 14) for episode t. Alternately, we assumed the population median durations of detoxification and maintenance episodes in sensitivity analysis.
2.3 Measures
2.3.1 Dependent variables
For detoxification episodes, the primary outcome was (reported) patient status at episode discharge. A detoxification episode was classified as ‘successful’ if treatment program staff classified the episode as “successful completion” or “left treatment early but with satisfactory progress”. Alternate classifications of success were tested in sensitivity analysis. Detoxification episodes were classified as unsuccessful if no discharge status records were available. For maintenance episodes, the primary outcome was the duration of treatment calculated as the difference of the discharge and admission dates. Maintenance episodes ongoing after March 16th, 2012 were considered censored.
2.3.2 Independent variables
We hypothesized that individual demographics, drug use characteristics, and characteristics of the treatment episode, facility and county influenced the selected treatment outcomes. Demographics and drug use characteristics included age, gender, ethnicity, primary drug of abuse (heroin versus prescribed opioids), primary drug use frequency, secondary drug of abuse (none; other opioid; stimulant; alcohol or marijuana), education, labour force status, and referral source (individual choice or otherwise).
Otherwise, we constructed a series of covariates indicating the number of detoxification and MMT episodes. Among those accessing MMT, a variable was created to indicate whether an individual had <2 or ≥2 successive detoxification episodes prior to the current MMT episode.
Using the reported Provider ID field in the study database, we constructed an additional covariate to capture the annual volume of treatment episodes within each site in a given calendar year. This annualized facility-specific measure for opioid treatment volume was categorized into quartiles according to the empirical distribution of the episodic dataset. Finally, using the patient-level county field in the admission records, we linked a county-level covariate capturing the unemployment rate in a given calendar year. Once again, this annualized, county-specific measure was categorized into quartiles. A linear time trend variable was also included to capture the underlying trend in treatment outcomes over time.
2.4 Data Analysis
Our analysis was executed in three steps. First, the characteristics of clients recording a treatment episode were summarized by calendar year and plotted to present changes in individual demographic and drug use characteristics as well as aspects of treatment delivery and treatment outcomes during the 20-year study period.
Second, we aimed to determine the effect of repeated attempts at detoxification treatment on the probability of successful detoxification, controlling for the individual, provider and geographic covariates described above. A multivariate logistic regression analysis was executed to test this relationship. The model was fitted using generalized linear mixed modelling, specified with a binomial distribution and log link function (Therneau and Grambsch, 2000). We also estimated the effects of repeated attempts at maintenance treatment, as well as the effects of prior detoxification treatment episodes, on the duration of maintenance treatment, adjusting for the covariate set described above. The model was fitted using Cox proportional hazards frailty models (Raudenbush and Bryk, 2003). Both techniques account for intra-individual correlation across repeated detoxification and maintenance episodes, respectively, and capture unmeasured confounding which is fixed over time (Nosyk et al., 2013). Due to the large number of observations, models were executed on random samples of the study population, with sample sizes informed empirically.1
Finally, there is likely a level of subjectivity and heterogeneity in reporting standards, both cross-sectionally and longitudinally, in the classification of successful completion of detoxification. The California opioid treatment guidelines and other sources have suggested that success in opioid detoxification should be defined by subsequent linkage to MMT (Stephenson, 2008). In contrast, treatment-re-initiation following unsuccessful detoxification can be considered evidence of drug relapse. We therefore estimated the time-to-treatment (any treatment and MMT only, respectively) initiation following successful and unsuccessful detoxification, comparing these durations using the Wilcoxon rank sum test. Analyses were executed using SAS version 9.3 and R, version 5.1 statistical software packages.
3. RESULTS
3.1 Study population
Over 21 years of observation, 237,709 unique individuals accounting for 885,971 treatment episodes were captured; 95,427 individuals accessed only detoxification (192,252 episodes, 30.2% of all episodes) and 142,282 individuals accessed MMT (693,719 episodes, 39.0% of which were MMT episodes). Over 70% of the ‘detoxification only’ cohort initiated treatment before 2002, while 60.1% of the ‘ever maintenance’ cohort initiated treatment post-2002 (Table 1). Those accessing MMT were older, more likely to be white and male, and less likely to be daily users (a figure attributable to those detoxifying prior to entering maintenance treatment). For those ever accessing MMT, 12.1% had four or more maintenance episodes, while 7.8% had ten or more detoxification episodes, compared to 2.3% among those accessing only detoxification.
Table 1.
Summary statistics on opioid treatment utilization and outcomes: 1991-2011
| Total Unique Episodes | Detoxification Episodes | Successful detoxification | Maintenance Epidoes | 3-month Retention | 12-month Retention | Censored | |||||||
|---|---|---|---|---|---|---|---|---|---|---|---|---|---|
| N | N | % | N | % | N | % | N | % | N | % | N | % | |
| 1991 | 35,874 | 25,141 | 70.08 | 6,756 | 26.87 | 10,733 | 29.92 | 8,011 | 74.64 | 4,138 | 38.55 | 493 | 4.59 |
| 1992 | 59,803 | 48,020 | 80.30 | 13,156 | 27.40 | 11,783 | 19.70 | 9,588 | 81.37 | 5,060 | 42.94 | 1,133 | 9.62 |
| 1993 | 67,008 | 55,949 | 83.50 | 19,136 | 34.20 | 11,059 | 16.50 | 9,310 | 84.18 | 4,734 | 42.81 | 937 | 8.47 |
| 1994 | 70,364 | 58,908 | 83.72 | 20,327 | 34.51 | 11,456 | 16.28 | 9,566 | 83.50 | 5,282 | 46.11 | 940 | 8.21 |
| 1995 | 68,248 | 55,697 | 81.61 | 19,144 | 34.37 | 12,551 | 18.39 | 10,671 | 85.02 | 6,266 | 49.92 | 1,204 | 9.59 |
| 1996 | 63,749 | 51,307 | 80.48 | 16,955 | 33.05 | 12,442 | 19.52 | 9,888 | 79.47 | 5,434 | 43.67 | 846 | 6.80 |
| 1997 | 56,830 | 44,274 | 77.91 | 14,142 | 31.94 | 12,556 | 22.09 | 9,604 | 76.49 | 5,314 | 42.32 | 814 | 6.48 |
| 1998 | 54,900 | 42,510 | 77.43 | 12,772 | 30.04 | 12,390 | 22.57 | 9,486 | 76.56 | 5,452 | 44.00 | 862 | 6.96 |
| 1999 | 55,012 | 42,422 | 77.11 | 12,048 | 28.40 | 12,590 | 22.89 | 9,539 | 75.77 | 5,368 | 42.64 | 937 | 7.44 |
| 2000 | 52,839 | 39,636 | 75.01 | 11,191 | 28.23 | 13,203 | 24.99 | 10,653 | 80.69 | 6,214 | 47.07 | 1,409 | 10.67 |
| 2001 | 45,592 | 32,224 | 70.68 | 9,413 | 29.21 | 13,368 | 29.32 | 10,714 | 80.15 | 6,097 | 45.61 | 1,443 | 10.79 |
| 2002 | 37,397 | 24,846 | 66.44 | 7,451 | 29.99 | 12,551 | 33.56 | 9,885 | 78.76 | 5,579 | 44.45 | 1,501 | 11.96 |
| 2003 | 30,421 | 18,430 | 60.58 | 6,296 | 34.16 | 11,991 | 39.42 | 9,032 | 75.32 | 5,141 | 42.87 | 1,353 | 11.28 |
| 2004 | 29,943 | 18,057 | 60.30 | 6,097 | 33.77 | 11,886 | 39.70 | 9,349 | 78.66 | 5,470 | 46.02 | 1,725 | 14.51 |
| 2005 | 25,446 | 13,370 | 52.54 | 4,439 | 33.20 | 12,076 | 47.46 | 9,643 | 79.85 | 5,856 | 48.49 | 2,246 | 18.60 |
| 2006 | 23,216 | 10,218 | 44.01 | 4,708 | 46.08 | 12,998 | 55.99 | 9,842 | 75.72 | 5,629 | 43.31 | 1,996 | 15.36 |
| 2007 | 22,581 | 9,643 | 42.70 | 4,301 | 44.60 | 12,938 | 57.30 | 9,959 | 76.97 | 5,419 | 41.88 | 2,173 | 16.80 |
| 2008 | 22,302 | 9,695 | 43.47 | 4,665 | 48.12 | 12,607 | 56.53 | 10,333 | 81.96 | 5,756 | 45.66 | 2,708 | 21.48 |
| 2009 | 22,147 | 8,968 | 40.49 | 4,895 | 54.58 | 13,179 | 59.51 | 10,434 | 79.17 | 5,753 | 43.65 | 3,371 | 25.58 |
| 2010 | 21,021 | 8,347 | 39.71 | 4,488 | 53.77 | 12,674 | 60.29 | 9,625 | 75.94 | 5,201 | 41.04 | 3,995 | 31.52 |
| 2011 | 21,278 | 8,195 | 38.51 | 4,358 | 53.18 | 13,083 | 61.49 | 9,422 | 72.02 | -- | 6,556 | ||
3.2 Treatment modalities and outcomes
Individuals had a median 2 (IQR:1-4) opioid treatment episodes during the study period. The annual number of new admissions peaked in 1994 (70,364) and fell to 21,021 in 2010; within these years, detoxification admissions fell from 83.7% to 40.5% (Table 2). Rates of successful detoxification ranged from 26.8 to 34.5% in the CADDS-era, and 44.6% - 54.6% in the CalOMS- era. Retention rates in MMT at 3 and 12 months were 75.9% and 41.8%, respectively, in 2010, changing little over time.
Table 2.
Client Characteristics at treatment initiation
| Detoxification only | Ever accessed MMT | Total | |
|---|---|---|---|
| [N=95,427 individuals] | [N=142,282 individuals] | [N=237,709 individuals] | |
| Calendar year of initiation, % | |||
| 1991-1996 | 44.7 | 19.4 | 29.8 |
| 1997-2001 | 27.8 | 20.5 | 23.5 |
| 2002-2006 | 14.8 | 23.8 | 20.1 |
| 2007-2012 | 12.7 | 36.3 | 26.6 |
| Gender, % | |||
| Male | 70.3 | 62.4 | 65.6 |
| Female | 29.7 | 37.6 | 34.4 |
| Age at admission, % | |||
| < 18 | 0.28 | 0.15 | 0.20 |
| 18 - 30 | 23.5 | 16.1 | 19.1 |
| 30 - 40 | 34.1 | 27.1 | 29.9 |
| 40 - 50 | 29.5 | 32.9 | 31.5 |
| ≥ 50 | 12.6 | 23.8 | 19.3 |
| Race/Ethnicity, % | |||
| White | 50.5 | 56.5 | 54.1 |
| Black | 12.6 | 11.1 | 11.7 |
| Hispanic | 31.1 | 26.1 | 28.1 |
| Other | 5.8 | 6.3 | 6.1 |
| Educational attainment, % | |||
| Less than High School | 36.3 | 35.8 | 36.0 |
| High School/Equivalent | 63.7 | 64.2 | 64.0 |
| Age at first use, % | |||
| < 16 | 13.9 | 16.4 | 15.4 |
| 16 – 30 | 67.9 | 67.7 | 67.8 |
| ≥ 50 | 18.3 | 15.9 | 16.8 |
| Primary drug type, % | |||
| Heroin | 92.4 | 87.0 | 89.1 |
| Other | 7.6 | 13.0 | 10.9 |
| Frequency of primary drug use, % | |||
| Daily | 94.5 | 75.6 | 83.2 |
| Not daily | 5.5 | 24.4 | 16.8 |
| Secondary drug problem type, % | |||
| Methamphetamine or cocaine | 25.4 | 21.8 | 23.3 |
| Alcohol | 5.6 | 5.7 | 5.7 |
| Marijuana | 2.6 | 2.9 | 2.8 |
| Heroin | 0.5 | 1.0 | 0.8 |
| Other | 4.1 | 6.9 | 5.8 |
| None | 61.8 | 61.6 | 61.7 |
| Criminal justice involvementa, % | |||
| Yes | 13.4 | 14.5 | 14.1 |
| No | 86.1 | 85.5 | 86.0 |
| Labor Force Status, % | |||
| Unemployed, out of labor force | 71.2 | 72.6 | 72.0 |
| Employed (full- time) | 20.6 | 18.8 | 19.5 |
| Employed (part- time) | 8.2 | 8.7 | 8.5 |
| Referral source, % | |||
| Self | 91.5 | 89.0 | 90.0 |
| Other | 8.5 | 11.0 | 9.8 |
| Number of detoxification episodes, % | |||
| 0 | 0 | 36.3 | 21.7 |
| 1 | 64.3 | 18.5 | 36.9 |
| 2 – 5 | 29.4 | 28.1 | 28.6 |
| 6 – 9 | 4.1 | 9.3 | 7.2 |
| 10+ | 2.3 | 7.8 | 5.6 |
| Number of maintenance episodes, % | |||
| 0 | 100 | 0 | 40.1 |
| 1 | 0 | 58.3 | 34.9 |
| 2 – 3 | 0 | 29.6 | 17.7 |
| 4+ | 0 | 12.1 | 7.2 |
| Length of treatment, mean (median) days | 262.7 (20.0) | 1616.3 (752.0) | -- |
| Number of episodes at provider, mean (median) | 931.1 (790.0) | 623.3 (441.0) | -- |
| Unemployment rate, mean (median) | 0.078 (0.069) | 0.079 (0.070) | -- |
Includes, probation, parole, awaiting charges, incarceration, court-mandated treatment admission.
3.3 Changes in client demographics and drug use patterns
Admissions of individuals under 30 rose from 18.9% in 2003 to 33.1% in 2012 (Figure 1, Panel A). Otherwise aging of the large 30-39 year old age cohort, comprising 48.0% of all admissions in 1991, is observed through two decades; 40-49 year olds comprised 38.8% of all admissions in 2001 and 50-59 year olds comprised 29.1% of all admissions in 2008. The ethnic mix of clients presenting for opioid treatment has changed over time, with blacks comprising a growing proportion of those admitted (Figure 1, Panel B). The majority of clients have been unemployed or out of the labour force (Figure 1, Panel C). A growing proportion reported having a medical disability (rising to 20.2% in 2012; Figure 1, Panel D).
Figure 1.
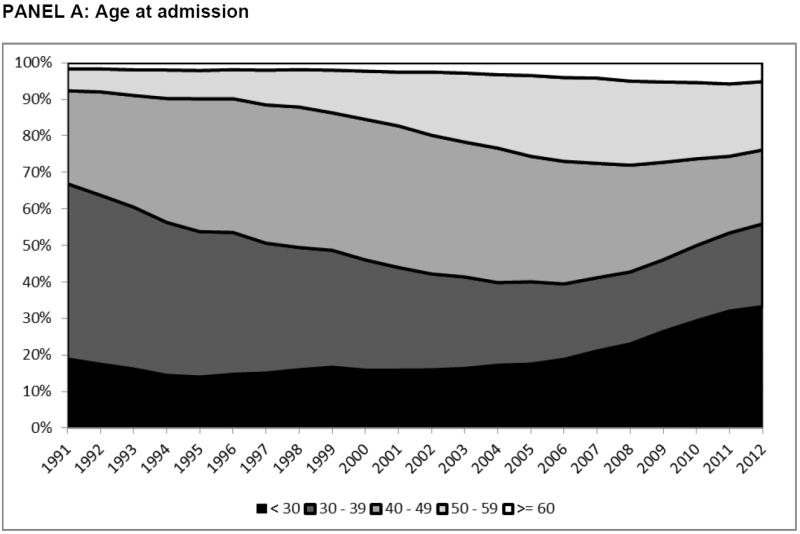
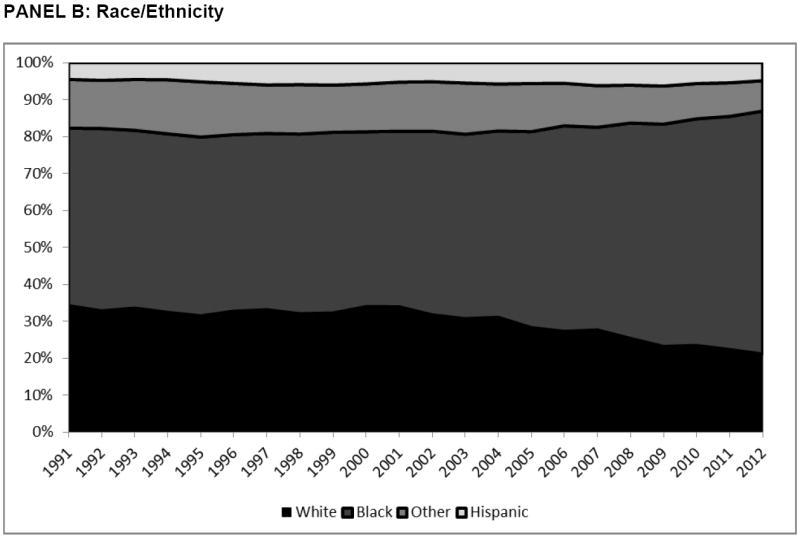
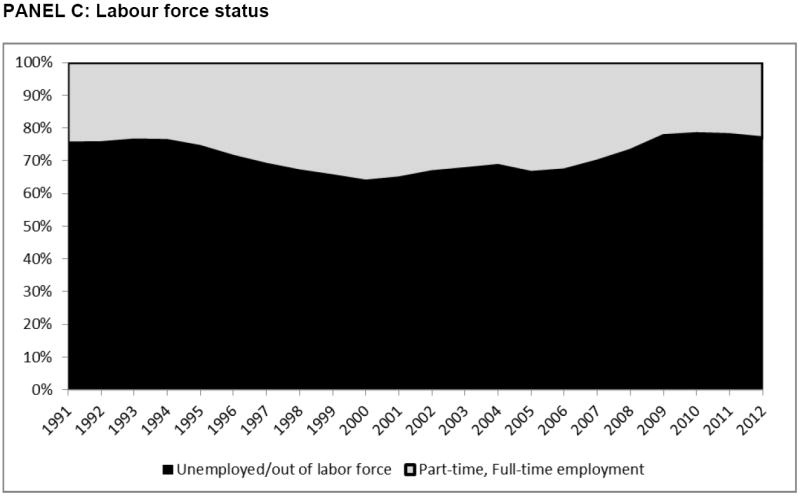
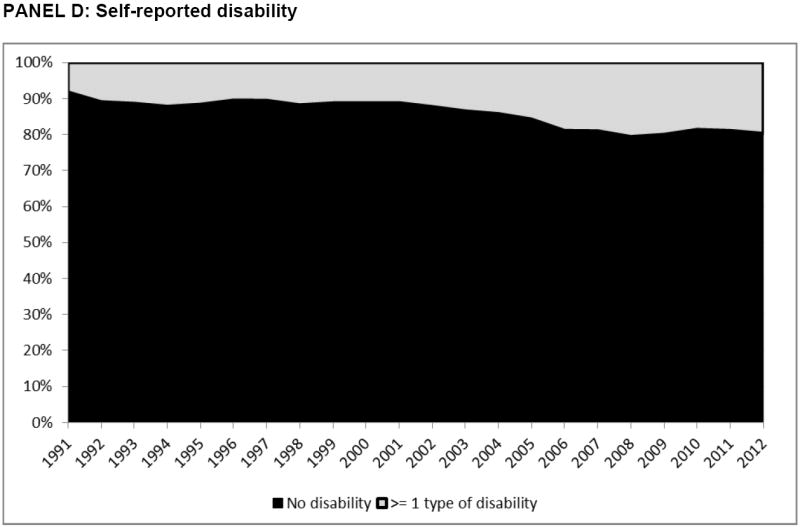
Temporal trends in demographic characteristics of clients entering treatment, by calendar year.
*2012 figures represent the period: 01/01/2012-03/31/2012
Further, a growing proportion of individuals presenting for opioid treatment reported prescribed opioids as their primary drug of abuse (Figure 2, Panel A), increasing from 3.1% in 2001 to 25.0% in 2012. This shift has coincided with changes in self-reported drug use frequency; while daily use (≥25 days in the past 30) remains by far the most common, rates of less-than-daily use have risen to 19.7% in 2012 (Figure 2, Panel B).
Figure 2.
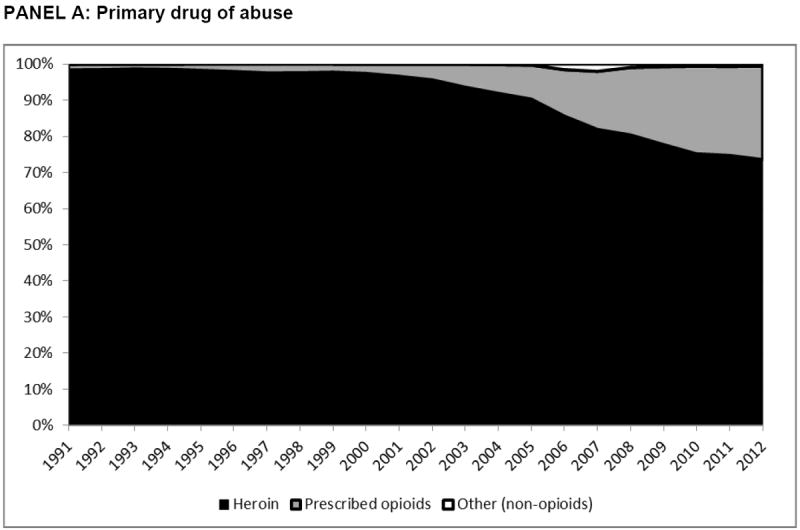
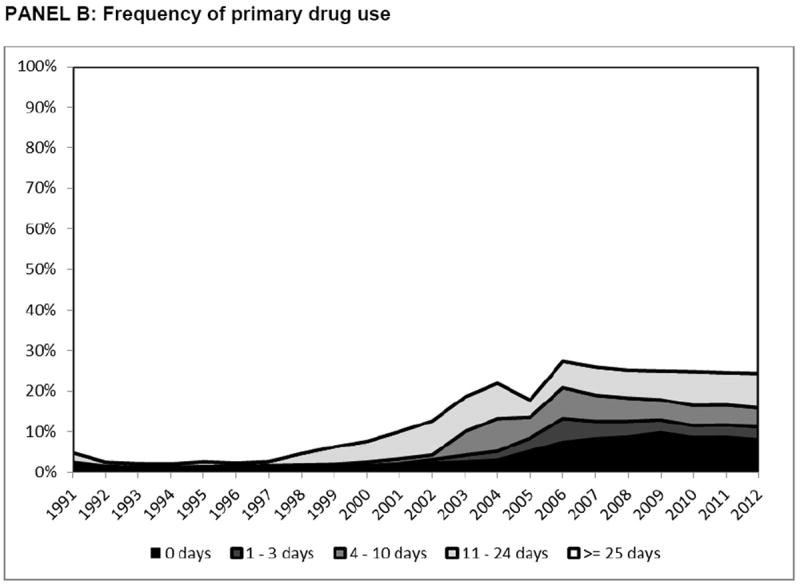
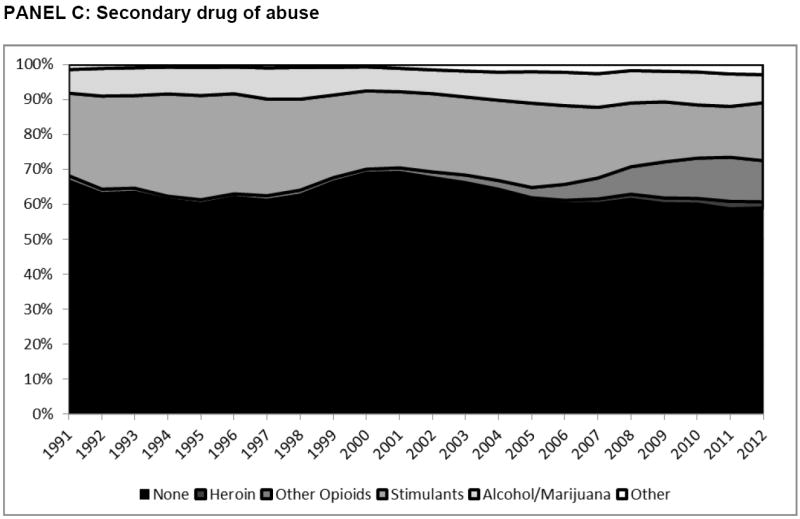
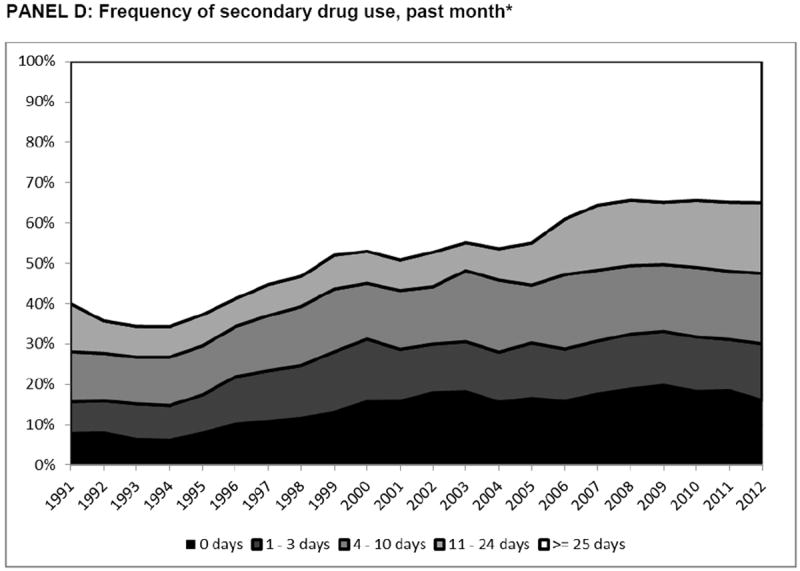
Temporal trends in drug use characteristics of clients entering treatment, by calendar year.
*2012 figures represent the period: 01/01/2012-03/31/2012
Finally, the proportion of MMT entrants with 1 or ≥2 detoxification attempts reached a high of 66.5% in 1994, decreasing thereafter. 30.1% of those accessing MMT in 2011 did so following at least one detoxification episode (Figure 3).
Figure 3.
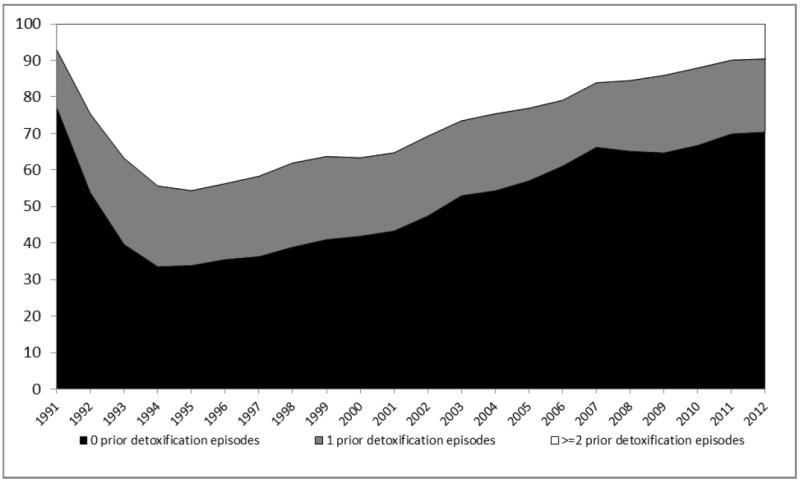
The proportion of maintenance treatment entrants with prior attempts at detoxification treatment: 1991-2012.
3.4 Analyses on the probability of successful detoxification
Multiple regression analysis on the adjusted odds of successful detoxification among those never accessing MMT was presented in Table 3. The adjusted odds of successful detoxification decreased with each successive attempt; individuals’ second detoxification attempt was 32% less likely to be successful than their first, (odds ratio:0.679; 95% confidence interval: (0.610,0.755)), their third was 44% (0.557(0.484,0.641)) less likely to be successful than their first, and so forth.
Table 3.
Results of multiple regression analyses on the probability of successful detoxification treatment
| AOR | 95% CI | ||
|---|---|---|---|
| Detoxification treatment attempt (vs. 1st attempt): 2nd attempt | 0.679 | 0.610 | 0.755 |
| 3rd attempt | 0.557 | 0.484 | 0.641 |
| 4th attempt | 0.526 | 0.445 | 0.622 |
| 5th attempt | 0.407 | 0.334 | 0.497 |
| ≥6th attempt | 0.339 | 0.288 | 0.399 |
| Prior successful Detoxification (vs. None) | 2.284 | 1.996 | 2.613 |
| Calendar year | 1.011 | 1.002 | 1.020 |
| Gender (vs. Female): Male | 0.897 | 0.824 | 0.977 |
| Age at admission (vs. <30): 30 – 39 | 1.004 | 0.908 | 1.111 |
| 40 – 49 | 1.166 | 1.048 | 1.298 |
| ≥ 50 | 1.325 | 1.152 | 1.522 |
| Race/Ethnicity (vs. White): Black | 1.007 | 0.892 | 1.137 |
| Hispanic | 0.907 | 0.829 | 0.992 |
| Other | 0.874 | 0.741 | 1.031 |
| Education (vs. <High School): High school or greater | 0.991 | 0.914 | 1.074 |
| Labor Force Status (vs. full-time employment): part-time | 0.903 | 0.782 | 1.042 |
| Unemployed, out of labor force | 1.115 | 1.018 | 1.221 |
| Current criminal justice involvement* (vs. none) | 1.005 | 0.905 | 1.116 |
| Age at first use: 16-30 (vs. <16) | 0.996 | 0.894 | 1.111 |
| ≥ 30 | 1.046 | 0.915 | 1.197 |
| Primary Drug of abuse: Prescribed opioids (vs. Heroin) | 1.843 | 1.558 | 2.181 |
| Frequency of primary drug use (vs. non-daily): Daily | 0.721 | 0.608 | 0.855 |
| Secondary Drug of abuse: Alcohol/Marijuana (vs. None) | 1.320 | 1.161 | 1.502 |
| Opioid | 1.222 | 1.001 | 1.492 |
| Stimulants | 1.005 | 0.924 | 1.092 |
| Provider treatment volume (vs. 1st quartile): 2nd quartile | 0.653 | 0.590 | 0.723 |
| 3rd quartile | 0.658 | 0.592 | 0.733 |
| 4th quartile | 0.671 | 0.598 | 0.752 |
| Unemployment rate (vs. 1st quartile): 2nd quartile | 1.106 | 0.999 | 1.224 |
| 3rd quartile | 0.822 | 0.736 | 0.919 |
| 4th quartile | 0.844 | 0.760 | 0.938 |
AOR: Adjusted Odds Ratio; 95% CI: 95% confidence interval. Bold indicates null hypothesis of no statistically significant effect is rejected at alpha = 0.05.
The adjusted odds of success were lowest among young (under 30) and hispanic individuals were less likely to succeed than white. Primary users of POs were nearly 85% more likely to succeed than heroin users (1.843(1.558,2.181)). Those reporting secondary use of other opioids and alcohol or marijuana had higher odds of successful detoxification. Furthermore, individuals treated in higher-volume treatment centres had lower odds of success. Sensitivity analysis on the classification of successful detoxification demonstrated the robustness of the key findings.
3.5 Analyses on the duration of maintenance treatment
Multiple regression analysis on the hazard of MMT discontinuation in repeated treatment attempts was presented in Table 4. Later subsequent attempts at MMT increased in duration (2nd attempt: hazard ratio:0.961; 95% confidence interval:(0.950,0.989) vs. 1st attempt; 3rd attempt:0.959(0.934,0.985); ≥4th attempt:0.943(0.0.917,0.970)). Ever having successful detoxification was associated with longer subsequent MMT durations (0.862(0.845,0.879)). Having ≥2 immediate prior attempts at detoxification was associated with slightly longer subsequent MMT episodes (0.971(0.952,0.991)).
Table 4.
Result of multiple regression analyses on the time-to-discontinuation of MMT
| AHR | 95% CI | ||
|---|---|---|---|
| Maintenance treatment attempt (vs. 1st attempt): 2nd attempt | 0.961 | 0.950 | 0.989 |
| 3rd attempt | 0.959 | 0.934 | 0.985 |
| ≥4th attempt | 0.943 | 0.917 | 0.970 |
| Prior successful detoxification (vs. None) | 0.862 | 0.845 | 0.879 |
| ≥ 2 prior detoxification episodes (vs. None) | 0.971 | 0.952 | 0.991 |
| Calendar year | 1.008 | 1.006 | 1.010 |
| Gender (vs. Female): Male | 1.224 | 1.200 | 1.248 |
| Age at admission (vs. <30): 30 - 39 | 0.866 | 0.843 | 0.889 |
| 40 – 49 | 0.717 | 0.698 | 0.737 |
| ≥ 50 | 0.589 | 0.571 | 0.608 |
| Race/Ethnicity (vs. White): Black | 1.072 | 1.031 | 1.105 |
| Hispanic | 1.053 | 1.040 | 1.075 |
| Other | 0.956 | 0.921 | 0.993 |
| Education (vs. <High School): High school or greater | 1.015 | 0.996 | 1.034 |
| Labor Force Status (vs. full-time employment): part-time | 1.070 | 1.035 | 1.105 |
| Unemployed, out of labor force | 1.053 | 1.030 | 1.076 |
| Current criminal justice involvement* (vs. none) | 1.133 | 1.109 | 1.158 |
| Age at first use: 16-30 (vs. <16) | 1.023 | 0.991 | 1.046 |
| ≥ 30 | 1.107 | 1.072 | 1.142 |
| Primary Drug of abuse: Prescribed opioids (vs. Heroin) | 0.755 | 0.730 | 0.781 |
| Frequency of primary drug use (vs. non-daily): Daily | 1.492 | 1.460 | 1.525 |
| Secondary Drug of abuse: Marijuana/Alcohol (vs. None) | 1.025 | 0.995 | 1.056 |
| Opioid | 0.975 | 0.940 | 1.011 |
| Stimulant | 1.109 | 1.087 | 1.132 |
| Provider treatment volume (vs. 1st quartile): 2nd quartile | 1.068 | 1.043 | 1.094 |
| 3rd quartile | 1.194 | 1.165 | 1.223 |
| 4th quartile | 1.252 | 1.219 | 1.286 |
| Unemployment rate (vs. 1st quartile): 2nd quartile | 1.046 | 1.022 | 1.070 |
| 3rd quartile | 1.022 | 0.999 | 1.046 |
| 4th quartile | 1.125 | 1.098 | 1.153 |
AHR: Adjusted Hazard Ratio; 95% CI: 95% confidence interval.
Older age, female gender, full-time employment and no criminal justice system involvement was associated with longer treatment durations, while concurrent stimulant abuse was associated with shorter MMT durations. Primary PO users had significantly longer treatment episodes, while poly-opioid use (heroin and PO) was also associated with longer treatment durations (0.947(0.909,0.987)). Daily use had among the strongest negative impact on treatment duration (1.492(1.460,1.525)). Individuals receiving treatment at higher-volume treatment centres had significantly shorter MMT durations, while individuals receiving treatment in counties with the highest unemployment rates also had significantly shorter maintenance treatment durations, controlling for other factors. Sensitivity analyses using different definitions for imputed MMT episodes (N=24,368, 2.8%) had little impact on coefficient estimates.
3.6 Time to treatment re-initiation following detoxification
From a total of 627,687 detoxification treatment episodes, 515,555 (82.1%) were followed by treatment re-admission. Among these episodes, those successfully and unsuccessfully completing detoxification had no statistically significantly difference in time to treatment re-entry, with a median of 45 days (IQR: 13-165) vs. 41 days (12-171); p=0.298. Time to maintenance treatment initiation was not significantly different between those successfully and unsuccessfully detoxified (median: 13 days (1-92) vs. 9 days (1-95); p=0.075), however the proportion of those accessing maintenance treatment within 14 days of detoxification was lower (successful detoxification: 51.3% vs. unsuccessful detoxification: 55.3%; p<0.001). From a total of 627,687 detoxification treatment episodes observed during follow-up, only 126,761 (20.2%) were followed by admission into maintenance treatment, and only 68,282 (10.9%) were re-admitted into MMT within 14 days.
4. DISCUSSION
This study has revealed high, but decreasing rates of detoxification treatment for opioid dependence in California during the study period and decreasing odds of success in repeated attempts at detoxification for those never accessing MMT. Detoxification had a modest positive effect on subsequent MMT retention; however time to treatment re-entry was similar following successful vs. unsuccessful detoxification episodes, and a low proportion of clients transitioned to MMT following detoxification. Nonetheless, utilization of MMT increased from a low of 13% of all treatment episodes in 1994 to 58% in 2011.
Our findings on the effect of detoxification on subsequent MMT durations need to be interpreted carefully. First, the results only apply to those subsequently entering maintenance treatment; those not doing so may have relapsed to regular use, thus being exposed to a starkly elevated risk of mortality (Degenhardt et al., 2009, 2011). Second, the pattern of increasing durations of treatment in repeated attempts is consistent with results on MMT durations within this study, as well as in at least one other setting internationally (Nosyk et al., 2013), and further reinforces the characterization of ‘recovery’ from opioid dependence as a recurrent event process (Volkow and Montaner, 2011). That this pattern does not hold for success in repeated detoxification may indicate that this treatment modality, delivered in isolation of MMT, contributes little to the process of recovery (O’Connor, 2005).
These findings are directly relevant to current policies for the treatment of opioid dependence in California and throughout the US. The state requirement for two unsuccessful detoxification attempts prior to MMT entry is questionable practice given the increased risk of mortality at treatment induction and directly following discontinuation; that treatment programs now seldom follow these guidelines further weakens the case to maintain them. While patient demand for detoxification will likely remain, we have previously made the case for an informed consent process to educate clients of the inherent risks of detoxification (Nosyk et al, 2013). Our findings on the diminishing outcomes of detoxification treatment in subsequent attempts (and, alternately, improving retention in MMT in subsequent attempts) supports this recommendation.
Current clinical practices may be influenced by funding restrictions, and treatment outcomes may be influenced by the level of out-of-pocket payment attributable to the client. While individual-level data on funding source and level of co-payment was not available, California facilities are far more likely to charge on a sliding fee scale (86.8% of facilities) compared to national figures (51.1%), while a lower percentage of facilities offered no-charge treatment to those unable to pay (27.9% vs. 33.4%). Private, for-profit clinics were also more common in California than elsewhere in the US (64.3% vs. 49.3% nationally; SAMHSA, 2011). While a continuation of the trend towards greater utilization of MMT may result in increased costs to the healthcare system, sustained retention in treatment has been shown to reduce the costs of acquisitive crime and may avert potential health care costs attributable to infectious diseases like HIV and Hepatitis C (Alter and Liang, 2012; US Food and Drug Administration, 2002). As a result, prior studies have shown MMT to be highly cost-effective, if not cost-saving (Nosyk et al., 2012; Zaric et al., 2000; Rosenblum et al., 2003). Further research is required to quantify the cumulative effects of repeated detoxification, compared to the current standard of care (MMT) in terms of morbidity, mortality, and incremental costs to society.
Several other findings from the analyses were noteworthy. First, both success rates in detoxification and durations of MMT were substantially greater for PO users. This is consistent with prior studies (Moore et al., 2007; Faggiano et al., 2003), and must be viewed as quite a positive finding given the increased prevalence of PO abuse (California Alcohol and Drug Programs, 2012). Second, compared to mono-drug use, secondary use of other opioids and marijuana or alcohol was associated with better detoxification and MMT outcomes. Marijuana and alcohol had a similar effect in a previous study on durations of opioid abstinence (Zarkin et al., 2005). On the other hand, stimulant use had a negative effect on maintenance treatment outcomes. While we don’t observe use during treatment, it is plausible that users substitute other drugs during opioid agonist treatment, which may improve or diminish the likelihood of success in treatment depending on the substance. PO and heroin co-use is less understood. Heroin users may also use POs to treat chronic pain (Jones, 2013), while primary PO users may transition to heroin use (Andrews et al., 2014); the former hypothesis may be consistent with our findings.
Our analysis had several key limitations. First, there was a potential for conflated drug treatment records across individuals with a common unique personal identifier used in our study. While some degree of misclassification is inherent in using administrative databases for research purposes, we implemented a number of decision rules to minimize database errors, with methodology and results provided in the supplementary material2. Rates of censorship of maintenance episodes were low throughout the study period, suggesting limited potential for biased outcomes. We have documented our procedures for data linkage extensively3 in the interest of limiting potential for incorrect linkage. Second, treatment outcomes, and particularly the classification of successful detoxification within the databases, were not validated. To this end, we considered the time to treatment re-initiation and MMT linkage following detoxification as alternate outcomes. Third, medication dosage and other aspects of treatment occurring during the treatment episode (such as adherence to counselling services and ongoing drug abuse), were not observed in our database. Medication dosage is consistently associated with longer durations of maintenance treatment (Peles et al., 2006; Volkow and Montaner, 2011); while this omission likely confounded our results to some degree, the observed directions of effect were as hypothesized. Our data source only captured treatment provided at publicly-funded DTCs in California. As such, our study did not capture state-level variation in regulations that stipulate aspects of opioid treatment. Drug use was based on patient self-report and was not verified via urine testing. Also, we did not examine treatment episodes of individuals accessing office-based buprenorphine treatment. Buprenorphine was offered in a very small proportion of treatment episodes in our study sample (N=1,100;0.1%); exclusion of these episodes in an additional sensitivity analysis had no impact on primary results. It is unclear the extent to which individuals using DTCs transition to office-based buprenorphine treatment and vice-versa; in general, utilization and outcomes of office-based treatment with buprenorphine are under-studied. It has been suggested that office-based providers service a distinct population of generally higher socioeconomic status (Andrews et al., 2014). Finally, the long-term outcomes of treatment, including morbidity, mortality and criminality are beyond the scope of this manuscript, and the subject of future inquiry within this patient population.
Using a large-scale and long-running data system, our study has revealed high utilization and poor outcomes of opioid detoxification despite the well-known limitations of this treatment modality. In an era of fiscal austerity and of health care reform, the impact of such sub-optimal practices requires closer consideration, in the interest of maximizing the economic and public health benefits of treatment for opioid dependence.
Supplementary Material
Acknowledgments
Bohdan Nosyk is a Michael Smith Foundation for Health Research Scholar. We acknowledge the California Alcohol and Drug Program for use of the CADDS/CalOMS Tx data. This manuscript was supported by funding from Funders had no role in the design and conduct of the study; preparation, review, and approval of the manuscript; or decision to submit this manuscript for publication.
Role of Funding Source: Funding for this study was provided by the National Institutes of Health/National Institute on Drug Abuse Grant nos. R01-DA031727 and R01-DA032551, and by the University of California, Los Angeles, Integrated Substance Abuse Programs Center for Advancing Longitudinal Drug Abuse Research (CALDAR; P30-DA016383). the NIH had no further role in study design; in the collection, analysis and interpretation of data; in the writing of the report; or in the decision to submit the paper for publication.
Footnotes
Contributors Authors BN, DU, DH, EW, RR and YH aided in the design of the study and procured the data. Authors LL, EE and BN led the statistical analysis and BN wrote the first draft of the article. All authors contributed to and have approved the final manuscript.
Conflict of Interest: All authors declare that they have no conflicts of interest.
Supplementary material can be found by accessing the online version of this paper at http://dx.doi.org and by entering doi:…
Supplementary material can be found by accessing the online version of this paper at http://dx.doi.org and by entering doi:…
Supplementary material can be found by accessing the online version of this paper at http://dx.doi.org and by entering doi:…
Supplementary material can be found by accessing the online version of this paper at http://dx.doi.org and by entering doi:…
Publisher's Disclaimer: This is a PDF file of an unedited manuscript that has been accepted for publication. As a service to our customers we are providing this early version of the manuscript. The manuscript will undergo copyediting, typesetting, and review of the resulting proof before it is published in its final citable form. Please note that during the production process errors may be discovered which could affect the content, and all legal disclaimers that apply to the journal pertain.
References
- Alter HJ, Liang TJ. Hepatitis C: The end of the beginning and possibly the beginning of the end. Ann Intern Med. 2012;156:317–318. doi: 10.1059/0003-4819-156-4-201202210-00014. [DOI] [PMC free article] [PubMed] [Google Scholar]
- Amato L, Davoli M, Perucci CA, Ferri M, Faggiano F, Mattick RP. An overview of systematic reviews of the effectiveness of opiate maintenance therapies: available evidence to inform clinical practice and research. J Subst Abuse Treat. 2005;28:321–329. doi: 10.1016/j.jsat.2005.02.007. [DOI] [PubMed] [Google Scholar]
- Amato L, Minozzi S, Davoli M, Vecchi S, Ferri M, Mayet S. Psychosocial and pharmacological treatments versus pharmacological treatments for opioid detoxification. Cochrane Database Syst Rev. 2004;4 doi: 10.1002/14651858.CD005031. CD005031. [DOI] [PubMed] [Google Scholar]
- Andrews CM, D’Aunno TA, Pollack HA, Freidmann PD. Adoption of evidence-based clinical innovations: the case of buprenorphine use by opioid treatment programs. Med Care Res Rev. 2014;71:43–60. doi: 10.1177/1077558713503188. [DOI] [PMC free article] [PubMed] [Google Scholar]
- Ball JC, Ross A. The Effectiveness of Methadone Maintenance Treatment. Springer-Verlag; New York: 1991. [Google Scholar]
- Breslow NE, Clayton DG. Approximate inference in generalized linear mixed models. J Am Stat Assoc. 1993;88:9–25. [Google Scholar]
- California Alcohol and Drug Programs. [July 15, 2013];California Outcomes Measurement Systems (CalOMS) Treatment Data Compliance Standards. 2005 http://www.adp.ca.gov/CalOMS/pdf/CalOMS_Data_Compliance.pdf.
- California Department of Alcohol and Drug Programs. [July 15, 2013];Indicators of Alcohol and Other Drug Abuse: FY 2010-11. 2012 http://www.adp.ca.gov/oara/pdf/Indicators_Report_2010-11.pdf.
- California Department of Alcohol and Drug Programs. [July 15, 2013];Research and Analysis: California Alcohol and Drug Programs. 2012 http://www.adp.ca.gov/oara/index.shtml.
- Degenhardt L, Bucello C, Mathers B, Briegleb C, Ali H, Hickman M, McLaren J. Mortality among regular or dependent users of heroin and other opioids: a systematic review and meta-analysis of cohort studies. Addiction. 2011;106:32–51. doi: 10.1111/j.1360-0443.2010.03140.x. [DOI] [PubMed] [Google Scholar]
- Degenhardt L, Randall D, Hall W, Law M, Butler T, Burns L. Mortality among clients of a state-wide opioid pharmacotherapy program over 20 years: risk factors and lives saved. Drug Alcohol Depend. 2009;105:9–15. doi: 10.1016/j.drugalcdep.2009.05.021. [DOI] [PubMed] [Google Scholar]
- Faggiano F, Vigna-Taglianti F, Versino E, Lemma P. Methadone maintenance at different dosages for opioid dependence. Cochrane Database of Syst Rev. 2003;3 doi: 10.1002/14651858.CD002208. CD002208. [DOI] [PubMed] [Google Scholar]
- Hser YI, Evans E, Ettner S, Huang D, Picazo R. The California Treatment Outcome Project Supplement to the Final Report. UCLA Integrated Substance Abuse Programs; Los Angeles, CA: 2003. [Google Scholar]
- Jones CM. Heroin use and heroin use risk behaviors among nonmedical users of prescription opioid pain relievers - United States, 2002-2004 and 2008-2010. Drug Alcohol Depend. 2013;132:95–100. doi: 10.1016/j.drugalcdep.2013.01.007. [DOI] [PubMed] [Google Scholar]
- Kleber HD. Methadone maintenance 4 decades later: thousands of lives saved but still controversial. JAMA. 2008;300:2303–2305. doi: 10.1001/jama.2008.648. [DOI] [PubMed] [Google Scholar]
- McCarthy JJ, Borders OT. Limit setting on drug abuse in methadone maintenance patients. Am J Psychiatry. 1985;142:1419–1423. doi: 10.1176/ajp.142.12.1419. [DOI] [PubMed] [Google Scholar]
- McLellan AT, Lewis DC, O’Brien CP, Kleber HD. Drug dependence, a chronic medical illness: implications for treatment, insurance, and outcomes evaluation. JAMA. 2000;284:1689–1695. doi: 10.1001/jama.284.13.1689. [DOI] [PubMed] [Google Scholar]
- Moore BA, Fiellin DA, Barry DT, Sullivan LE, Chawarski MC, O’Connor PG, Schottenfeld RS. Primary care office-based buprenorphine treatment: comparison of heroin and prescription opioid dependent patients. J Gen Intern Med. 2007;22:527–530. doi: 10.1007/s11606-007-0129-0. [DOI] [PMC free article] [PubMed] [Google Scholar]
- Nosyk B, Anglin MD, Brecht ML, Lima VD, Hser YI. Characterizing durations of heroin abstinence in the California Civil Addict Program: results from a 33-year natural history study. Am J Epidemiol. 2013;177:675–682. doi: 10.1093/aje/kws284. [DOI] [PMC free article] [PubMed] [Google Scholar]
- Nosyk B, Anglin MD, Brissette S, Kerr T, Marsh D, Schackman BR, Wood E, Montaner JSG. A call for evidence-based medicine for the treatment of opioid dependence in North America. Health Aff (Millwood) 2013;32:1462–1469. doi: 10.1377/hlthaff.2012.0846. [DOI] [PMC free article] [PubMed] [Google Scholar]
- Nosyk B, Guh DP, Bansback NJ, Oviedo-Joekes E, Brissette S, Marsh DC, Meikleham E, Schechter MT, Anis AH. Cost-effectiveness of diacetylmorphine versus methadone for chronic opioid dependence refractory to treatment. CMAJ. 2012;184:E317–E328. doi: 10.1503/cmaj.110669. [DOI] [PMC free article] [PubMed] [Google Scholar]
- Nosyk B, MacNab YC, Sun H, Marsh DC, Fischer B, Schechter MT, Anis AH. Proportional hazards frailty models for recurrent methadone maintenance treatment. Am J Epidemiol. 2009;170:783–792. doi: 10.1093/aje/kwp186. [DOI] [PubMed] [Google Scholar]
- O’Connor PG. Methods of detoxification and their role in treating patients with opioid dependence. JAMA. 2005;294:961–963. doi: 10.1001/jama.294.8.961. [DOI] [PubMed] [Google Scholar]
- Peles E, Schreiber S, Adelson M. Factors predicting retention in treatment: 10-year experience of a methadone maintenance treatment (MMT) clinic in Israel. Drug Alcohol Depend. 2006;82:211–217. doi: 10.1016/j.drugalcdep.2005.09.004. [DOI] [PubMed] [Google Scholar]
- Raudenbush SW, Bryk AS. Hierarchical Linear Models: Applications And Data Analysis Methods. 2. Sage; Newbury Park, CA: 2003. [Google Scholar]
- Rawson R, Crevecouer D. Los Angeles County Evaluation System Annual Report. UCLA Integrated Substance Abuse Programs; Los Angeles, CA: 2005. [Google Scholar]
- Rosenblum A, Joseph H, Fong C, Kipnis S, Cleland C, Portenoy RK. Prevalence and characteristics of chronic pain among chemically dependent patients in methadone maintenance and residential treatment facilities. JAMA. 2003;289:2370–2378. doi: 10.1001/jama.289.18.2370. [DOI] [PubMed] [Google Scholar]
- Soeffing JM, Martin LD, Fingerhood MI, Jasinski DR, Rastegar DA. Buprenorphine maintenance treatment in a primary care setting: outcomes at 1 year. J Subst Abuse Treat. 2009;37:426–430. doi: 10.1016/j.jsat.2009.05.003. [DOI] [PubMed] [Google Scholar]
- Stephenson DK. California Society of Addiction Medicine. [July 15, 2013];Guideline for physicians working in California Opioid Treatment Programs. 2008 http://www.csam-asam.org/sites/default/files/csam_otpguideline_oct08.pdf.
- Substance Abuse and Mental Health Services Administration. [June 19, 2013];Detoxification And Substance Abuse Treatment: A Treatment Improvement Protocol TIP 45. 2006 http://store.samhsa.gov/product/TIP-45-Detoxification-and-Substance-Abuse-Treatment/SMA12-4131.
- Substance Abuse and Mental Health Services Administration. Summary of National Findings. Vol. 1. Department of Health and Human Services; Rockville, MD: 2009. Results from the 2009 National Survey on Drug Use and Health. [Google Scholar]
- Substance Abuse and Mental Health Services Administration. [June 16, 2012];The National Survey on Substance Abuse Treatment Services. 2010 http://www.samhsa.gov/data/2k10/225/225OpiodTx2k10Web.pdf.
- Substance Abuse and Mental Health Services Administration. [July 8, 2013];Medication-Assisted Treatment for Opioid Addiction: 2010 State Profiles, Substance Abuse and Mental Health Services Administration. 2011 http://www.dpt.samhsa.gov/pdf/MedicationAssistedTreatmentForOpioidAddiction_2010StateProfiles03.pdf.
- Therneau TM, Grambsch PT. Modeling Survival Data: Extending the Cox Model. Springer-Verlag Publishers; New York: 2000. [Google Scholar]
- Urada D, Fan J, Rawson R. Evaluation Services to Enhance the Data Management System in California. Prepared for the Department of Alcohol and Drug Programs, California Health and Human Services Agency. UCLA Integrated Substance Abuse Programs; Los Angeles, CA: 2010. Data analysis report; pp. 5–25. [Google Scholar]
- US Food and Drug Administration. [October 15, 2013];Subutex and Suboxone Approved To Treat Opiate Dependence. 2002 http://www.fda.gov/Drugs/DrugSafety/PostmarketDrugSafetyInformationforPatientsandProviders/ucm191521.htm.
- Volkow ND, Montaner JSG. The urgency of providing comprehensive and integrated treatment for substance abusers with HIV. Health Affairs. 2011;30:1411–1419. doi: 10.1377/hlthaff.2011.0663. [DOI] [PMC free article] [PubMed] [Google Scholar]
- Zaric GS, Barnett PG, Brandeau ML. HIV transmission and the cost-effectiveness of methadone maintenance. Am J Public Health. 2000;90:1100–1111. doi: 10.2105/ajph.90.7.1100. [DOI] [PMC free article] [PubMed] [Google Scholar]
- Zarkin GA, Dunlap LJ, Hicks KA, Mamo D. Benefits and costs of methadone treatment: results from a lifetime simulation model. Health Econ. 2005;14:1133–1150. doi: 10.1002/hec.999. [DOI] [PubMed] [Google Scholar]
Associated Data
This section collects any data citations, data availability statements, or supplementary materials included in this article.