Abstract
Object
To develop an improved short tau inversion recovery (iSTIR) technique with simultaneous suppression of fat, blood vessels and fluid to increase tumor conspicuity in the abdomen for cancer screening.
Materials and methods
An adiabatic spectrally selective inversion pulse was used for fat suppression to overcome the reduced signal to noise ratio associated with chemically non-selective inversion pulse of STIR. A motion-sensitizing driven equilibrium was used for blood vessel suppression and a dual-echo single-shot fast spin echo acquisition was used for fluid suppression. The technique was optimized on four normal subjects and later tested on five patients referred for metastatic tumor evaluation.
Results
A velocity encoding of 2 cm/s achieved effective blood suppression even in small vessels. Subtraction of two images (one with 60 ms and the other with 280 ms echo time) acquired in the same echo train achieved excellent fluid suppression (<70 % reduction). Simultaneous suppression of fat, blood vessels and fluid improved the tumor conspicuity compared to corresponding fat-suppressed (STIR) image.
Conclusion
This technique generated two complementary images from a single scan: one that is equivalent to a STIR image and the other that qualitatively resembles a diffusion-weighted image and may have potential for magnetic resonance imaging cancer screening.
Keywords: T2, STIR, Diffusion, Screening, Suppression
Introduction
Whole-body screening for early detection of metastatic disease and whole-body staging to evaluate the extent of existing disease is critical for timely intervention and treatment. Most institutions currently use positron emission tomography typically with 18Fluorodeoxyglucose (18FDG) using co-registered computed tomography images (PET/CT) for screening and staging [1]. However, limited sensitivity for certain tumors, and a degree of artifact vulnerability offer options for an alternative. Furthermore, an increasing concern of PET/CT revolves around the use of ionizing radiation [2, 3], particularly in younger patients with need for repeated exposures during long follow up periods.
In recent years, whole-body magnetic resonance imaging (MRI) has gained increased attention for screening of tumor metastasis [4–6]. The excellent soft tissue contrast provided by MRI combined with its lack of ionizing radiation makes MRI an attractive approach for screening. The most commonly used sequences for MR screening are short-tau inversion recovery (STIR) [7], echo planar imaging based diffusion weighted imaging (DW-EPI) [8, 9], or a combination of both techniques [10, 11]. All these techniques have high sensitivity for tumor detection. Various groups have reported high sensitivity and specificity with whole-body MRI using STIR and/or DW-EPI for tumor detection when compared to PET/CT [12–16].
Diffusion-weighted images are typically acquired with fat suppression. In addition, the blood vessels and fluid that may mimic or obscure neoplastic lesions [17, 18] are well suppressed due to their high diffusion coefficients and provide an image with increased tumor conspicuity. Diffusion-weighted images, however, are signal to noise ratio (SNR) limited and often require multiple signal averages that result in an increased total scan time. Furthermore, DW-EPI images are subject to distortion when used with larger fields of view (FOV), as needed in body applications, and are typically implemented with limited spatial resolution to offset time and signal considerations. On the other hand, STIR provides increased tumor conspicuity with limited image distortion due to the fast spin echo (FSE) readout, however, STIR images contain numerous residual confounding tissue signals that need to be “mentally” edited by the reader. The purpose of this work was to develop a FSE based T2-weighted acquisition with simultaneous suppression of fat, blood vessels and fluid (iSTIR) to increase tumor conspicuity and compare the iSTIR images in the abdomen with fat-suppressed T2-weighted (STIR) images and DW-EPI images.
Materials and methods
Pulse sequence
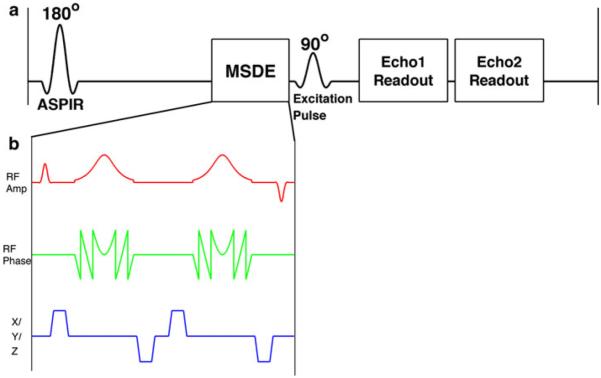
We utilized a single shot fast spin echo (SSFSE) sequence for data acquisition. SSFSE is a commonly used fast T2-weighted imaging technique in the body that provides high SNR with negligible geometric distortion [19]. The sequence was modified as shown in Fig. 1 to selectively suppress different confounding tissues.
Fig. 1.
a A schematic of the iSTIR pulse sequence showing the ASPIR pulse for fat suppression and the MSDE module (b) for blood suppression, followed by the 90° excitation pulse and the acquisition of two echoes using a single shot FSE readout. Subtraction of the later echo (longer TE image) from the earlier echo (shorter TE image) achieves fluid suppression. b MSDE module contains a non selective 90° excitation pulse, two adiabatic refocusing pulses, followed by a non selective −90° excitation pulse with flow-suppression gradients between the RF pulses
Fat suppression
An adiabatic spectrally selective inversion (ASPIR) pulse was included prior to the SSFSE sequence to suppress fat [20]. The ASPIR pulse uses a sharply defined bandwidth to selectively invert fat without disturbing the magnetization of the remaining tissues and thus provides images with high SNR compared to traditional STIR, which uses a chemically non-selective inversion pulse. Additionally, the adiabatic pulse is insensitive to B1 inhomogeneities and can therefore produce more uniform fat suppression.
Blood vessel suppression
A motion-sensitizing driven equilibrium (MSDE) module (Fig. 1b) [21, 22] was applied following the ASPIR pulse and immediately before the excitation pulse of the SSFSE sequence. The MSDE module consisted of an excitation pulse (90°), followed by two adiabatic hyperbolic secant refocusing pulses (180°), followed by a tip-up pulse (−90°). Flow-suppression gradients were included between the radiofrequency (RF) pulses. The RF pulses were all non-selective and hence the flow-suppression gradients dephase the signal from the moving tissues in the entire volume of the transmit coil. The tip-up pulse (−90°) at the end of the MSDE restores the magnetization from stationary tissue to the positive longitudinal axis, while the transverse signal from the moving tissue is dephased using spoiler gradients (not shown) after the MSDE module. The flow-suppression gradients were encoded along all three axes to induce maximum flow dephasing as the strength of these gradients determines the velocity of the blood vessel signal that is suppressed.
Fluid suppression
Fluid in the abdomen is an expected constituent and commonly found in bile ducts, the collecting systems, bowel and incidental cystic lesions. While these fluids tend to have long T1 and T2 values, the precise relaxation values fall in a broad range. To suppress these fluids with a range of long T2 values, the SSFSE sequence was modified to acquire two echoes—one at a shorter echo time (TE) and the other at a longer TE, following the same excitation. The normal tissues with shorter T2 and metastatic lesions with moderately prolonged T2 appear only on the shorter TE image, while fluids with vry long T2, such as within cysts and within the bowel lumen appear on both shorter and longer TE images. Thus, by subtracting the longer TE image from the shorter TE image, a difference image can be obtained which suppresses the signal from the long T2 fluids [23].
Simulations
Simulations were performed to identify the optimum echo times for fluid suppression. Following a single excitation, signal intensity of an SSFSE acquisition was calculated as,
| (1) |
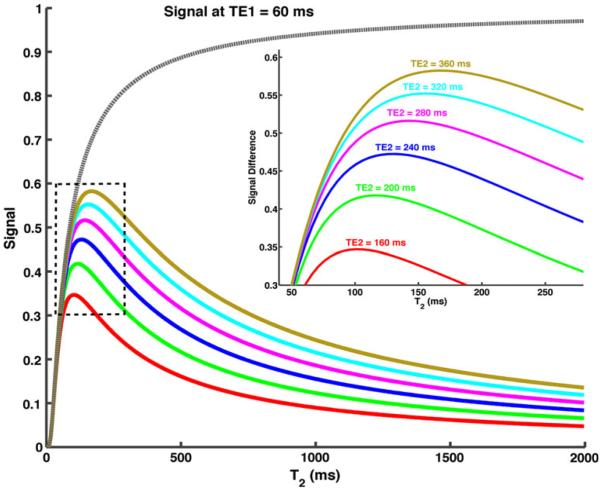
Since each slice experiences only a single excitation with an SSFSE acquisition, an infinite TR was assumed. In addition, both the shorter TE and the longer TE images were acquired following a single excitation and hence the effect of the ASPIR pulse and MSDE were neglected on both signal intensities. The shorter TE (TE1) was fixed at a clinically used echo time of 60 ms, while the longer TE (TE2) was varied between 160 and 360 ms. Signal intensities at the shorter TE (STE1) and signal difference between the two echoes (STE1 − STE2) were plotted against a range of T2 values (Fig. 2).
Fig. 2.
Simulations of signal (dashed grey line) and signal difference (solid color lines) acquired at two different echo times against varying T2. A TE2 of 280 ms achieves higher signal difference for tissues with T2 less than 160 ms, while also minimizing the signal from tissues with longer T2 greater than 500 ms
MRI experiments
The study was approved by the institutional review board and was in compliance with the Health Insurance Portability and Accountability Act (HIPAA). Written informed consent was obtained from all subjects prior to imaging. The sequence was first tested on four normal subjects to evaluate the suppression of various confounding tissues. Fat suppression was evaluated by comparing the images against fat-suppressed and conventional T2-weighted images (please see below for sequence parameters) for uniformity. Blood vessel suppression was evaluated by varying the gradient strengths of the MSDE flow suppression gradients and comparing the images against conventional T2-weighted images. Fluid suppression was evaluated by comparing the signal intensities of various tissues on the shorter TE, longer TE and the subtracted T2-weighted images and was measured as the percentage signal reduction, defined by
| (2) |
Increased percentage reduction demonstrates better tissue suppression for fluids. Additionally, this percentage reduction also provides a numerical measurement of the signal reduction of tissues other than fluids compared to the shorter TE image. Ideally, these tissues should experience less signal reduction and hence small percentage reduction in signal intensities. The iSTIR sequence was subsequently tested on five patients who were referred for evaluation of neoplastic lesions and assessment for metastases and compared with the fat-saturated T2-weighted fast spin-echo and DW-EPI sequences used in the standard clinical protocol at our institution.
All imaging was performed on a 1.5 T scanner (HDxt version 15.0, GE Healthcare, Waukesha, WI, USA) using a 12-channel phased-array coil (GE Healthcare Coils, Aurora, OH, USA). The timing between the ASPIR pulse and the MSDE module was approximately 130 ms to effectively null the fat signal. The flow-suppression gradients of the MSDE module were varied on the normal subject studies to achieve combined velocity encoding between 0.5 and 6.4 cm/s. With the results obtained from the normal subject studies, a combined velocity encoding of approximately 2 cm/s was selected for the patient studies. The timing between the +90° excitation pulse and the −90° tip-up pulse of the MSDE module was 21 ms. The typical scan parameters were: 2D axial acquisition, FOV = 320 × 256 mm2, slice thickness = 5.0 mm, slice gap = 3.0 mm, number of slices = 20, TR = 1,300 ms, TE1 = 60 ms, Nx = 192, Ny = 128, number of averages = 0.56 (partial Fourier acquisition along phase encoding) and scan time = 20 s (single breath-hold). From the fluid suppression simulations, a TE2 of 280 ms was used for all studies. The effective echo times of 60 and 280 ms included the MSDE time of 21 ms. The shorter TE and the longer TE images were reconstructed separately and then the longer TE image was subtracted from the shorter TE image to generate the final contrast-edited T2-weighted iSTIR image. T2-weighted FSE images using conventional fat suppression and DW-EPI images are part of the standard clinical abdominal protocol and were also acquired on the patients for comparison. The acquisition parameters for fat-saturated T2-weighted images were: 2D axial, FOV = 320 × 256 mm2, slice thickness = 7.0 mm, slice gap = 2.0 mm, number of slices = 20, TR = 2,200 ms, TE = 90 ms, Nx = 320, Ny = 160, number of averages = 1 and scan time = 40 s (2 breath-holds to cover the upper abdomen). The acquisition parameters for DW-EPI images were: 2D axial, FOV = 320 × 256 mm2, slice thickness = 5.0 mm, slice gap = 3.0 mm, number of slices = 20, TE = 60 ms, Nx = 80, Ny = 128, number of averages = 4. A b-value in the range of 500–850 s/mm2 was used. DW-EPI images were acquired with respiratory triggering (4–6 s interval) using a single-shot EPI readout with fat suppression in approximately 1:00 min scan time.
Results
Simulations
Simulations of signal intensity against varying T2 are shown in Fig. 2. For the range of values studied, the signal difference for all tissues increased with increasing TE2. As reported in literature, the normal tissues in the abdomen including liver, spleen, pancreas, kidneys etc. have T2 relaxation times of less than 120 ms at 1.5 T [24], while tumors have been shown to have moderately prolonged T2 but still typically less than 160 ms [25, 26]. Since our goal is to maximize the signal for these tissues while simultaneously minimizing the signal from the fluids with long T2 (>500 ms); we have chosen an intermediate TE2 of 280 ms to give higher signal in tumor than in normal soft tissues but still suppress much longer T2 [27].
Volunteer studies
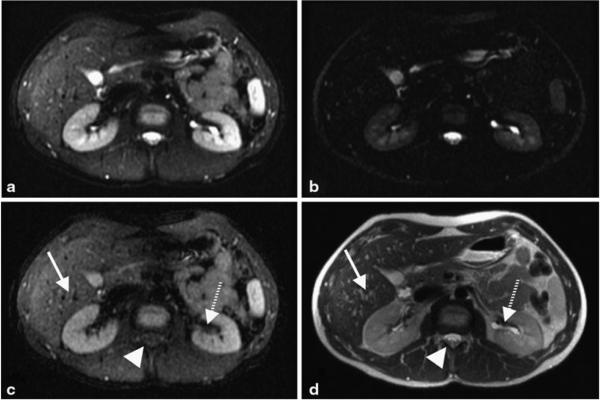
Representative images of a normal volunteer assessing the suppression of various confounding tissues are shown in Fig. 3. The shorter TE image (Fig. 3a) of the iSTIR sequence produced images with uniform fat suppression compared to the standard SSFSE image (Fig. 3d). The signal intensity in the majority of the blood vessels including small vessels in the liver was reduced by the iSTIR’s MSDE preparation with a velocity encoding of approximately 2 cm/s. Velocity encoding of greater than 3 cm/s failed to suppress signal in the smaller vessels while velocity encoding of less than 1.5 cm/s induced signal loss due to bulk motion (data not shown). The longer TE image (Fig. 3b) shows signal from the long T2 tissues, mainly the fluid in cerebrospinal fluid (CSF) and the collecting system in the kidneys, which are suppressed on the final subtracted iSTIR image (Fig. 3c).
Fig. 3.
Shorter TE image (a), longer TE image (b), and the subtracted iSTIR image (c) of a normal volunteer. Compared to the standard SSFSE image (d), the iSTIR image shows uniform fat suppression, reduced signal intensity from the blood vessels (e.g., in the liver, arrow) and reduced fluid signal (e.g., in CSF, arrowhead and collecting system in the kidneys, dashed arrow)
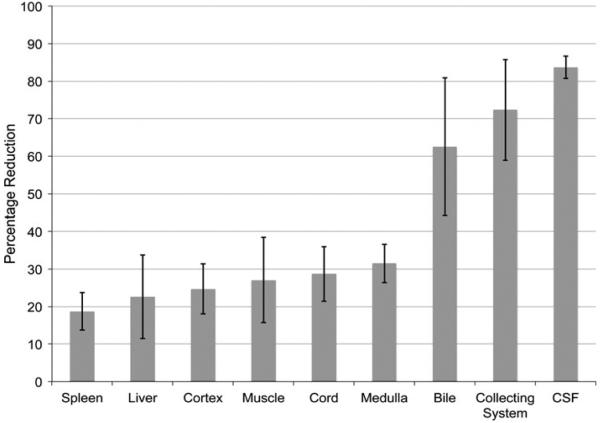
The percentage signal reduction on the subtracted iSTIR image (Eq. 2), averaged across all four normal subjects for various tissues is shown in Fig. 4. The signal intensities decreased more for tissues with longer T2. Specifically the fluid in CSF and the collecting system with long T2 tissues was reduced by greater than 70 % compared to the shorter TE image, while preserving the signal intensities of tissues with short T2.
Fig. 4.
The percentage reduction of signal intensities (Eq. 2) in various tissues averaged across all normal volunteers
Patient studies
Two patients had tumors that were clearly delineated on all images (e.g., Figs. 5, 6), while two other patients had multiple cysts (e.g., Fig. 7) and one patient who was scanned post-treatment did not have clear appearance of the tumor on any image. SNR averaged across all five patients for various tissues is summarized in Table 1. Compared to the standard T2 image, fat suppression was achieved successfully (lowest SNR) on fat-suppressed T2, shorter TE and the subtracted iSTIR images. Compared to the standard T2 and fat-suppressed T2 images, blood vessels in the liver were attenuated on the shorter TE and the subtracted iSTIR images. Similarly, long T2 fluids such as bile and CSF were also reduced on the subtracted iSTIR image (but not on the shorter TE image) compared to the standard T2 and fat-suppressed T2 images.
Fig. 5.
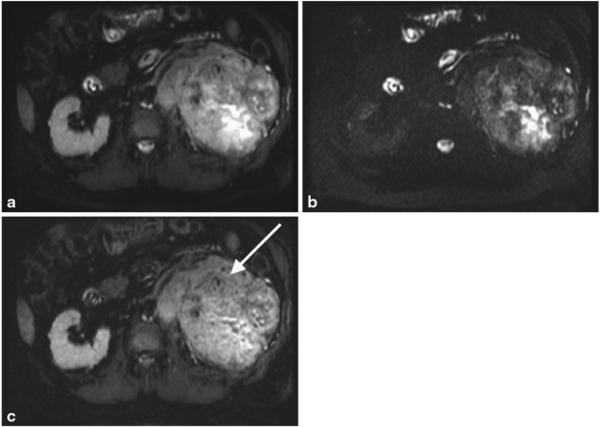
Shorter TE image (a), longer TE image (b) and the subtracted iSTIR image (c) of a patient with a large left renal mass (arrow). Note the heterogeneity of the tumor with fluid accumulation centrally that is partially suppressed in the subtracted iSTIR image. The final diagnosis of the tumor is primary clear cell renal cell carcinoma, Fuhrman grade 4 with extensive sarcomatoid features
Fig. 6.
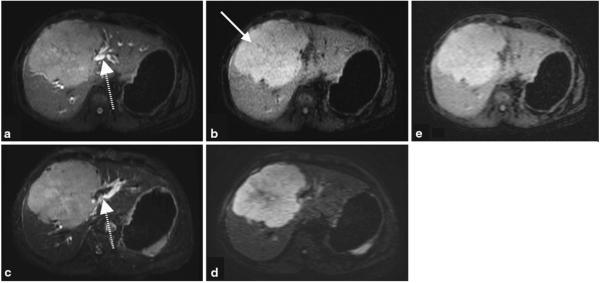
Shorter TE image (a) and the subtracted iSTIR image (b) of a patient with a large central liver mass (arrow), compared against fat-suppressed T2-weighted image (c) and a diffusion-weighted image (b = 500 s/mm2) (d). Shorter TE image (a) resembles the fat suppressed T2-weighted image (c), while the subtracted iSTIR image (b) qualitatively resembles the diffusion-weighted image (d). When reconstructed to the same spatial resolution as DWI, iSTIR image (e) provides equivalent contrast to noise ratio of DWI. The dashed arrow represents the biliary ducts that are visible on the shorter TE image (a) similar to the fat-suppressed T2-weighted image (c). The final diagnosis of the tumor is aggressive poorly differentiated primary neuroendocrine cell carcinoma of the liver
Fig. 7.
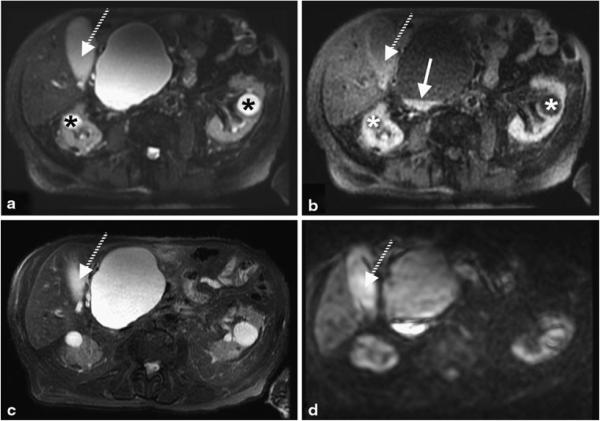
Shorter TE image (a) and subtracted iSTIR image (b) compared against fat-suppressed T2-weighted image (c) and diffusion weighted image (b = 850 s/mm2) (d). The cysts in both kidneys (asterisk) are completely suppressed and the gallbladder (dashed arrow) is largely suppressed on the subtracted iSTIR image. Note the increased signal at the bottom of the large pancreatic cyst next to the liver (arrow) on the subtracted iSTIR image, which also appears bright on the diffusion-weighted image. The final diagnosis is pancreatic pseudocyst and common bile duct stricture with biliary dilatation
Table 1.
Signal to noise ratio averaged across all five patients, expressed as mean ± SD
| Anatomy | Standard T2 | Fat-suppressed T2 | Shorter TE | iSTIR | DW-EPI |
|---|---|---|---|---|---|
| Fat | 99 ± 32 | 24 ± 10 | 10 ± 4.8 | 4.4 ± 4.3 | 8.8 ± 4.4 |
| Blood vessels (in liver) | 111 ± 44 | 110 ± 8.6 | 47 ± 42 | 18 ± 15 | 21 ± 7.8 |
| Muscle | 35 ± 11 | 28 ± 5.3 | 19 ± 8.4 | 14 ± 9 | 14 ± 1.1 |
| Liver | 46 ± 17 | 68 ± 19 | 37 ± 16 | 27 ± 14 | 48 ± 14 |
| Intervertebral disc | 66 ± 23 | 44 ± 17 | 17 ± 11 | 10 ± 8 | 48 ± 24 |
| Kidney | 76 ± 30 | 100 ± 16 | 56 ± 36 | 38 ± 30 | 59 ± 7.3 |
| Spleen | 81 ± 33 | 114 ± 33 | 56 ± 46 | 42 ± 41 | 151 ± 52 |
| Bile | 134 ± 56 | 216 ± 50 | 85 ± 58 | 16 ± 12 | 60 ± 18 |
| CSF | 154 ± 55 | 147 ± 51 | 58 ± 22 | 13 ± 11 | 30 ± 16 |
DW-EPI images are of lower resolution and hence the increased SNR is not a fundamental advantage
Contrast ratio, defined as the ratio of signal intensities of two tissues, are reported in Table 2 for tumor and cyst compared to their respective background tissue. Tumor to background tissue was comparable between standard T2, fat-suppressed T2, shorter TE and subtracted iSTIR images, but was lower compared to the diffusion-weighted image. However, cyst to background tissue signal was significantly lower for the subtracted iSTIR image compared to all images.
Table 2.
Contrast ratio, defined as the ratio of signal intensities of two tissues
| Standard T2 | Fat-suppressed T2 | Shorter TE | iSTIR | DW-EPI | |
|---|---|---|---|---|---|
| Tumor to background tissuea | 1.46 ± 0.53 | 1.43 ± 0.51 | 1.64 ± 0.34 | 1.56 ± 0.47 | 2.62 ± 1.42 |
| Cyst to background tissueb | 2.41 ± 0.13 | 2.30 ± 0.93 | 1.98 ± 0.89 | 0.22 ± 0.07 | 0.83 ± 0.19 |
Average of two patients, who had tumors
Average of two different patients, who had multiple cysts
Figure 5 shows representative images of a patient with a large left renal mass with extensive extra-renal invasion. In addition to the fluid in the CSF and in the bowel, fluid also appears centrally within the tumor on the longer TE image, likely representing necrosis. On the subtracted iSTIR image (Fig. 5c), in addition to the suppression of fat and blood vessels, fluid is suppressed by 62 % in CSF and by 67 % in the bowel. The SNR of the kidneys and the tumor on the iSTIR image were 42 ± 2 and 49 ± 7 respectively, while the corresponding values on the DWI were 43 ± 2 and 49 ± 10 respectively. Thus, the relative contrast to noise ratio (CNR) between tumor and kidneys were similar between iSTIR and DWI in this case.
Figure 6 shows results from a different patient with a large central liver mass obstructing the central biliary ducts. The shorter TE image (Fig. 6a) clearly shows the tumor but also allows to assess the biliary ducts adjacent to the tumor (dashed arrow), which remain bright similar to the fat-suppressed T2-weighted image (Fig. 6c). In addition, the subtracted iSTIR image (Fig. 6b) eliminates the adjacent signal in the biliary ducts, and thus shows more discrete delineation of the tumor. Compared to the shorter TE image, the signal intensity of the biliary ducts was reduced by 86 % while it was reduced by only 10 and 16 % for the liver and the tumor respectively on the subtracted iSTIR image. By suppressing various confounding and adjacent tissues, the iSTIR image depicts the tumor with similar qualitative appearance to the diffusion-weighted image (Fig. 6d), although with higher spatial resolution. However, it is worthwhile to notice that there are differences in the appearance of the tumor on these two images, particularly the decreased signal in the core of the tumor on the diffusion-weighted image. The SNR of the liver and the tumor on the iSTIR image were 70 ± 2 and 102 ± 10 respectively, while the corresponding values on the DWI were 22 ± 3 and 65 ± 10 respectively. Although DWI has a better CNR of 43 compared to iSTIR’s CNR of 32, iSTIR images were acquired in a single acquisition with better spatial resolution and limited distortion. However, when the iSTIR images were reconstructed to the same spatial resolution as DWI (Fig. 6e), the CNR improved to 45, which is equivalent to DWI’s CNR.
Figure 7 shows results from a different patient with pancreatic and renal cysts that are clearly visible on the shorter TE image (Fig. 7a) and the fat-suppressed T2-weighted image (Fig. 7c). The renal cysts are homogeneous and contain simple fluid and hence, are nearly suppressed on the subtracted iSTIR image with the signal intensity reduced by 88 % compared to the shorter TE image (Fig. 7b). However, the large pancreatic cyst next to the liver contains hemorrhagic debris in the dependent portion of the lesion. Hemorrhagic debris show restricted diffusion and appear bright on the iSTIR image with the signal intensity reduced by 67 % compared to the shorter TE image (arrow in Fig. 7b), and appears qualitatively similar to the diffusion-weighted image (Fig. 7d). In addition, signal from the bile in the gallbladder has been markedly reduced on the subtracted iSTIR image. In the diffusion-weighted image, however, T2 shine through still brightens the bile signal (dashed arrow in Fig. 7d).
Discussion
STIR and DW-EPI represent the most commonly used sequences for whole body metastases screening, however, these approaches have known limitations. Because STIR does not suppress the signal from confounding tissues, these images need to be “mentally” edited by the reader in order to visualize the lesions clearly. DW-EPI images are prone to distortion particularly with the large FOV that are commonly required for the body imaging applications. In this work, we have developed an improved STIR technique using a FSE approach to increase the conspicuity of neoplastic lesions by simultaneously suppressing confounding signals from fat, blood vessels, and fluid. This technique produces a shorter TE image with fat and blood suppression that resembles a fat-suppressed T2-weighted image (Figs. 6, 7), while also generating a final contrast-edited T2-weighted (iSTIR) image with image contrast that resembles a diffusion-weighted image (Figs. 6, 7).
The chemically selective fat inversion pulse used for the iSTIR sequence represents a tradeoff between the more spatially uniform fat suppression, but low SNR and CNR, achieved with chemically non-selective inversion pulses and the higher SNR but more incomplete fat suppression achieved with non-adiabatic fat excitation and dephasing. The sharply defined bandwidth and adiabatic inversion of the chemically selective inversion pulse provided uniform fat suppression over the field of view in all our studies.
We used MSDE for blood suppression, which has been shown to produce black blood images with both 2D and 3D techniques. In the current implementation of MSDE, we used a pair of adiabatic refocusing pulses to render the sequence less sensitive to B1 inhomogeneities [28], which is a common concern in body applications. However, the excitation (90°) and the tip-up (−90°) pulses of MSDE are still prone to B1 inhomogeneities. Alternative implementation will consider B1 insensitive pulses such as BIR-4 [29, 30]. For maximum blood suppression, we used flow-suppression gradients along all three logical axes simultaneously. While this induces maximum flow suppression in the shortest time, this only affects the vessels that are oriented in the combined direction of the gradients. However, this technique still produced sufficient blood suppression in the majority of the blood vessels (Fig. 3). Additionally, it should also be noted that the slow flowing vessels especially near the vessel wall in the veins do not get suppressed by MSDE, but are suppressed on the final subtracted iSTIR image due to the long T2 nature of the blood. Alternatively, double inversion recovery can also be used to achieve black blood, however, this sequence suffers from long scan times to avoid saturating long T1 tissues [31].
Although we have emphasized the similarity in appearance between diffusion-weighted images and iSTIR images, it is important to recognize that the mechanisms of T2 and diffusion weighting are not identical. The contrast on the high b value DWI images is due to the restricted diffusion of tumors arising from the increased cellularity, which is a primary feature of malignancy. On the other hand, the contrast on the iSTIR images is due to the increased T2 from the increased water content. Additionally in acute stroke, for example, diffusion changes precede detectable T2 changes [32]. Still, apparent diffusion coefficient (ADC) and T2 tend to be longer in tissues with higher water content and much of the contrast in diffusion-weighted imaging at low b values may come from the long TE spin echo images used for diffusion. Indeed some studies have shown better contrast with whole body screening on low b value (50 s/mm2) diffusion weighted images than on higher b value (500 s/mm2) images [33]. At low b values, the effect of diffusion on contrast is minimal and perhaps the improved contrast is primarily due to the suppression of various confounding tissues.
Dual echo subtraction achieved >70 % fluid suppression and introduced little detectable motion artifact. Since the dual echo acquisition was obtained in a single echo train, motion effects were minimized relative to multi-shot subtraction strategies. Suppression of fluid by T2 rather than T1 contrast, as in FLAIR imaging [34], offers the advantage of shorter TRs and greater relative separation of fluid from tissue. However, it should be noted that the subtraction decreases the SNR of the contrast-edited iSTIR image.
One of the limitations of the proposed technique is the possible reduction in signal intensity of lesions with exceptionally long T2 on the final subtracted iSTIR image. This is similar to FLAIR images, used in neuro-imaging. While FLAIR can reduce the visibility of very long T2 lesions in the brain, it is still widely used as it facilitates the easier interpretation of the lesions that could be visualized retrospectively on the T2-weighted images. Similarly, cysts with relatively low T2 may not be completely suppressed either. However, since our proposed technique also generates shorter TE image with fat and blood vessel suppression, these lesions are visible on both images, when combined together can provide complete information. Future work will explore the optimal combination of the information from both images to present a final image that circumvents this particular limitation. Another limitation of the study is the evaluation of the technique in a small number of patients; however, the technique does demonstrate the feasibility. A study in larger patient population referred for metastatic screening is warranted to show the efficacy of this technique.
Although each of the contrast manipulations employed in this study have previously been reported on their own, the combination of flow, fat and fluid suppression in a fast, higher spatial resolution, undistorted image acquisition achieved an image quality and confounding tissue suppression that merit further evaluation in cancer screening and other body imaging applications without the use of exogenous contrast agents. As such, this technique using a single acquisition may become a viable option for abdominal cancer screening. Furthermore, the iSTIR acquisition also provides the shorter TE image that may provide important diagnostic information by itself; for example, efficient visualization of the biliary system by effectively suppressing fat and blood vessels.
Conclusion
We have developed an improved short tau inversion recovery (iSTIR) technique using a FSE approach to increase the conspicuity of lesions by simultaneously suppressing confounding signals from fat, blood vessels, and fluid. This technique produces a shorter TE image with fat and blood suppression that resembles a fat-suppressed T2-weighted image, while also generating a final contrastedited T2-weighted image with image contrast that resembles a diffusion-weighted image. This approach results in fast, higher spatial resolution and undistorted images with confounding tissue suppression and increased tumor conspicuity in a single acquisition that can be potentially used for abdominal cancer screening. Once identified, the lesions could be further investigated with a dedicated diffusion-weighted sequence in the targeted region.
Acknowledgments
The authors would like to thank Shelby Cuffley, B.S. and Meaghan Fox, B.S. for their help with the patient studies.
Contributor Information
Ananth J. Madhuranthakam, Applied Science Lab, GE Healthcare, Boston, MA, USA Department of Radiology and Advanced Imaging Research Center, University of Texas Southwestern Medical Center, 5323 Harry Hines Blvd, Dallas, TX 75390-9061, USA, Ananth.Madhuranthakam@utsouthwestern.edu.
Karen S. Lee, Department of Radiology, Beth Israel Deaconess Medical Center, Harvard Medical School, Boston, MA, USA
Aya Yassin, Department of Radiology, Beth Israel Deaconess Medical Center, Harvard Medical School, Boston, MA, USA.
Ivan Pedrosa, Department of Radiology and Advanced Imaging Research Center, University of Texas Southwestern Medical Center, 5323 Harry Hines Blvd, Dallas, TX 75390-9061, USA; Department of Radiology, Beth Israel Deaconess Medical Center, Harvard Medical School, Boston, MA, USA.
Neil M. Rofsky, Department of Radiology and Advanced Imaging Research Center, University of Texas Southwestern Medical Center, 5323 Harry Hines Blvd, Dallas, TX 75390-9061, USA Department of Radiology, Beth Israel Deaconess Medical Center, Harvard Medical School, Boston, MA, USA.
David C. Alsop, Department of Radiology, Beth Israel Deaconess Medical Center, Harvard Medical School, Boston, MA, USA
References
- 1.Antoch G, Saoudi N, Kuehl H, Dahmen G, Mueller SP, Beyer T, Bockisch A, Debatin JF, Freudenberg LS. Accuracy of whole-body dual-modality fluorine-18-2-fluoro-2-deoxy-D-glucose positron emission tomography and computed tomography (FDG-PET/CT) for tumor staging in solid tumors: comparison with CT and PET. J Clin Oncol. 2004;22(21):4357–4368. doi: 10.1200/JCO.2004.08.120. [DOI] [PubMed] [Google Scholar]
- 2.Schoder H, Gonen M. Screening for cancer with PET and PET/CT: potential and limitations. J Nucl Med. 2007;48(Suppl 1):4S–18S. [PubMed] [Google Scholar]
- 3.Hall EJ, Brenner DJ. Cancer risks from diagnostic radiology. Br J Radiol. 2008;81(965):362–378. doi: 10.1259/bjr/01948454. [DOI] [PubMed] [Google Scholar]
- 4.Horvath LJ, Burtness BA, McCarthy S, Johnson KM. Total-body echo-planar MR imaging in the staging of breast cancer: comparison with conventional methods—early experience. Radiology. 1999;211(1):119–128. doi: 10.1148/radiology.211.1.r99ap33119. [DOI] [PubMed] [Google Scholar]
- 5.Lauenstein TC, Semelka RC. Emerging techniques: whole-body screening and staging with MRI. J Magn Reson Imaging. 2006;24(3):489–498. doi: 10.1002/jmri.20666. [DOI] [PubMed] [Google Scholar]
- 6.Schmidt GP, Reiser MF, Baur-Melnyk A. Whole-body MRI for the staging and follow-up of patients with metastasis. Eur J Radiol. 2009;70(3):393–400. doi: 10.1016/j.ejrad.2009.03.045. [DOI] [PubMed] [Google Scholar]
- 7.Walker R, Kessar P, Blanchard R, Dimasi M, Harper K, DeCarvalho V, Yucel EK, Patriquin L, Eustace S. Turbo STIR magnetic resonance imaging as a whole-body screening tool for metastases in patients with breast carcinoma: preliminary clinical experience. J Magn Reson Imaging. 2000;11(4):343–350. doi: 10.1002/(sici)1522-2586(200004)11:4<343::aid-jmri1>3.0.co;2-p. [DOI] [PubMed] [Google Scholar]
- 8.Koh DM, Collins DJ. Diffusion-weighted MRI in the body: applications and challenges in oncology. AJR Am J Roentgenol. 2007;188(6):1622–1635. doi: 10.2214/AJR.06.1403. [DOI] [PubMed] [Google Scholar]
- 9.Padhani AR, Liu G, Koh DM, Chenevert TL, Thoeny HC, Takahara T, Dzik-Jurasz A, Ross BD, Van Cauteren M, Collins D, Hammoud DA, Rustin GJ, Taouli B, Choyke PL. Diffusion-weighted magnetic resonance imaging as a cancer biomarker: consensus and recommendations. Neoplasia. 2009;11(2):102–125. doi: 10.1593/neo.81328. [DOI] [PMC free article] [PubMed] [Google Scholar]
- 10.Takahara T, Imai Y, Yamashita T, Yasuda S, Nasu S, Van Cauteren M. Diffusion weighted whole body imaging with background body signal suppression (DWIBS): technical improvement using free breathing, STIR and high resolution 3D display. Radiat Med. 2004;22(4):275–282. [PubMed] [Google Scholar]
- 11.Nakanishi K, Kobayashi M, Nakaguchi K, Kyakuno M, Hashimoto N, Onishi H, Maeda N, Nakata S, Kuwabara M, Murakami T, Nakamura H. Whole-body MRI for detecting metastatic bone tumor: diagnostic value of diffusion-weighted images. Magn Reson Med Sci. 2007;6(3):147–155. doi: 10.2463/mrms.6.147. [DOI] [PubMed] [Google Scholar]
- 12.Komori T, Narabayashi I, Matsumura K, Matsuki M, Akagi H, Ogura Y, Aga F, Adachi I. 2-[Fluorine-18]-fluoro-2-deoxy-D-glucose positron emission tomography/computed tomography versus Whole-body diffusion-weighted MRI for detection of malignant lesions: initial experience. Ann Nucl Med. 2007;21(4):209–215. doi: 10.1007/s12149-007-0010-6. [DOI] [PubMed] [Google Scholar]
- 13.Ohno Y, Koyama H, Onishi Y, Takenaka D, Nogami M, Yoshikawa T, Matsumoto S, Kotani Y, Sugimura K. Non small cell lung cancer: Whole-body MR examination for M-stage assessment—utility for Whole-body diffusion-weighted imaging compared with integrated FDG PET/CT. Radiology. 2008;248(2):643–654. doi: 10.1148/radiol.2482072039. [DOI] [PubMed] [Google Scholar]
- 14.Ono K, Ochiai R, Yoshida T, Kitagawa M, Omagari J, Kobayashi H, Yamashita Y. Comparison of diffusion weighted MRI and 2-[fluorine-18]-fluoro-2-deoxy-D-glucose positron emission tomography (FDG-PET) for detecting primary colorectal cancer and regional lymph node metastases. J Magn Reson Imaging. 2009;29(2):336–340. doi: 10.1002/jmri.21638. [DOI] [PubMed] [Google Scholar]
- 15.Stecco A, Romano G, Negru M, Volpe D, Saponaro A, Costantino S, Sacchetti G, Inglese E, Alabiso O, Carriero A. Whole-body diffusion-weighted magnetic resonance imaging in the staging of oncological patients: comparison with positron emission tomography computed tomography (PET-CT) in a pilot study. Radiol Med. 2009;114(1):1–17. doi: 10.1007/s11547-008-0348-4. [DOI] [PubMed] [Google Scholar]
- 16.Schmidt GP, Paprottka P, Jakobs TF, Hoffmann RT, Baur-Melnyk A, Haug A, Notohamiprodjo M, Baur Melnyk A, Nikolaou K, Reiser MF, Rist C. FDG-PET-CT and Whole-body MRI for triage in patients planned for radioembolisation therapy. Eur J Radiol. 2012;81(3):e269–e276. doi: 10.1016/j.ejrad.2011.02.018. [DOI] [PubMed] [Google Scholar]
- 17.Li W, Nissenbaum MA, Stehling MK, Goldmann A, Edelman RR. Differentiation between hemangiomas and cysts of the liver with nonenhanced MR imaging: efficacy of T2 values at 1.5 T. J Magn Reson Imaging. 1993;3(5):800–802. doi: 10.1002/jmri.1880030517. [DOI] [PubMed] [Google Scholar]
- 18.Hussain SM, De Becker J, Hop WC, Dwarkasing S, Wielopolski PA. Can a single-shot black-blood T2-weighted spin-echo echo-planar imaging sequence with sensitivity encoding replace the respiratory-triggered turbo spin-echo sequence for the liver? An optimization and feasibility study. J Magn Reson Imaging. 2005;21(3):219–229. doi: 10.1002/jmri.20269. [DOI] [PubMed] [Google Scholar]
- 19.Semelka RC, Kelekis NL, Thomasson D, Brown MA, Laub GA. HASTE MR imaging: description of technique and preliminary results in the abdomen. J Magn Reson Imaging. 1996;6(4):698–699. doi: 10.1002/jmri.1880060420. [DOI] [PubMed] [Google Scholar]
- 20.Walter C, Heindel W, Kruessell M, Kugel H, Jung G, Gindele A. Fast sequences with fat suppression in breath-hold mode: new standard in contrast-enhanced T1-weighted MR imaging of renal tumors? Eur Radiol. 2001;11(10):2092–2098. doi: 10.1007/s003300100826. [DOI] [PubMed] [Google Scholar]
- 21.Koktzoglou I, Kirpalani A, Carroll TJ, Li D, Carr JC. Dark-blood MRI of the thoracic aorta with 3D diffusion-prepared steady-state free precession: initial clinical evaluation. AJR Am J Roentgenol. 2007;189(4):966–972. doi: 10.2214/AJR.07.2428. [DOI] [PubMed] [Google Scholar]
- 22.Wang J, Yarnykh VL, Hatsukami T, Chu B, Balu N, Yuan C. Improved suppression of plaque-mimicking artifacts in black-blood carotid atherosclerosis imaging using a multislice motion-sensitized driven-equilibrium (MSDE) turbo spin-echo (TSE) sequence. Magn Reson Med. 2007;58(5):973–981. doi: 10.1002/mrm.21385. [DOI] [PubMed] [Google Scholar]
- 23.Essig M, Deimling M, Hawighorst H, Debus J, van Kaick G. Assessment of cerebral gliomas by a new dark fluid sequence, high intensity REduction (HIRE): a preliminary study. J Magn Reson Imaging. 2000;11(5):506–517. doi: 10.1002/(sici)1522-2586(200005)11:5<506::aid-jmri6>3.0.co;2-d. [DOI] [PubMed] [Google Scholar]
- 24.de Bazelaire CM, Duhamel GD, Rofsky NM, Alsop DC. MR imaging relaxation times of abdominal and pelvic tissues measured in vivo at 3.0 T: preliminary results. Radiology. 2004;230(3):652–659. doi: 10.1148/radiol.2303021331. [DOI] [PubMed] [Google Scholar]
- 25.Ohtomo K, Itai Y, Yoshikawa K, Kokubo T, Iio M. Hepatocellular carcinoma and cavernous hemangioma: differentiation with MR imaging. Efficacy of T2 values at 0.35 and 1.5 T. Radiology. 1988;168(3):621–623. doi: 10.1148/radiology.168.3.2841716. [DOI] [PubMed] [Google Scholar]
- 26.Cieszanowski A, Szeszkowski W, Golebiowski M, Bielecki DK, Grodzicki M, Pruszynski B. Discrimination of benign from malignant hepatic lesions based on their T2-relaxation times calculated from moderately T2-weighted turbo SE sequence. Eur Radiol. 2002;12(9):2273–2279. doi: 10.1007/s00330-002-1366-6. [DOI] [PubMed] [Google Scholar]
- 27.Cittadini G, Santacroce E, Giasotto V, Rescinito G. Focal liver lesions: characterization with quantitative analysis of T2 relaxation time in TSE sequence with double echo time. Radiol Med. 2004;107(3):166–173. [PubMed] [Google Scholar]
- 28.Nezafat R, Stuber M, Ouwerkerk R, Gharib AM, Desai MY, Pettigrew RI. B1-insensitive T2 preparation for improved coronary magnetic resonance angiography at 3 T. Magn Reson Med. 2006;55(4):858–864. doi: 10.1002/mrm.20835. [DOI] [PubMed] [Google Scholar]
- 29.Mugler JP, III, Horger W, Kiefer B. Improved diagnostic utility of T2-weighted 3D-TSE liver imaging by suppression of vascular signals using a motion-sensitive preparation. Proceedings of the 17th scientific meeting, international society for magnetic resonance in medicine; Honolulu. 2009. p. 2069. [Google Scholar]
- 30.Wong EC, Guo J. BIR-4 based B1 and B0 insensitive velocity selective pulse trains. Proceedings of the 18th scientific meeting, international society for magnetic resonance in medicine; Stockholm. 2010. p. 2853. [Google Scholar]
- 31.Madhuranthakam AJ, Wei JL, Brittain JH, Rofsky NM, Alsop DC. Preserving signal contrast in multi-slice black blood fast spin echo. Proceedings of the 17th scientific meeting, International Society for Magnetic Resonance in Medicine; Honolulu. 2009. p. 4532. [Google Scholar]
- 32.Moseley ME, Kucharczyk J, Mintorovitch J, Cohen Y, Kurhanewicz J, Derugin N, Asgari H, Norman D. Diffusion-weighted MR imaging of acute stroke: correlation with T2-weighted and magnetic susceptibility-enhanced MR imaging in cats. AJNR Am J Neuroradiol. 1990;11(3):423–429. [PMC free article] [PubMed] [Google Scholar]
- 33.Eiber M, Holzapfel K, Ganter C, Epple K, Metz S, Geinitz H, Kubler H, Gaa J, Rummeny EJ, Beer AJ. Whole-body MRI including diffusion-weighted imaging (DWI) for patients with recurring prostate cancer: technical feasibility and assessment of lesion conspicuity in DWI. J Magn Reson Imaging. 2011;33(5):1160–1170. doi: 10.1002/jmri.22542. [DOI] [PubMed] [Google Scholar]
- 34.Fazekas F, Barkhof F, Filippi M, Grossman RI, Li DK, McDonald WI, McFarland HF, Paty DW, Simon JH, Wolinsky JS, Miller DH. The contribution of magnetic resonance imaging to the diagnosis of multiple sclerosis. Neurology. 1999;53(3):448–456. doi: 10.1212/wnl.53.3.448. [DOI] [PubMed] [Google Scholar]


