

Significance
Cervical cancer (CxCa) is the second most frequent cancer in women and the third leading cause of cancer death in women worldwide. Our global analysis of gene expression in normal, precancerous, and cancerous cervical tissue shows increased DNA replication/repair and cell proliferation followed by substantial metabolic shifts. We observed a dramatic, progressive decrease in estrogen receptor alpha (ERα) in tumor progression, and ranking specimens by estrogen-responsive gene expression correlated remarkably with histopathology. Whereas ERα expression shuts off in tumor epithelium, stromal fibroblasts in the microenvironment retain ERα, and the data indicate estrogen-related alteration of several candidate stroma–tumor signaling pathways. Our findings strongly support a role of stromal estrogen signaling in CxCa development with implications for CxCa management and control.
Keywords: cervical cancer, HPV, estrogen, tumor microenvironment, stroma
Abstract
To study the multistep process of cervical cancer development, we analyzed 128 frozen cervical samples spanning normalcy, increasingly severe cervical intraepithelial neoplasia (CIN1– CIN3), and cervical cancer (CxCa) from multiple perspectives, revealing a cascade of progressive changes. Compared with normal tissue, expression of many DNA replication/repair and cell proliferation genes was increased in CIN1/CIN2 lesions and further sustained in CIN3, consistent with high-risk human papillomavirus (HPV)-induced tumor suppressor inactivation. The CIN3-to-CxCa transition showed metabolic shifts, including decreased expression of mitochondrial electron transport complex components and ribosomal protein genes. Significantly, despite clinical, epidemiological, and animal model results linking estrogen and estrogen receptor alpha (ERα) to CxCa, ERα expression declined >15-fold from normalcy to cancer, showing the strongest inverse correlation of any gene with the increasing expression of p16, a marker for HPV-linked cancers. This drop in ERα in CIN and tumor cells was confirmed at the protein level. However, ERα expression in stromal cells continued throughout CxCa development. Our further studies localized stromal ERα to FSP1+, CD34+, SMA− precursor fibrocytes adjacent to normal and precancerous CIN epithelium, and FSP1−, CD34−, SMA+ activated fibroblasts in CxCas. Moreover, rank correlations with ERα mRNA identified IL-8, CXCL12, CXCL14, their receptors, and other angiogenesis and immune cell infiltration and inflammatory factors as candidates for ERα-induced stroma–tumor signaling pathways. The results indicate that estrogen signaling in cervical cancer has dramatic differences from ERα+ breast cancers, and imply that estrogen signaling increasingly proceeds indirectly through ERα in tumor-associated stromal fibroblasts.
Globally, cervical cancer (CxCa) is the second most common cancer in women, with >500,000 new cases each year, half of which are ultimately fatal (1). In the developed world, routine CxCa screening for abnormal cervical cytology, human papillomavirus (HPV), or both (2) has strongly reduced CxCa incidence, demonstrating the value of recognizing and removing early neoplasms (3). Such screening programs present a rare opportunity to study the sequential molecular changes in the development of a human cancer (4).
CxCa development is related to infection with high-risk oncogenic HPVs, most prominently HPV16 and HPV18 (5–7). HPV oncoproteins E6 and E7 are best known for blocking tumor suppressor functions of p53 and Rb, respectively, but have numerous additional interaction partners (8–13). Most cervical HPV infections are cleared (14), but in a fraction of cases persistent infections lead to increasingly severe grades of dysplasia (cervical intraepithelial neoplasia grades 1, 2, and 3; CIN1, CIN2, CIN3) and ultimately to invasive cancer. Although the key steps of the carcinogenic process, HPV infection, progression to precancer, and invasion to cancer (3), are widely accepted, the factors behind these transitions are not well-understood. Many established cervical cancer risk factors, such as young age at onset of sexual activity and a high number of sexual partners, are related to exposure to HPV. Risk factors that are associated with progression from HPV infection to precancer include smoking and oral contraceptive use (15, 16). The exact role of hormonal factors in progression to precancer and cancer is unclear. Mouse models strongly support the continuing importance of estrogen and estrogen receptor alpha (ERα) at all carcinogenic steps (17–19) but human data are limited, particularly regarding ERα.
Defining the molecular changes associated with CxCa progression should reveal underlying mechanisms and improve CxCa risk assessment, diagnosis, prognosis, and treatment. Accordingly, we analyzed genome-wide gene expression changes in 128 cryosectioned and laser capture microdissected (LCM) cervical tissue specimens, representing all clinically recognized stages of CxCa progression. The results revealed sequential changes in DNA replication and repair and metabolic, signaling, and other pathways, whose nature and timing imply important mechanistic principles underlying CxCa development.
We show that dramatically decreasing levels of ERα (also called ESR1) mRNA and its effects on expression of estrogen-responsive genes is closely associated with progression to CxCa. Our immunohistochemistry and immunofluorescence results confirmed ERα’s decline in epithelial lesions and tumors at the protein level, whereas revealing sustained or elevated ERα levels in stromal cells. These and other results indicate that in high-grade cervical lesions and CxCa, estrogen signaling must largely proceed indirectly through activated fibroblasts in the stromal microenvironment. These findings reveal major differences in the possible tumor-promoting effects of estrogen in CxCa and breast cancer, with corresponding clinical implications (16, 20, 21).
Results
Gene Expression Measurement and Validation.
The 128 cervical specimens were separated by histopathology into five disease stages: normal (24), CIN1 (14), CIN2 (22), CIN3 (40), and cancers (28) (Dataset S1). Except for cervical cancer specimens with more than 80% tumor content, LCM was used to enrich samples for epithelial content before gene expression analysis with full human genome Affymetrix U133 Plus 2.0 microarrays. To enhance statistical power in subsequent calculations of gene expression changes at the late transitions, the CIN1 and CIN2 lesions were analyzed as a single CIN1/CIN2 group of 36 specimens. Of 54,675 total probe sets, 6,669 (12%) measured statistically significant differential expression between disease stages (adjusted P values <0.05; gene set 1). When filtered by surrogate variable analysis to further minimize inclusion of false positives that originate from unmodeled influences such as age or random factors, 4,452 probe sets (∼8% of total) detected changes in average mRNA levels between two or more of the four disease stages (set 2; Dataset S2). Gene expression-based specimen rank correlation calculations showed with strong statistical significance that, for 14 tested genes, reverse-transcription quantitative PCR (RTQ-PCR)–based measurements of mRNA levels in 68 independently extracted cryosections spanning all four disease stages closely agreed with and thus confirmed the microarray-based data (Table 1 and Datasets S3 and S4).
Table 1.
Rank correlations between microarray- and real-time quantitative PCR–based gene expression
| Gene | Correlation* | P value |
| AR | 0.73 | 1.03E-12 |
| CDKN2A | 0.76 | 9.08E-14 |
| CHEK1 | 0.57 | 4.96E-07 |
| CXCL14 | 0.79 | 1.78E-15 |
| CXCR2 | 0.79 | 2.00E-15 |
| ESR1 (ERα) | 0.79 | 1.11E-15 |
| FN1 | 0.56 | 7.22E-07 |
| GREB1 | 0.81 | 2.22E-16 |
| IL-8 | 0.66 | 8.34E-10 |
| MTHFD1L | 0.32 | 7.51E-03 |
| MUC4 | 0.76 | 8.30E-14 |
| PGR | 0.76 | 3.13E-14 |
| SOD2 | 0.51 | 9.79E-06 |
| VEGFA | 0.55 | 9.12E-07 |
According to calculation model 4, as further explained in Dataset S3.
A Cascade of Gene Expression Changes in Distinct Molecular Processes Culminates at Late Stages of Cervical Cancer Progression.
Of the 4,452 probe sets in set 2, 2,084 followed one of five progressive trajectories of changes in gene expression across disease-stage categories (set 3; Dataset S2). Fig. 1A shows that 67, 59, 213, 57, and 1,688 probe sets were associated with early, early-to-mid, mid, mid-to-late, and late changes, respectively, showing a cascade of molecular changes dramatically culminating in numerous gene expression changes at the final transition to invasive cancer. Gene Ontology (GO) enrichment and Ingenuity System Pathways Analysis (IPA) of these 2,084 probe sets revealed many notable biological pathways (Dataset S5). Top GO terms were hierarchically clustered in the binary plots shown in Fig. 1B, revealing groups of related GO classes enriched for multiple differentially expressed genes, further described below.
Fig. 1.

Differential gene expression and biological processes affected during cervical cancer progression. (A) Heatmap presentations of gene expression levels measured by 2,084 Affymetrix probe sets measuring genes whose expression predominantly increases or decreases at only one disease-stage transition. (B) Blue/red plots hierarchically clustered Gene Ontology classes that are enriched for these genes and reveal prominent GO clusters (circled) annotated (Right). Full details on gene expression measurements and GO enrichment analyses are provided in Datasets S2 and S5, respectively.
Cell-Cycle and Proliferation-Related Genes Are Up-Regulated in Early Normal-to-CIN1/2 Transitions and Sustained in CIN3.
Previously, we reported that increased expression of particular subsets of cell cycle-related genes and increased cell proliferation so distinguish HPV-positive from HPV-negative head and neck cancers that, by gene expression, HPV-positive head and neck cancers resemble CxCas more than HPV-negative head and neck cancers (22). Here we found that these changes were already manifest in the earliest CIN1/2 lesions (Fig. 1, GO clusters I and II), consistent with early transformation by HPV. Examples of genes with increased expression in CIN1/2 lesions compared with normal tissue included CDKN2A (>20-fold), SYCP2 (>5-fold), and CHEK1 (>4-fold) (Dataset S2). Expression of the CDKN2A gene product p16INK4a is a widely established marker of HPV oncogene activity (23–26). Specimen rank correlations were calculated to determine which other gene expression levels ranked specimens similar to CDKN2A level-based ranking. The highest rank positive correlations with CDKN2A included genes with roles in DNA replication and DNA repair, such as MCM genes, RAD51, PRIM1, and APOBEC3B (Table 2 and Dataset S6). These changes in CIN1/2s were retained or enhanced through progression to CIN3 and cancer.
Table 2.
Average gene expression rank correlations with P16/CDKN2A expression as measured by probe sets 207039_at and 209644_x_at
| Probe set | Gene | Correlation |
| Positive rank correlations | ||
| 207039_at | CDKN2A | 0.896 |
| 209644_x_at | CDKN2A | 0.896 |
| 225655_at | UHRF1 | 0.735 |
| 222036_s_at | MCM4 | 0.727 |
| 216237_s_at | MCM5 | 0.724 |
| 203022_at | RNASEH2A | 0.717 |
| 218039_at | NUSAP1 | 0.712 |
| 222680_s_at | DTL | 0.710 |
| 205339_at | STIL | 0.709 |
| 226456_at | C16orf75 | 0.705 |
| 227211_at | PHF19 | 0.701 |
| 205024_s_at | RAD51 | 0.701 |
| 201930_at | MCM6 | 0.700 |
| 206632_s_at | APOBEC3B | 0.700 |
| 203209_at | RFC5 | 0.696 |
| 202107_s_at | MCM2 | 0.695 |
| 209408_at | KIF2C | 0.695 |
| 223274_at | TCF19 | 0.691 |
| 202338_at | TK1 | 0.690 |
| 202954_at | UBE2C | 0.689 |
| 205053_at | PRIM1 | 0.686 |
| 212141_at | MCM4 | 0.686 |
| 205909_at | POLE2 | 0.682 |
| 209773_s_at | RRM2 | 0.680 |
| Negative rank correlations | ||
| 205225_at | ESR1 (ERa) | −0.590 |
| 225817_at | CGNL1 | −0.587 |
| 212681_at | EPB41L3 | −0.582 |
| 207943_x_at | PLAGL1 | −0.565 |
| 215304_at | — | −0.539 |
| 236562_at | ZNF439 | −0.533 |
| 207002_s_at | PLAGL1 | −0.533 |
| 208399_s_at | EDN3 | −0.531 |
| 232136_s_at | CTTNBP2 | −0.525 |
| 206142_at | ZNF135 | −0.521 |
| 208712_at | CCND1 | −0.518 |
| 58367_s_at | ZNF419 | −0.515 |
| 206710_s_at | EPB41L3 | −0.514 |
| 213456_at | SOSTDC1 | −0.513 |
| 228346_at | ZNF844 | −0.509 |
| 212441_at | KIAA0232 | −0.506 |
| 219932_at | SLC27A6 | −0.504 |
| 204041_at | MAOB | −0.502 |
| 1554547_at | FAM13C | −0.491 |
| 205862_at | GREB1 | −0.487 |
| 232855_at | — | −0.486 |
| 232366_at | KIAA0232 | −0.486 |
| 205325_at | PHYHIP | −0.483 |
| 202967_at | GSTA4 | −0.481 |
Genes Encoding Ribosomal Proteins and Mitochondrial Electron Transport Components Are Down-Regulated in Cervical Cancers.
By far the highest number of gene expression changes occurred between CIN3 and CxCa (Fig. 1). These mid-to-late transitions deregulated energy metabolism, ribosomal function and protein synthesis, inflammatory response, endocrine system development, and cell morphology regulation (Dataset S5). Although early changes mostly represented gene expression increases, CIN1/2-to-CIN3-to-cancer transitions progressively included decreases in gene expression (Fig. 1 and Dataset S5).
The mRNA levels for large and small ribosomal subunit proteins decreased by 30–50% in cancers compared with CIN3 (GO clusters VI and VII in Fig. 1, Fig. 2A, and Dataset S7). This included 24 small ribosomal subunit protein genes and 35 large ribosomal subunit protein genes, or >70% of all ribosomal proteins. These results imply that compared with normal epithelium and precancerous CIN lesions, protein synthesis in cervical cancers does not increase and may in fact be reduced. GO clusters VIII and XII in Fig. 1 indicated important changes in mitochondrial functions during the transition from CIN3 to cancer, affecting 261 (12.6%) of 2,074 mitochondrial protein gene probe sets [MitoCarta (27); Dataset S8]. Most apparent was regulation of mitochondrial electron transport chain (ETC) complexes I, III, IV, and V. Of 183 probe sets measuring the ETC genes, 50 were in the set 2 list of significantly differentially expressed genes. Fig. 2B shows that 37 of 94 mRNAs encoding proteins in the five ETC complexes increased slightly during the early disease stages but then significantly decreased in cancers. This strongly suggested reduced dependence on energy production by oxidative phosphorylation during the late stages of cancer progression, commonly known as the Warburg effect (28, 29). That not all mitochondrial functions were reduced was evident from increased expression levels for a group of genes with roles in folate-based one-carbon metabolism (MTHFD2, MTHFD1L, GLDC, SHMT2, SLC25A32) important for DNA synthesis, repair, and methylation (30). Likewise, increased levels of mitochondrial superoxide dismutase 2 (SOD2) in some cancers indicated enhanced mitochondrial detoxification mechanisms (31).
Fig. 2.

Expression of genes encoding ribosomal proteins and mitochondrial electron transport chain complexes I, III, IV, and V is reduced at the transition from CIN3 to cancer. (A) Twenty-four small and 35 large ribosomal subunit proteins (∼70% of all ribosomal proteins) are expressed at statistically significant reduced levels in cancers compared with precancerous CIN3 lesions. Histograms show measurements in cancers by all 177 Affymetrix microarray probe sets for ribosomal protein-encoding genes, normalized to levels measured in CIN3s. (B) Green dots in the five complexes of the mitochondrial electron transport chain indicate proteins with reduced gene expression in cancers. Box plots (Tukey) show the average distribution of gene expression of all differentially expressed ETC complex I, III, IV, and V components (median levels are in red).
Epithelial Estrogen Receptor α Expression Decreases Throughout Disease Progression.
Prior clinical, epidemiological, and animal model results suggest that estrogen and ERα are critical to CxCa development and maintenance (16, 20, 21). Consistent with this, 217 of 1,115 genes previously characterized as estrogen-responsive in breast tissue [Dataset S9 (32)] showed strong differential expression across the cervical samples analyzed here. Hierarchical clustering of the 128 cervical specimens based on the expression of these 217 estrogen-responsive genes largely recapitulated sample ordering by disease stage (Fig. 3A), confirming the strong link between estrogen effects and CxCa progression.
Fig. 3.

Differential expression of estrogen-responsive genes correlates strongly with cervical cancer progression. (A) Hierarchical clustering of 128 specimens based on changes in gene expression measured by 365 Affymetrix probe sets measuring expression of 217 estrogen-responsive genes shows strong correlation with disease progression. (B) Box plots (Tukey) show the distribution of Affymetrix microarray-based gene expression measurements of CDKN2A (p16), ERα, and estrogen-responsive genes GREB1, PGR1, and AR. White and red horizontal lines indicate median expression levels.
However, despite this further evidence of estrogen importance in CxCa, ERα mRNA levels plunged 15-fold during progression from normal to CxCa (Fig. 3B). This decline was so progressive and precipitous that ERα/ESR1 expression showed the highest negative rank correlation across the entire genome with the increasing expression of p16/CDKN2A (Table 2 and Dataset S6). Reduced ERα mRNA levels were not simply due to negative feedback on ESR1 transcription from a large population of activated ERα protein, because expression of known direct targets of ERα, estrogen-responsive genes encoding GREB1, and steroid hormone nuclear receptors for androgen (AR) and progesterone (PGR) also progressively decreased with cancer development (Fig. 3B). Moreover, below we confirm ERα’s parallel decline at the protein level.
Estrogen Receptor α Becomes Progressively Exclusive to the Stromal Microenvironment.
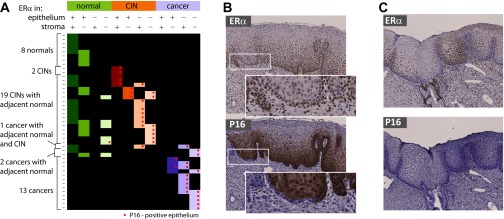
To further investigate the continuous decrease in ERα expression, we used immunohistochemistry (IHC) to visualize the ERα and p16 proteins in representative formaldehyde-fixed, paraffin-embedded sections case-matched to 45 of the 128 frozen samples studied above and that collectively spanned the complete disease range. Fig. 4A illustrates as an example ERα and p16 IHC stains in a specimen that displays all stages and transitions of complete disease progression. Magnified views of areas of transition from normal to neoplastic epithelium in Fig. 4B show that ERα expression is lost as the epithelium becomes increasingly neoplastic and positive for p16, culminating in cancerous tissue where ERα is exclusively expressed in the interspersed, p16-negative stroma. Seventy-seven observations of epithelium and adjacent stroma in the 45 specimens (Fig. 4C) further illustrated at a cell level the loss of epithelial ERα during disease progression, whereas stromal ERα expression remained essentially unchanged. Fig. S1 provides more detailed information on how ERα expression in epithelium versus stroma was scored as double-positive, single-positive, or double-negative phenotypes, how that related to epithelial p16 expression, and which of multiple observations were derived from single specimens.
Fig. 4.

Negative correlation between ERα and p16 expression during cervical cancer progression. (A) IHC stains for ERα (Top) and p16 (Bottom) in a cervical specimen representing complete disease progression. (B) Higher magnifications (I–IV) show that ERα resides in the nuclei of dividing cells in stratified differentiating normal healthy epithelium (I), is lost from progressively p16-positive undifferentiated epithelial CIN lesions (II and III), and is entirely lacking in cancerous epithelium (IV), and that ERα becomes exclusive to interspersed stroma. (C) Epithelial and adjacent stromal distribution of ERα by disease pathology, based on 77 observations in 43 individual specimens, shows loss of ERα in epithelium but not in stroma.
Fig. S1.
ERα and p16 transitional expression phenotypes. (A) Overview of IHC observations for ERα and p16 from 43 specimens shows distinct local sites of varying levels of disease progression within single sections, accompanied by changes in epithelial distribution of ERα in epithelium and stroma. Cancer progression gravitates toward epithelial loss of ERα expression and increased expression of p16. (B) Example of a specimen with ERα-positive epithelium throughout but with p16 staining progressing from the right-hand side of the image. A single epithelial lobe at the border of p16-negative and p16-positive epithelium shows reduced ERα staining and ERα-positive/p16-negative basal epithelium (Insets). (C) Example of a specimen with distinct convoluted epithelial regions with reduced ERα staining that are nevertheless still negative for p16.
In some early CIN lesions, ERα expression was lost apparently before full expression of p16 whereas in other cases ERα was still expressed in cells already positive for p16 expression (Fig. S1), but in more severe lesions and cancers, ERα and p16 expression were largely mutually exclusive. In conclusion, IHC confirmed that the extreme inverse correlation of p16 and ERα gene expression levels was reflected at the protein level and provided strong evidence that loss of ERα expression, like increased p16 expression, is a signature of cervical cancer progression, with most normal epithelia but few cancer epithelia expressing ERα.
Stromal Estrogen Receptor α Resides in Fibroblasts.
To further investigate a potential role for stromal ERα, we sought to identify the relevant ERα-positive cell type(s). We used immunofluorescence assays (IFA) on cervical tissue microarrays containing normal, CINs, and cancers to survey for colocalization of known cell type-specific markers with ERα-positive cells. Markers tested included a panel of keratins for epithelial cells, fibroblast-specific protein FSP1, CD34 for hematopoietic progenitor cells and fibrocytes (33), CD68 for monocytes/macrophages (34), CD45 as a general lymphocyte marker (35), α-smooth muscle actin (αSMA) for activated fibroblasts (36), and vimentin (VIM) for mesenchymal cells (37). Immunofluorescence staining for p16 was used to delineate CIN3 and cancer epithelium (Fig. 5A). In Fig. 5B, dual immunofluorescence labeling for ERα plus the above markers shows that in normal tissue and CIN lesions, stromal ERα localized to the nuclei of a subset of highly abundant FSP1 and CD34-positive cells with a fibroblastic appearance. With progression to cancer, ERα positivity was largely restricted to cells that were FSP1- and CD34-negative and increasingly αSMA-positive and only occasionally VIM-positive. Many stromal cells were αSMA-positive in cancerous stroma, indicating an increase in fibroblast activation, although not all of these activated fibroblasts uniformly expressed ERα. ERα was not expressed in CD45-positive hematopoietic-lineage cells or CD68-positive macrophages. Keratin stains were absent from stroma, suggesting that the ERα-positive cells in the stroma were not of epithelial origin.
Fig. 5.

ERα costains stromal fibroblasts. (A) Low-magnification immunofluorescent ERα, p16, and DAPI in three cervical specimens representing disease progression. With increased expression of p16 in CIN epithelium and epithelial cancer compartments, ERα expression is lost and becomes restricted to stroma. (B) Higher magnifications of tissues stained with various cell-type markers show that in normal and precancerous lesions, ERα resides in the nuclei of stromal cells that stain positive for FSP1 and CD34. Only a subset of ERα-positive cancer-associated stromal cells expresses CD34 and is increasingly positive for αSMA and occasionally also for vimentin. ERα is not expressed in CD45-positive hematopoietic cells and CD68-positive macrophages.
Discussion
Our analysis of cervical tissue gene expression data showed a cascade of molecular changes in the progression from HPV infection to CxCa. We highlighted specific biological processes in disease progression as a basis toward a better understanding of the molecular mechanisms that drive cervical cancer development. In particular, we emphasized and further documented the loss of ERα expression during cancer progression. Gene expression studies like ours provide “snapshots” of the state of the tissues and are thus influenced by many factors including timing and methods of procurement and analysis, but our observations were generally in good agreement with previous reports (e.g., 38–41). Recently, squamocolumnar (SC) cervical junction cells have been predicted to be a primary candidate for the source of carcinogenic HPV-induced cervical carcinogenesis (42). Although we did not specifically target SC cells, interestingly, four of five signature SC junction markers (KRT7, AGR2, MMP7, and GDA) were consistently elevated in CIN1/2 and further enhanced in CIN3 whereas expressed at lower levels in cancers.
Early Events in Cervical Cancer Development.
Early cervical lesions predominantly showed increased expression of genes with functions in DNA replication and cell division. This is consistent with the histological transition of the cervical epithelial lining from typically stratified epithelium toward a gradually more convoluted configuration in which many more cells are actively dividing. The changes between CIN1/2 and CIN3 were largely a continuation and expansion of those observed between normal healthy epithelium and CIN1/2s. Molecularly, the position of CIN2 with respect to CIN1 and CIN3 is poorly defined. Some CIN2s showed a gene expression profile more similar to CIN3 whereas others were closer to CIN1, and grouping CIN2 with CIN3 instead of CIN1 did not significantly alter the main conclusions.
Early increase in DNA replication and cell division is likely closely linked to HPV infection. The current study predominantly used HPV16-positive specimens (Dataset S1) and, accordingly, correlative analysis of the data did not support stratification of differences in gene expression as a function of differences in HPV status or genotype. However, in our previous analyses of head and neck cancer where only a subset of specimens was HPV-positive, we showed that HPV drives a mechanism to increase a proliferative index that is largely similar to the situation in cervical cancers, whereas gene expression signatures in the ∼75% HPV-negative head and neck cancers showed different cell proliferation-promoting mechanisms (22). Further links between HPV infection, DNA repair, and chromosomal instability have been documented (43, 44). For example, DNA repair functions in the FANC family of proteins have been shown to be triggered by HPV oncoproteins E6 and E7 and may explain FANC gene-based genetically increased susceptibility to HPV-associated squamous cell carcinomas (44–48).
Late Changes During Cancer Progression.
The CIN3-to-cancer transition showed dramatically reduced expression of proteins in the mitochondrial electron transport chain, implying reduced dependence on oxidative phosphorylation as a source for ATP and redirection from oxidative phosphorylation toward anaerobic glycolysis, that is, the “Warburg effect” (28, 29), at the later stages of cancer progression. HPVs stabilize hypoxia inducible factor 1 alpha (HIF1α) (49, 50), and other oncogenic and nononcogenic DNA viruses likewise have reported action on HIF1α and mitochondrial metabolism (51), which may promote the Warburg effect. Other mitochondrial changes included up-regulation of folate metabolism, consistent with increased one-carbon metabolism needed to generate purines, AdoMet, and other metabolites (52, 53) to support DNA synthesis, repair, and epigenetic regulation through DNA methylation during rapid cell proliferation. Up-regulated DNA methyltransferase 1 transcription in CINs and cancers was consistent with such demand. Increased mRNA levels of mitochondrial SOD2 in some CxCas suggested active mechanisms to counteract elevated levels of reactive oxygen deleterious for cellular health and survival (54).
The decreased expression of ribosomal protein genes implies reduced capacity for protein synthesis in cervical cancer, which seems inconsistent with the need for accelerated cancer cell growth and division. Oncogenic and tumor-suppressing functions have been assigned to individual ribosomal proteins (55), and although our results do not exclude regulation of such functions in cervical cancer, the apparent concerted down-regulation of >70% of the ribosomal proteins strongly suggests that the effect predominantly targets ribosomal biogenesis. An alternative explanation is that general gene transcription in cervical cancer is up-regulated whereas ribosomal protein gene transcription remains constant, which would result in an observed down-regulation of the latter. A candidate mediator of both general transcription enhancement and specific ribosome biogenesis regulation is c-Myc (56, 57).
ERα Expression and Function: Stromal vs. Tumor Roles.
The continuous, dramatic decrease in ERα expression throughout CxCa progression (Figs. 3–5) is particularly interesting in light of growing demonstrations of estrogen and ERα dependence in CxCa development and maintenance. These data include increased CxCa risk with long-term oral contraceptive use and multiple pregnancies (16, 58) and overexpression of aromatase, the key enzyme in estrogen biosynthesis, in approximately one-third of CxCas (21). In mouse models transgenic for HPV16 E6 and E7, our reports and others demonstrate that estrogen and ERα are critical for CxCa development (17, 19, 20). Consistent with the results presented here, decreased ERα levels in human cervical cancer cell lines and tumors and its correlation with invasiveness have been reported recently, although this was argued to reflect a lack of ERα action in late stages of CxCa (59, 60). The more extensive analysis presented here shows that the progressive depletion of ERα expression occurs in the context of extensive, coordinated alterations in expression of estrogen-responsive genes (Fig. 3) and with the preservation or increased abundance of stromal ERα-positive fibroblasts in CxCas (Fig. 5). Paralleling and complementing our findings in humans, our mouse studies show that ERα is critical both to develop CxCa and to maintain established CxCas (19, 20), and that ERα action in CxCa at least requires and might act completely through stromal expression (61).
These growing findings on ERα expression and function in CxCa, together with critical roles of signaling by cancer-associated fibroblasts in other cancers (62), imply that in human as well as mouse CxCa, ERα acts largely through paracrine stroma-to-tumor signaling. This is notably distinct from estrogen signaling in breast cancer, where estrogen responsiveness is associated with ERα expression in tumor cells. In cervical tumors, the strong inverse correlation between expression of ERα and p16, an established marker for HPV infection, suggests that the loss of ERα change might be driven fairly directly by HPV, presumably by oncogenes E6 and/or E7, for example through modulation of the polycomb repressor complex to drive general epigenetic reprogramming (63).
IHC and IFA showed ERα expression in a subset of stromal fibroblasts that with CxCa progression were decreasingly positive for precursor markers FSP1 and CD34 and increasingly positive for fibroblast activation marker SMA. The absence of stromal keratin and a generally VIM-negative fibroblast population disfavored the possibility that the ERα-positive stromal cells arise by epithelial-to-mesenchymal transition. The results suggest that the ERα-positive activated fibroblasts in cancer stroma originate from ERα- and CD34-positive resting fibroblast progenitors observed in healthy or CIN-associated stroma. Alternatively, these cells might have been newly recruited to the tumor site, resembling wound healing, consistent with the denser cellularity of cancer-associated stroma.
Overall changes in estrogen-responsive gene expression provided a strong signature for disease progression (Fig. 3). Many genes identified as estrogen-responsive in breast cancer studies followed the decrease in ERα expression but others showed increased expression levels, suggesting that estrogen may act through multiple direct and indirect pathways as well as major differences in estrogen effects on breast and reproductive tissues (64).
Specimen rank correlations for expression of all genes with ERα (Dataset S6) revealed close linkage with ERα for several growth factors, chemokines, pro- and antiinflammatory cytokines, and their receptors (Table 3). Leading examples are cytokine ligands CXCL12 (65) whose increased expression recently was associated with HPV infection (66), CXCL14, and increased expression of interleukin 8 (IL-8) and decreased expression of its receptor CXCR2. Continuous elevation of IL-8 mRNA levels throughout cervical cancer development indicates inflammatory response, angiogenesis, and possibly epithelial-to-mesenchymal transition (EMT) (67–69). IL-8, CXCL12, and CXCL14 all function in recruiting monocytes to tumors (70, 71). IL-8 has also been reported involved in EMT during carcinogenesis (69). We did measure increased levels of VEGFA and VIM in at least some of the analyzed CxCas and our immunofluorescence shows occasional expression of VIM in stroma of lesions and cancers (Fig. 5), but EMT does not appear a major factor in CxCa progression.
Table 3.
Cell signaling gene expression rank correlations with ERα expression as measured by probe set 205225_at
| Probe set | Gene | Correlation |
| Positive rank correlations | ||
| 219304_s_at | PDGFD | 0.659 |
| 207008_at | CXCR2 | 0.542 |
| 203638_s_at | FGFR2 | 0.441 |
| 205403_at | IL1R2 | 0.425 |
| 208228_s_at | FGFR2 | 0.425 |
| 218589_at | LPAR6 | 0.418 |
| 236449_at | CSTB | 0.409 |
| 237038_at | CXCL14 | 0.406 |
| 230252_at | LPAR5 | 0.395 |
| 205015_s_at | TGFA | 0.388 |
| 222484_s_at | CXCL14 | 0.381 |
| 201201_at | CSTB | 0.372 |
| 211372_s_at | IL1R2 | 0.371 |
| 218002_s_at | CXCL14 | 0.346 |
| 224560_at | TIMP2 | 0.336 |
| 205863_at | S100A12 | 0.325 |
| 219115_s_at | IL-20RA | 0.273 |
| 203666_at | CXCL12 | 0.256 |
| Negative rank correlations | ||
| 212171_x_at | VEGFA | −0.514 |
| 206569_at | IL-24 | −0.488 |
| 211375_s_at | ILF3 | −0.424 |
| 206026_s_at | TNFAIP6 | −0.396 |
| 202859_x_at | IL-8 | −0.379 |
| 221058_s_at | CKLF | −0.369 |
| 209875_s_at | SPP1 | −0.353 |
| 219161_s_at | CKLF | −0.350 |
| 227345_at | TNFRSF10D | −0.321 |
| 202638_s_at | ICAM1 | −0.319 |
| 206025_s_at | TNFAIP6 | −0.298 |
| 200052_s_at | ILF2 | −0.284 |
| 218368_s_at | TNFRSF12A | −0.283 |
| 208931_s_at | ILF3 | −0.258 |
Estrogen receptor beta (ESR2 or ERβ) was not detectably expressed (data are available through the Gene Expression Omnibus), confirming our earlier histochemistry observations (18). This further distinguishes cervical cancer from breast cancer, where ERβ is expressed and negatively modulates ERα’s activity through heterodimerization (72). This could be at the basis of why many breast tumors respond favorably to estrogen receptor blockers such as tamoxifen, whereas adverse effects are observed in cervical and endometrial cancers (64). A proposed role for stromal expression of the endothelial protein TIE2 in estrogen-driven angiogenesis in breast cancers (73) is potentially consistent with our own immunofluorescence-based observation of TIE2 expression in cervical stroma, although we found that TIE2 expression is not restricted to ERα-positive stromal cells and is also moderately expressed in the epithelium.
The molecular mechanisms underlying higher cell proliferation and accompanying shifts in metabolism, hormonal regulation, and other tumor-promoting processes are likely highly interconnected. For example, increased IL-8 levels are linked to estrogen receptor-negative breast cancer (74), reminiscent of the inverse correlation between progressively decreasing ERα and increasing IL-8 as demonstrated here for CxCa progression. In head and neck squamous cell carcinoma, frequently associated with HPV infection, IL-8 up-regulation often coincides with down-regulation of stromal ligand CXCL14 (75), as also measured here for CxCa. Our current observations provide guidance and new leads toward understanding these multifactorial aspects of cancer progression.
Materials and Methods
SUCCEED Study.
With informed consent and approval of the Human Subject Research Institutional Review Boards at the University of Wisconsin–Madison, the National Cancer Institute, and the University of Oklahoma Health Sciences Center, women were recruited into the Study to Understand Cervical Cancer Early Endpoints and Determinants (SUCCEED). Of 2,847 women age 18 or older, ∼67% were white, ∼15% were Black or African American, ∼5% were American Indian/Alaskan Native, ∼1% were Asian, and ∼15% were Hispanic. Dataset S1 provides the clinical assessment of the set of 128 specimens used for the current study. Further details on the SUCCEED study have been provided previously (15).
Cryosectioning, Histology, and Laser Capture Microdissection.
Fresh-frozen cervical samples acquired under SUCCEED were cryosectioned to provide a series of 10- to 12-µm sections. Hematoxylin and eosin stains were used for histopathology and tissue integrity review and to assign lesion grade. Sections adjacent to the evaluated section were hematoxylin-stained for a few seconds and dehydrated through increasing ethanol concentrations. A PixCell II Laser Capture Microdissection System (Applied Biosystems/Arcturus) was then used to capture the epithelial lining of the cervix from normal healthy control specimens or precancerous and invasive cancerous cell masses from cervical lesions. Cancer specimens with more than 80% tumor content were processed as whole sections.
RNA Extraction, Amplification, Labeling, and Microarray-Based Gene Expression Analysis.
Specimens were processed for comprehensive human mRNA-level measurements essentially as described previously (22). Briefly, RNA was extracted using TRIzol according to the manufacturer’s instructions (Invitrogen) and used to generate T7 RNA polymerase promoter-linked, oligo(dT)-primed double-stranded cDNA, which was then used as a template to produce T7 transcripts complementary to all human and viral mRNAs (cRNA). These T7 transcripts were then subjected to a second round of cDNA synthesis and T7 RNA polymerase-based amplification. From 227 specimens processed, 128 epithelial RNA extracts yielded cRNA of sufficiently high quality for Affymetrix U133 Plus 2.0 microarray analysis.
Gene Expression Data Analysis.
Microarray data were acquired in four batches and analyzed using R statistical programming and Bioconductor (76). A four-step data analysis included the following: (i) data preprocessing via within-batch GC-RMA (77) to accommodate background noise and array-to-array variation and summarize probe-level data to log2-scale probe set values, and (ii) identifying the strongest expression changes associated with histopathological tissue class. One filter accommodated batch effects and the multiplicity of samples per patient, and a second filter accommodated potential effects of unmeasured/unmodeled factors. For each probe set, a linear mixed-effects model was fitted over the n = 128 samples using the R function lmer in the package lme4 (78). Log2 expression values were decomposed as a sum of fixed and random effects: fixed effects characterized technical differences between sample batches and biological differences among the four histopathological tissue classes; random patient effects accommodated possible correlation between multiple tissues from the same patient. To identify significant tissue-class effects, we used the likelihood ratio test statistic calibrated by 105 random permutations of the tissue-class assignment vector. Permutation P values were corrected for multiplicity using the Benjamini–Hochberg method (79). Set 1 holds N1 = 6,669 probe sets with an adjusted P value less than 5%. To protect against false-positive probe sets caused by unmeasured or unmodeled factors, surrogate-variable analysis (SVA) was applied to the entire expression dataset (80). We required that the multiplicity-adjusted P value for tissue-class effect in the SVA fixed-effects model was less than 20% and that the probe set was already in set 1. The resulting final set of N2 = 4,452 probe sets was the core focus for analysis of differential gene expression (set 2; Dataset S2). (iii) A mixture model-based clustering was applied to probe sets in set 2, using the LNNMV model in EBarrays (81), to identify groups of genes associated with disease progression. EBarrays grouped probe sets into distinct clusters according to trajectories of mean expression over the four disease stages. Set 3 (Dataset S2) records N3 = 2,084 probe sets mapping strongly to one of five dominant trajectory clusters identified through the mixture modeling. (iv) Identified gene clusters were integrated with functional data using gene set enrichment analysis applied to Gene Ontology terms (82) and computed using random-set scoring (83). The full GO analysis results are provided in Dataset S5. Heatmaps in Fig. 1B were constructed using asymmetric binary distance on the gene-content vectors to visualize the enriched GO terms. Independently, the larger set 2 probe set list of all altered gene expression regardless of transitional pattern was analyzed using Ingenuity Systems Pathway Analysis software (www.ingenuity.com). IPA uses a database of genetic and molecular functional interactions to identify and visualize networks and pathways of functionally related genes, proteins, and small molecules based on enriched presence on an interrogated list such as our gene lists. A comprehensive set of lists of IPA networks is provided in Dataset S5.
Gene Expression Measurements by Real-Time Quantitative PCR.
An additional cryosection from each of 16 normal specimens, 13 CIN1/CIN2 specimens, 23 CIN3 specimens, and 16 cancer specimens was used to independently validate the Affymetrix microarray-based mRNA profiling data by RTQ-PCR. Using the criteria and procedures described above, RNA was extracted from whole sections or laser-captured epithelial cells and used for cDNA synthesis, T7 RNA polymerase-based linear amplification, and subsequent second-round cDNA synthesis as previously done in preparation for microarray-based assays. Using TaqMan technology-based RTQ-PCR with a Bio-Rad CFX96 RTQ-PCR thermocycler and SsoFast Probes Supermix reagents according to the manufacturer’s instructions, 1-µL aliquots of 20-µL final cDNA preparations were used to determine the cDNA levels of 14 mRNAs: AR, CDKN2A, CHEK1, CXCL14, CXCR2, ERα, FN1, GREB1, IL-8, MTHFD1L, MUC4, PGR, SOD2, and VEGFA. Levels of ACTB and GAPDH mRNAs were measured for normalization. Reference measurements to generate standard curves were obtained using serial dilutions of plasmid-cloned, gene-specific fragments containing primer/probe set target sequences for each of the 16 mRNAs. Dataset S3 provides gene-specific primer/probe set sequence information, and Dataset S4 lists the measured values.
Rank Correlation of RTQ-PCR Data and Affymetrix Microarray Data.
The RTQ-PCR measurements for ACTB and GAPDH for each specimen highly correlated, and we used the GAPDH RTQ-PCR measurements to normalize the data to correct for differences in numbers of cells analyzed and differences in RNA recovery. Using rank correlation methods in the R statistical programming language (84), the normalized RTQ-PCR–based measurements were compared with the Affymetrix microarray-based data for the expression of each of the genes in the same subset of 68 tissue specimens. Dataset S3 lists the calculated rank correlation values according to four different models using different approaches to accommodate the fact that most genes were represented by multiple Affymetrix probe sets and that some transcripts were not detected by RTQ-PCR in a small number of specimens. In models 1 and 3, specimen rankings derived from all multiple Affymetrix probe sets were averaged. In models 2 and 4, to reduce the contribution of background noise in the Affymetrix microarray-based data, for each individual gene, only specimen rankings derived from probe sets that robustly measured gene expression levels in any of the defined disease stages were used to calculate ranking averages. In models 1 and 2, missing RTQ-PCR values were ignored for RTQ-PCR–based specimen ranking. Models 3 and 4 assumed that missing RTQ-PCR values reflected levels of mRNA below threshold detection sensitivity, substituted missing values by the lowest measurement for each particular gene, and ranked specimens accordingly. Calculations used the following definitions and equations: Gene G in RTQ-PCR data has expression profile x; gene G is measured by k Affymetrix probe sets with expression profiles y1, …, yk; gene G’s rank correlation equals (rank(x), ). Calculation of P values tested the H0 hypothesis that the rank correlation is 0. In each of the four calculation models, the microarray-based and RTQ-PCR–based specimen rank correlations had a high probability with generally very low P values. Table 1 shows the correlations between RTQ-PCR–based specimen ranking and their corresponding microarray-based specimen ranking and the associated probabilities derived in model 4.
Gene Expression Rank Correlations.
Specimens were ranked according to gene expression levels of CDKN2A (Affymetrix probe sets 207039_at and 209644_x_at) or ESR1/ERα (Affymetrix probe set 205225_at), and Spearman Rho statistics were used to calculate the rank correlations with all other probe sets. Asymptotic t distribution was used to calculate the corresponding P values using the null hypothesis of zero rank correlation. Calculated rank correlations with values >0.25 or <−0.25 for genes in set 2 are provided in Dataset S6.
Immunohistochemistry and Immunofluorescence.
For peroxidase-based immunohistochemistry, sections of formaldehyde-fixed, paraffin-embedded (FFPE) cervical tissue specimens were derived from the same subset of cases that were used for RTQ-PCR measurements. Tissue microarrays of FFPE cervical biopsy cores (US Biomax; CR602) were used for immunofluorescence assays. Samples were deparaffinized through xylene and rehydrated in graded ethanols; endogenous peroxidase activity was quenched with 3% (vol/vol) H2O2 for 10 min. For antigen retrieval, slides were heated in 10 mM citrate (pH 6.0) with 0.5% Tween-20 for 40 min at 95 °C in a rice steamer (IHC-Tek; IW-1102). After a 20-min cool down at room temperature, sections were washed in PBS and incubated overnight at 4 °C with anti-ERα (DAKO, clone SP1, 1:500 or DAKO, clone 1D5, 1:500) and anti-p16INK4A (Ventana, “Ready to Use” clone E6H4, or CINtec PLUS, 9537 for simultaneous detection of p16/ki67), anti-αSMA (Sigma; clone1A4, 1:400), anti-FSP1 (Sigma; HPA007973, 1:500), anti-CD34 (DAKO; clone QBEnd1-10, 1:250), anti-CD45 (DAKO; clones 2B11 and PD7/26, 1:100), anti-CD68 (DAKO; clone PG-M1, 1:500), anti-VIM (DAKO; clone V9, 1:500), or anti–pan-keratin (Santa Cruz; clone C11, 1:250). Slides were washed in PBS and incubated for 1 h at room temperature with AlexaFluor 350 and AlexaFluor 588-linked secondary antibodies at 1:200 dilution. Following immunostaining, 300 ng/mL DAPI was used to visualize nuclei. Images were captured using Nuance Multispectral Microscopy and inForm advanced image analysis software (Caliper Life Sciences/PerkinElmer).
Supplementary Material
Acknowledgments
We are extremely grateful for the participation of the many women enrolled in our studies. We thank Jane Weeks for cryosectioning, George Flentke and Jamie Ahrens for assistance with LCM, and Denis Lee and Ginger Pocock for assistance with IHC and IFA, as well as many other colleagues and students for assistance and helpful expertise in interpretation of results. The research was funded in part by NIH Grant CA22443 and by support provided by the Morgridge Institute for Research. P.A. is an Investigator of the Howard Hughes Medical Institute.
Footnotes
The authors declare no conflict of interest.
Data deposition: A complete set of Affymetrix CEL files and GC-RMA–normalized gene expression values for all individual tissue specimens reported in this paper has been deposited in the Gene Expression Omnibus (GEO) database, www.ncbi.nlm.nih.gov/geo (accession no. GSE63514).
This article contains supporting information online at www.pnas.org/lookup/suppl/doi:10.1073/pnas.1509322112/-/DCSupplemental.
References
- 1. World Health Organization (2015) Human papillomavirus (HPV) and cervical cancer, Fact Sheet No 380. Available at www.who.int/mediacentre/factsheets/fs380/en/. Accessed May 26, 2015.
- 2.Wentzensen N, Schiffman M. Filling a gap in cervical cancer screening programmes. Lancet Oncol. 2014;15(3):249–251. doi: 10.1016/S1470-2045(14)70073-7. [DOI] [PMC free article] [PubMed] [Google Scholar]
- 3.Schiffman M, Wentzensen N. Human papillomavirus infection and the multistage carcinogenesis of cervical cancer. Cancer Epidemiol Biomarkers Prev. 2013;22(4):553–560. doi: 10.1158/1055-9965.EPI-12-1406. [DOI] [PMC free article] [PubMed] [Google Scholar]
- 4.Hanahan D, Weinberg RA. Hallmarks of cancer: The next generation. Cell. 2011;144(5):646–674. doi: 10.1016/j.cell.2011.02.013. [DOI] [PubMed] [Google Scholar]
- 5.zur Hausen H. Papillomaviruses in the causation of human cancers—A brief historical account. Virology. 2009;384(2):260–265. doi: 10.1016/j.virol.2008.11.046. [DOI] [PubMed] [Google Scholar]
- 6.Walboomers JM, et al. Human papillomavirus is a necessary cause of invasive cervical cancer worldwide. J Pathol. 1999;189(1):12–19. doi: 10.1002/(SICI)1096-9896(199909)189:1<12::AID-PATH431>3.0.CO;2-F. [DOI] [PubMed] [Google Scholar]
- 7.Stanley M. Pathology and epidemiology of HPV infection in females. Gynecol Oncol. 2010;117(2) Suppl:S5–S10. doi: 10.1016/j.ygyno.2010.01.024. [DOI] [PubMed] [Google Scholar]
- 8.Howie HL, Katzenellenbogen RA, Galloway DA. Papillomavirus E6 proteins. Virology. 2009;384(2):324–334. doi: 10.1016/j.virol.2008.11.017. [DOI] [PMC free article] [PubMed] [Google Scholar]
- 9.Lee C, Wooldridge TR, Laimins LA. Analysis of the roles of E6 binding to E6TP1 and nuclear localization in the human papillomavirus type 31 life cycle. Virology. 2007;358(1):201–210. doi: 10.1016/j.virol.2006.08.028. [DOI] [PubMed] [Google Scholar]
- 10.Liu Y, et al. Multiple functions of human papillomavirus type 16 E6 contribute to the immortalization of mammary epithelial cells. J Virol. 1999;73(9):7297–7307. doi: 10.1128/jvi.73.9.7297-7307.1999. [DOI] [PMC free article] [PubMed] [Google Scholar]
- 11.McLaughlin-Drubin ME, Münger K. The human papillomavirus E7 oncoprotein. Virology. 2009;384(2):335–344. doi: 10.1016/j.virol.2008.10.006. [DOI] [PMC free article] [PubMed] [Google Scholar]
- 12.Moody CA, Laimins LA. Human papillomavirus oncoproteins: Pathways to transformation. Nat Rev Cancer. 2010;10(8):550–560. doi: 10.1038/nrc2886. [DOI] [PubMed] [Google Scholar]
- 13.Münger K, et al. Mechanisms of human papillomavirus-induced oncogenesis. J Virol. 2004;78(21):11451–11460. doi: 10.1128/JVI.78.21.11451-11460.2004. [DOI] [PMC free article] [PubMed] [Google Scholar]
- 14.Rodríguez AC, et al. Proyecto Epidemiológico Guanacaste Group Rapid clearance of human papillomavirus and implications for clinical focus on persistent infections. J Natl Cancer Inst. 2008;100(7):513–517. doi: 10.1093/jnci/djn044. [DOI] [PMC free article] [PubMed] [Google Scholar]
- 15.Wang SS, et al. Human papillomavirus cofactors by disease progression and human papillomavirus types in the Study to Understand Cervical Cancer Early Endpoints and Determinants. Cancer Epidemiol Biomarkers Prev. 2009;18(1):113–120. doi: 10.1158/1055-9965.EPI-08-0591. [DOI] [PMC free article] [PubMed] [Google Scholar]
- 16.Luhn P, et al. The role of co-factors in the progression from human papillomavirus infection to cervical cancer. Gynecol Oncol. 2013;128(2):265–270. doi: 10.1016/j.ygyno.2012.11.003. [DOI] [PMC free article] [PubMed] [Google Scholar]
- 17.Arbeit JM, Howley PM, Hanahan D. Chronic estrogen-induced cervical and vaginal squamous carcinogenesis in human papillomavirus type 16 transgenic mice. Proc Natl Acad Sci USA. 1996;93(7):2930–2935. doi: 10.1073/pnas.93.7.2930. [DOI] [PMC free article] [PubMed] [Google Scholar]
- 18.Chung SH, Wiedmeyer K, Shai A, Korach KS, Lambert PF. Requirement for estrogen receptor alpha in a mouse model for human papillomavirus-associated cervical cancer. Cancer Res. 2008;68(23):9928–9934. doi: 10.1158/0008-5472.CAN-08-2051. [DOI] [PMC free article] [PubMed] [Google Scholar]
- 19.Chung SH, Franceschi S, Lambert PF. Estrogen and ERalpha: Culprits in cervical cancer? Trends Endocrinol Metab. 2010;21(8):504–511. doi: 10.1016/j.tem.2010.03.005. [DOI] [PMC free article] [PubMed] [Google Scholar]
- 20.Chung SH, Lambert PF. Prevention and treatment of cervical cancer in mice using estrogen receptor antagonists. Proc Natl Acad Sci USA. 2009;106(46):19467–19472. doi: 10.1073/pnas.0911436106. [DOI] [PMC free article] [PubMed] [Google Scholar]
- 21.Nair HB, et al. Induction of aromatase expression in cervical carcinomas: Effects of endogenous estrogen on cervical cancer cell proliferation. Cancer Res. 2005;65(23):11164–11173. doi: 10.1158/0008-5472.CAN-05-1087. [DOI] [PubMed] [Google Scholar]
- 22.Pyeon D, et al. Fundamental differences in cell cycle deregulation in human papillomavirus-positive and human papillomavirus-negative head/neck and cervical cancers. Cancer Res. 2007;67(10):4605–4619. doi: 10.1158/0008-5472.CAN-06-3619. [DOI] [PMC free article] [PubMed] [Google Scholar]
- 23.Cuschieri K, Wentzensen N. Human papillomavirus mRNA and p16 detection as biomarkers for the improved diagnosis of cervical neoplasia. Cancer Epidemiol Biomarkers Prev. 2008;17(10):2536–2545. doi: 10.1158/1055-9965.EPI-08-0306. [DOI] [PMC free article] [PubMed] [Google Scholar]
- 24.Klaes R, et al. Overexpression of p16(INK4A) as a specific marker for dysplastic and neoplastic epithelial cells of the cervix uteri. Int J Cancer. 2001;92(2):276–284. doi: 10.1002/ijc.1174. [DOI] [PubMed] [Google Scholar]
- 25.Sano T, Oyama T, Kashiwabara K, Fukuda T, Nakajima T. Expression status of p16 protein is associated with human papillomavirus oncogenic potential in cervical and genital lesions. Am J Pathol. 1998;153(6):1741–1748. doi: 10.1016/S0002-9440(10)65689-1. [DOI] [PMC free article] [PubMed] [Google Scholar]
- 26.Wentzensen N, von Knebel Doeberitz M. Biomarkers in cervical cancer screening. Dis Markers. 2007;23(4):315–330. doi: 10.1155/2007/678793. [DOI] [PMC free article] [PubMed] [Google Scholar]
- 27.Pagliarini DJ, et al. A mitochondrial protein compendium elucidates complex I disease biology. Cell. 2008;134(1):112–123. doi: 10.1016/j.cell.2008.06.016. [DOI] [PMC free article] [PubMed] [Google Scholar]
- 28.Ward PS, Thompson CB. Metabolic reprogramming: A cancer hallmark even Warburg did not anticipate. Cancer Cell. 2012;21(3):297–308. doi: 10.1016/j.ccr.2012.02.014. [DOI] [PMC free article] [PubMed] [Google Scholar]
- 29.Hsu PP, Sabatini DM. Cancer cell metabolism: Warburg and beyond. Cell. 2008;134(5):703–707. doi: 10.1016/j.cell.2008.08.021. [DOI] [PubMed] [Google Scholar]
- 30.Tibbetts AS, Appling DR. Compartmentalization of mammalian folate-mediated one-carbon metabolism. Annu Rev Nutr. 2010;30:57–81. doi: 10.1146/annurev.nutr.012809.104810. [DOI] [PubMed] [Google Scholar]
- 31.Melov S. Mitochondrial oxidative stress. Physiologic consequences and potential for a role in aging. Ann N Y Acad Sci. 2000;908:219–225. doi: 10.1111/j.1749-6632.2000.tb06649.x. [DOI] [PubMed] [Google Scholar]
- 32.Tang S, Han H, Bajic VB. ERGDB: Estrogen Responsive Genes Database. Nucleic Acids Res. 2004;32(Database issue):D533–D536. doi: 10.1093/nar/gkh083. [DOI] [PMC free article] [PubMed] [Google Scholar]
- 33.Katz FE, Tindle R, Sutherland DR, Greaves MF. Identification of a membrane glycoprotein associated with haemopoietic progenitor cells. Leuk Res. 1985;9(2):191–198. doi: 10.1016/0145-2126(85)90082-7. [DOI] [PubMed] [Google Scholar]
- 34.Parwaresch MR, Radzun HJ, Kreipe H, Hansmann ML, Barth J. Monocyte/macrophage-reactive monoclonal antibody Ki-M6 recognizes an intracytoplasmic antigen. Am J Pathol. 1986;125(1):141–151. [PMC free article] [PubMed] [Google Scholar]
- 35.Trowbridge IS, Thomas ML. CD45: An emerging role as a protein tyrosine phosphatase required for lymphocyte activation and development. Annu Rev Immunol. 1994;12:85–116. doi: 10.1146/annurev.iy.12.040194.000505. [DOI] [PubMed] [Google Scholar]
- 36.Skalli O, et al. A monoclonal antibody against alpha-smooth muscle actin: A new probe for smooth muscle differentiation. J Cell Biol. 1986;103(6 Pt 2):2787–2796. doi: 10.1083/jcb.103.6.2787. [DOI] [PMC free article] [PubMed] [Google Scholar]
- 37.Steinert PM, Roop DR. Molecular and cellular biology of intermediate filaments. Annu Rev Biochem. 1988;57:593–625. doi: 10.1146/annurev.bi.57.070188.003113. [DOI] [PubMed] [Google Scholar]
- 38.Zhai Y, et al. Gene expression analysis of preinvasive and invasive cervical squamous cell carcinomas identifies HOXC10 as a key mediator of invasion. Cancer Res. 2007;67(21):10163–10172. doi: 10.1158/0008-5472.CAN-07-2056. [DOI] [PubMed] [Google Scholar]
- 39.Gius D, et al. Profiling microdissected epithelium and stroma to model genomic signatures for cervical carcinogenesis accommodating for covariates. Cancer Res. 2007;67(15):7113–7123. doi: 10.1158/0008-5472.CAN-07-0260. [DOI] [PubMed] [Google Scholar]
- 40.Wilting SM, et al. Integrated genomic and transcriptional profiling identifies chromosomal loci with altered gene expression in cervical cancer. Genes Chromosomes Cancer. 2008;47(10):890–905. doi: 10.1002/gcc.20590. [DOI] [PMC free article] [PubMed] [Google Scholar]
- 41.Rajkumar T, et al. Identification and validation of genes involved in cervical tumourigenesis. BMC Cancer. 2011;11:80. doi: 10.1186/1471-2407-11-80. [DOI] [PMC free article] [PubMed] [Google Scholar]
- 42.Herfs M, et al. A discrete population of squamocolumnar junction cells implicated in the pathogenesis of cervical cancer. Proc Natl Acad Sci USA. 2012;109(26):10516–10521. doi: 10.1073/pnas.1202684109. [DOI] [PMC free article] [PubMed] [Google Scholar]
- 43.Duensing S, Münger K. Human papillomaviruses and centrosome duplication errors: Modeling the origins of genomic instability. Oncogene. 2002;21(40):6241–6248. doi: 10.1038/sj.onc.1205709. [DOI] [PubMed] [Google Scholar]
- 44.Wang SS, et al. Common variants in immune and DNA repair genes and risk for human papillomavirus persistence and progression to cervical cancer. J Infect Dis. 2009;199(1):20–30. doi: 10.1086/595563. [DOI] [PMC free article] [PubMed] [Google Scholar]
- 45.Kutler DI, et al. Human papillomavirus DNA and p53 polymorphisms in squamous cell carcinomas from Fanconi anemia patients. J Natl Cancer Inst. 2003;95(22):1718–1721. doi: 10.1093/jnci/djg091. [DOI] [PubMed] [Google Scholar]
- 46.Lowy DR, Gillison ML. A new link between Fanconi anemia and human papillomavirus-associated malignancies. J Natl Cancer Inst. 2003;95(22):1648–1650. doi: 10.1093/jnci/djg125. [DOI] [PubMed] [Google Scholar]
- 47.Park JW, et al. Deficiencies in the Fanconi anemia DNA damage response pathway increase sensitivity to HPV-associated head and neck cancer. Cancer Res. 2010;70(23):9959–9968. doi: 10.1158/0008-5472.CAN-10-1291. [DOI] [PMC free article] [PubMed] [Google Scholar]
- 48.Spardy N, et al. The human papillomavirus type 16 E7 oncoprotein activates the Fanconi anemia (FA) pathway and causes accelerated chromosomal instability in FA cells. J Virol. 2007;81(23):13265–13270. doi: 10.1128/JVI.01121-07. [DOI] [PMC free article] [PubMed] [Google Scholar]
- 49.Nakamura M, et al. Hypoxia-specific stabilization of HIF-1alpha by human papillomaviruses. Virology. 2009;387(2):442–448. doi: 10.1016/j.virol.2009.02.036. [DOI] [PMC free article] [PubMed] [Google Scholar]
- 50.Tang X, et al. Overexpression of human papillomavirus type 16 oncoproteins enhances hypoxia-inducible factor 1 alpha protein accumulation and vascular endothelial growth factor expression in human cervical carcinoma cells. Clin Cancer Res. 2007;13(9):2568–2576. doi: 10.1158/1078-0432.CCR-06-2704. [DOI] [PubMed] [Google Scholar]
- 51.Mazzon M, et al. A mechanism for induction of a hypoxic response by vaccinia virus. Proc Natl Acad Sci USA. 2013;110(30):12444–12449. doi: 10.1073/pnas.1302140110. [DOI] [PMC free article] [PubMed] [Google Scholar]
- 52.Crider KS, Yang TP, Berry RJ, Bailey LB. Folate and DNA methylation: A review of molecular mechanisms and the evidence for folate’s role. Adv Nutr. 2012;3(1):21–38. doi: 10.3945/an.111.000992. [DOI] [PMC free article] [PubMed] [Google Scholar]
- 53.Stover PJ. One-carbon metabolism-genome interactions in folate-associated pathologies. J Nutr. 2009;139(12):2402–2405. doi: 10.3945/jn.109.113670. [DOI] [PMC free article] [PubMed] [Google Scholar]
- 54.Holley AK, Bakthavatchalu V, Velez-Roman JM, St Clair DK. Manganese superoxide dismutase: Guardian of the powerhouse. Int J Mol Sci. 2011;12(10):7114–7162. doi: 10.3390/ijms12107114. [DOI] [PMC free article] [PubMed] [Google Scholar]
- 55.Amsterdam A, et al. Many ribosomal protein genes are cancer genes in zebrafish. PLoS Biol. 2004;2(5):E139. doi: 10.1371/journal.pbio.0020139. [DOI] [PMC free article] [PubMed] [Google Scholar]
- 56.Nie Z, et al. c-Myc is a universal amplifier of expressed genes in lymphocytes and embryonic stem cells. Cell. 2012;151(1):68–79. doi: 10.1016/j.cell.2012.08.033. [DOI] [PMC free article] [PubMed] [Google Scholar]
- 57.van Riggelen J, Yetil A, Felsher DW. MYC as a regulator of ribosome biogenesis and protein synthesis. Nat Rev Cancer. 2010;10(4):301–309. doi: 10.1038/nrc2819. [DOI] [PubMed] [Google Scholar]
- 58.Appleby P, et al. International Collaboration of Epidemiological Studies of Cervical Cancer Cervical cancer and hormonal contraceptives: Collaborative reanalysis of individual data for 16,573 women with cervical cancer and 35,509 women without cervical cancer from 24 epidemiological studies. Lancet. 2007;370(9599):1609–1621. doi: 10.1016/S0140-6736(07)61684-5. [DOI] [PubMed] [Google Scholar]
- 59.Zhai Y, et al. Loss of estrogen receptor 1 enhances cervical cancer invasion. Am J Pathol. 2010;177(2):884–895. doi: 10.2353/ajpath.2010.091166. [DOI] [PMC free article] [PubMed] [Google Scholar]
- 60.Kwasniewska A, et al. Estrogen and progesterone receptor expression in HPV-positive and HPV-negative cervical carcinomas. Oncol Rep. 2011;26(1):153–160. doi: 10.3892/or.2011.1256. [DOI] [PubMed] [Google Scholar]
- 61.Chung SH, Shin MK, Korach KS, Lambert PF. Requirement for stromal estrogen receptor alpha in cervical neoplasia. Horm Cancer. 2013;4(1):50–59. doi: 10.1007/s12672-012-0125-7. [DOI] [PMC free article] [PubMed] [Google Scholar]
- 62.Cirri P, Chiarugi P. Cancer associated fibroblasts: The dark side of the coin. Am J Cancer Res. 2011;1(4):482–497. [PMC free article] [PubMed] [Google Scholar]
- 63.McLaughlin-Drubin ME, Munger K. Biochemical and functional interactions of human papillomavirus proteins with polycomb group proteins. Viruses. 2013;5(5):1231–1249. doi: 10.3390/v5051231. [DOI] [PMC free article] [PubMed] [Google Scholar]
- 64.Friedrich M, Mink D, Villena-Heinsen C, Woll-Hermann A, Schmidt W. Tamoxifen and proliferation of vaginal and cervical epithelium in postmenopausal women with breast cancer. Eur J Obstet Gynecol Reprod Biol. 1998;80(2):221–225. doi: 10.1016/s0301-2115(98)00117-1. [DOI] [PubMed] [Google Scholar]
- 65.Hall JM, Korach KS. Stromal cell-derived factor 1, a novel target of estrogen receptor action, mediates the mitogenic effects of estradiol in ovarian and breast cancer cells. Mol Endocrinol. 2003;17(5):792–803. doi: 10.1210/me.2002-0438. [DOI] [PubMed] [Google Scholar]
- 66.Chow KY, et al. A pivotal role for CXCL12 signaling in HPV-mediated transformation of keratinocytes: Clues to understanding HPV-pathogenesis in WHIM syndrome. Cell Host Microbe. 2010;8(6):523–533. doi: 10.1016/j.chom.2010.11.006. [DOI] [PubMed] [Google Scholar]
- 67.Waugh DJ, Wilson C. The interleukin-8 pathway in cancer. Clin Cancer Res. 2008;14(21):6735–6741. doi: 10.1158/1078-0432.CCR-07-4843. [DOI] [PubMed] [Google Scholar]
- 68.Fernando RI, Castillo MD, Litzinger M, Hamilton DH, Palena C. IL-8 signaling plays a critical role in the epithelial-mesenchymal transition of human carcinoma cells. Cancer Res. 2011;71(15):5296–5306. doi: 10.1158/0008-5472.CAN-11-0156. [DOI] [PMC free article] [PubMed] [Google Scholar]
- 69.Palena C, Hamilton DH, Fernando RI. Influence of IL-8 on the epithelial-mesenchymal transition and the tumor microenvironment. Future Oncol. 2012;8(6):713–722. doi: 10.2217/fon.12.59. [DOI] [PMC free article] [PubMed] [Google Scholar]
- 70.Koch AE, et al. Interleukin-8 as a macrophage-derived mediator of angiogenesis. Science. 1992;258(5089):1798–1801. doi: 10.1126/science.1281554. [DOI] [PubMed] [Google Scholar]
- 71.Rosenkilde MM, Schwartz TW. The chemokine system—A major regulator of angiogenesis in health and disease. APMIS. 2004;112(7-8):481–495. doi: 10.1111/j.1600-0463.2004.apm11207-0808.x. [DOI] [PubMed] [Google Scholar]
- 72.Zhao C, et al. Estrogen receptor beta2 negatively regulates the transactivation of estrogen receptor alpha in human breast cancer cells. Cancer Res. 2007;67(8):3955–3962. doi: 10.1158/0008-5472.CAN-06-3505. [DOI] [PubMed] [Google Scholar]
- 73.Péqueux C, et al. Stromal estrogen receptor-α promotes tumor growth by normalizing an increased angiogenesis. Cancer Res. 2012;72(12):3010–3019. doi: 10.1158/0008-5472.CAN-11-3768. [DOI] [PubMed] [Google Scholar]
- 74.Freund A, et al. IL-8 expression and its possible relationship with estrogen-receptor-negative status of breast cancer cells. Oncogene. 2003;22(2):256–265. doi: 10.1038/sj.onc.1206113. [DOI] [PMC free article] [PubMed] [Google Scholar]
- 75.Maehata Y, et al. Reactive oxygen species (ROS) reduce the expression of BRAK/CXCL14 in human head and neck squamous cell carcinoma cells. Free Radic Res. 2010;44(8):913–924. doi: 10.3109/10715762.2010.490836. [DOI] [PubMed] [Google Scholar]
- 76.Gentleman RC, et al. Bioconductor: Open software development for computational biology and bioinformatics. Genome Biol. 2004;5(10):R80. doi: 10.1186/gb-2004-5-10-r80. [DOI] [PMC free article] [PubMed] [Google Scholar]
- 77.Wu ZJ, Irizarry RA, Gentleman R, Martinez-Murillo F, Spencer F. A model-based background adjustment for oligonucleotide expression arrays. J Am Stat Assoc. 2004;99(468):909–917. [Google Scholar]
- 78.Bates D, Mächler M, Bolker BM, Walker SC. Fitting linear mixed-effects models using lme4. J Stat Softw. 2014;arXiv:1406.5823. [Google Scholar]
- 79.Benjamini Y, Hochberg Y. Controlling the false discovery rate: A practical and powerful approach to multiple testing. Journal of the Royal Statistical Society. Series B (Methodological) 1995;57:289–300. [Google Scholar]
- 80.Leek JT, Storey JD. Capturing heterogeneity in gene expression studies by surrogate variable analysis. PLoS Genet. 2007;3(9):1724–1735. doi: 10.1371/journal.pgen.0030161. [DOI] [PMC free article] [PubMed] [Google Scholar]
- 81.Kendziorski CM, Newton MA, Lan H, Gould MN. On parametric empirical Bayes methods for comparing multiple groups using replicated gene expression profiles. Stat Med. 2003;22(24):3899–3914. doi: 10.1002/sim.1548. [DOI] [PubMed] [Google Scholar]
- 82.Ashburner M, et al. The Gene Ontology Consortium Gene Ontology: Tool for the unification of biology. Nat Genet. 2000;25(1):25–29. doi: 10.1038/75556. [DOI] [PMC free article] [PubMed] [Google Scholar]
- 83.Newton MA, Quintana FA, den Boon JA, Sengupta S, Ahlquist P. Random-set methods identify distinct aspects of the enrichment signal in gene-set analysis. Ann Appl Stat. 2007;1(1):85–106. [Google Scholar]
- 84.Ihaka R, Gentleman R. R: A language for data analysis and graphics. J Comput Graph Stat. 1996;5(3):299–314. [Google Scholar]
Associated Data
This section collects any data citations, data availability statements, or supplementary materials included in this article.