Significance
The bacterial flagellum is a molecular machine for the locomotion of bacteria. The flagellar motor can convert the motive force of protons and other ions to molecular motor rotations. We report on the multi-ion transfer mechanism of the flagellar motor stator MotA/B in Escherichia coli, which primarily utilizes protons. We have identified a leucine amino acid residue as the gateway for H3O+ diffusion. Mutations of a key valine residue cause a narrowing of the channel that is consistent with the size-dependent ion selectivity. We also show that the protonation/deprotonation cycle induces a ratchet motion in the stator, which can couple to the motor rotation. Ion selectivity and the ratchet motion are key to understanding the mechanism of the flagellar motor.
Keywords: proton transfer, bacterial flagellar motor, channel gating, ratchet motion, molecular dynamics
Abstract
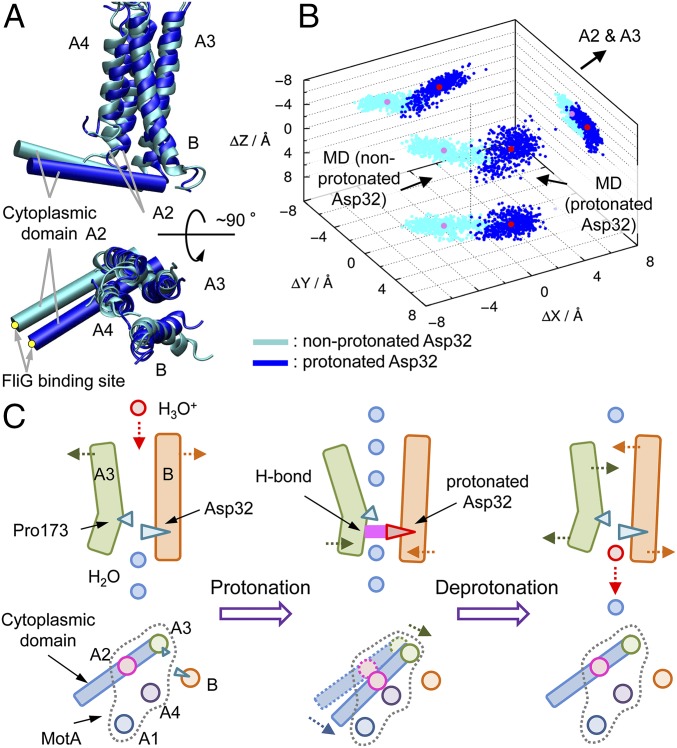
The proton permeation process of the stator complex MotA/B in the flagellar motor of Escherichia coli was investigated. The atomic model structure of the transmembrane part of MotA/B was constructed based on the previously published disulfide cross-linking and tryptophan scanning mutations. The dynamic permeation of hydronium/sodium ions and water molecule through the channel formed in MotA/B was observed using a steered molecular dynamics simulation. During the simulation, Leu46 of MotB acts as the gate for hydronium ion permeation, which induced the formation of water wire that may mediate the proton transfer to Asp32 on MotB. Free energy profiles for permeation were calculated by umbrella sampling. The free energy barrier for H3O+ permeation was consistent with the proton transfer rate deduced from the flagellar rotational speed and number of protons per rotation, which suggests that the gating is the rate-limiting step. Structure and dynamics of the MotA/B with nonprotonated and protonated Asp32, Val43Met, and Val43Leu mutants in MotB were investigated using molecular dynamics simulation. A narrowing of the channel was observed in the mutants, which is consistent with the size-dependent ion selectivity. In MotA/B with the nonprotonated Asp32, the A3 segment in MotA maintained a kink whereas the protonation induced a straighter shape. Assuming that the cytoplasmic domain not included in the atomic model moves as a rigid body, the protonation/deprotonation of Asp32 is inferred to induce a ratchet motion of the cytoplasmic domain, which may be correlated to the motion of the flagellar rotor.
Bacterial flagella are multifuel engines that convert ion motive force to molecular motor rotation. Escherichia coli has a few proton-driven flagellar motors with stators (protein MotA/B complex) in the inner membrane that act as proton channels (1–5). In addition, Vibrio alginolyticus has a polar flagellum powered by sodium ions (6). Bacillus alcalophilus has motors driven by rubidium (Rb+), potassium (K+), and sodium ions (Na+) that can be converted to Na+-driven motors by a single mutation (7).
The proton transfer mechanism in membrane proteins is associated with water wire and/or a hydrogen bond chain (HBC) (8, 9). The water wire comprises water molecules aligned in a protein channel, where protons are transferred by hopping along the wire. Protons are conducted through the hydrogen bonds formed by the polar amino acid residues and water molecules along the proton transfer pathway in the HBC. Protons can also be transferred by diffusion of hydronium ions (H3O+). The diffusion distance in a hydrophilic environment is short in a liquid (the lifetime in water is ca. 1 ps) (10, 11), but it should be longer in a more hydrophobic environment. H3O+ forms a hydrogen bond (H bond) with the nearest neighbor water molecules and the carbonyl groups, and proton hopping along the H bonds is faster than diffusion of Na+ and K+ in the ion channel of Gramicidin A (12, 13).
These flagellar motors can rotate in both clockwise (CW) and counterclockwise (CCW) directions (viewed from the outside of the cell), and the swimming pattern of the bacteria is controlled by reversal of the motor rotation (14). In E. coli, the FliG, FliM, FliN, MotA, and MotB proteins are involved with torque generation (Fig. 1A) (14, 15). FliG, FliM, and FliN constitute the flagellar rotor and are also involved with the CW/CCW switching. Each rotor is typically surrounded by 10 stators that consist of two membrane proteins, MotA and MotB (PomA and PomB in V. alginolyticus). Each stator is composed of four MotA and two MotB proteins, and can independently produce torque for flagellar rotation.
Fig. 1.
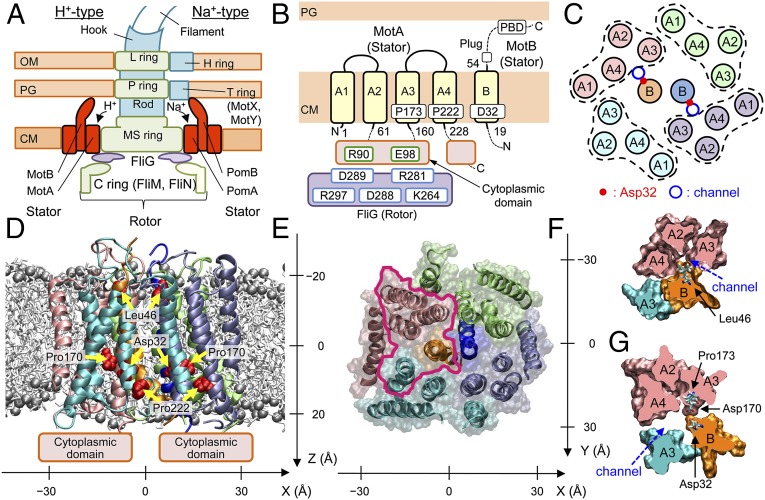
Overall structure of MotA/B. (A) Schematic views of the flagellar motors of E. coli (Left) and V. alginolyticus (Right), (B) TM regions modeled, and (C) TM helix arrangement in the initial modeling of MotA/B in E. coli. The obtained atomic model structure viewed parallel to the membrane (D) and from the periplasmic side (E). Spheres denote P atoms in the lipid head groups. MotA/B cross sections of the area enclosed by magenta in E around a channel at the levels of Leu46 (F) and Asp32 (G). x, y, and z axes are defined as in D and E.
Systematic Cys and Trp mutagenesis (16–20) has provided essential information on the structure and function of the flagellar motor. Each MotA (295 residues) contains four transmembrane (TM) alpha helical segments (A1–A4), two short loops in the periplasm, and two long segments (residues 61–160 and 228–295) in the cytoplasm (Fig. 1B) (3, 21). Arg90 and Glu98 on the MotA cytoplasmic domain interact with the polar residues on the rotor protein, FliG, during the rotation of the motor (22, 23). It has been suggested that Pro173 and Pro222 at the cytoplasmic sides of A3 and A4 regulate the conformational changes required for torque generation (24). MotB (308 residues) is composed of a short N-terminal cytoplasimic segment, one TM helix (B), and a large C-terminal periplasmic domain (Fig. 1B) (4, 5). Asp32, which is situated near the cytoplasmic end of the B segment, is conserved across the species and considered to be the most plausible proton binding site (25). The B segment is expected to form a proton channel together with A3 and A4 (Fig. 1C) (17). Only a few polar residues have been identified in the predicted TM segments of MotA/B (19, 20), which implies that the channel surface should be relatively hydrophobic. The periplasmic region of MotB has a peptidoglycan binding motif, which anchors the stator complex to the peptidoglycan layer around the rotor (5, 26). Deletion of residues 52–65 just after the B segment causes proton leakage and cell growth arrest, which suggests that this fragment acts as a plug to suppress proton leakage (27). The generation of torque is hypothesized to originate from the conformational changes of the MotA cytoplasmic domain upon proton association/dissociation at the carboxyl group of Asp32 on MotB and by the interaction with FliG in the rotor (28–31).
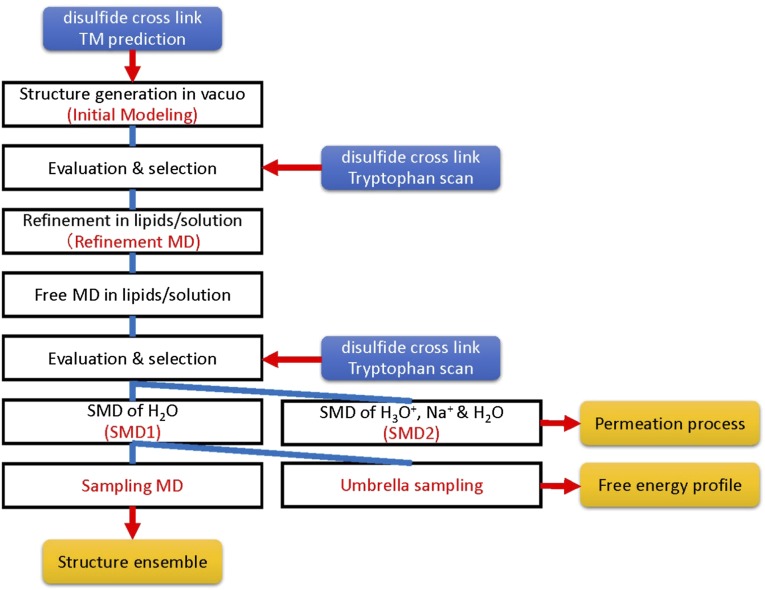
In the present study, the mechanism for proton permeation in MotA/B was investigated (Fig. S1). The atomic structure of MotA/B was constructed based on the disulfide cross-linking (16–18) and tryptophan scanning mutations (19, 20). The dynamic permeation of hydronium ions, sodium ions, and water molecules was observed using a steered molecular dynamics (SMD) simulation (32–34), and free energy profiles for ion/water permeation were calculated by umbrella sampling. The effects of amino acid substitutions related to ion selectivity was investigated, and the possible ratchet motion of the cytoplasmic domain induced by protonation/deprotonation cycle of Asp32 was examined.
Fig. S1.
Overall scheme of this study.
Results and Discussion
Structure Modeling.
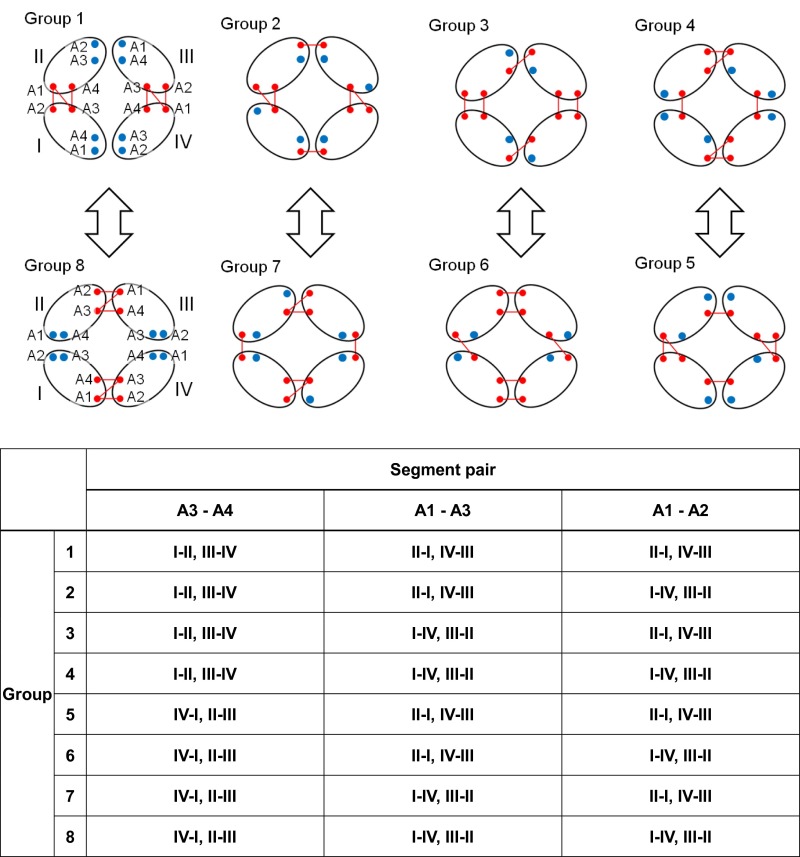
The TM regions of the MotA/B complex (residues 1–61 and 160–228 of MotA and 19–54 of MotB) were considered. The former residues are equivalent to the A1–A4 segments, two loops, connecting A1 to A2 and A3 to A4, and the additional five residues at the ends of A1–A4 (Fig. 1B). The latter corresponds to the B segment and the additional five residues at both ends. The MotA/B complex structure was constructed based on disulfide cross-linking (16–18) and Trp scanning mutations (19, 20) by a method similar to the NMR structure determination with distance restraints (35); however, a more careful procedure was conducted to avoid overfitting and to examine possible inconsistencies that can be caused by potential ambiguities in the structural information. The side-chain to side-chain restraints were applied to the cross-linked residue pairs with significantly high yields (S-S restraints hereafter; 41 Cys mutations, 83 restraints, Dataset S1) using weak restraint forces, which allow relatively large distance violations (SI Text). The remaining cross-linking information (164 Cys mutations, 882 distance pairs, Dataset S1) and the effects of 67 Trp mutations on E. coli swarming rates (Dataset S1) were solely used to examine consistency upon selection of the optimal structure. The TM segments were initially arranged in a similar way to that for the model reported by Kim et al. (Fig. 1C) (18) and the A1−A2 and A3−A4 loops were modeled. Double Cys mutants of MotA were yielded as their dimers and tetramers (17, 18). The MotA/B complex contains four MotA proteins; therefore, all of the possible combinations of the TM segment pairs were considered for the dimer-forming S-S restraints, which resulted in eight distinct initial models (groups 1–8; see Fig. S2 and Dataset S1). The S-S pairs that produced the dimers and tetramers are expected to be relatively close in space, although their possible distance ranges are not obvious. Therefore, weak restraint forces with respect to the typical NMR structure determination were applied to all of the distance restraints (SI Text), which allow relatively large distance violation. In total, 356 distance restraints were applied to the main-chain hydrogen bonds of the helical segments predicted by ClustalX (18, 36) (H-bond restraints; Fig. S3 and Dataset S1). The distance restraints were imposed between both ends of the A1−A4 and A2−A3 helix pairs (E-E restraints).
Fig. S2.
Relations between the S-S restraint groups (groups 1−8) that form distinct dimers among MotA subunits. The pairs of the groups connected by arrows are topologically the same if MotA or MotB (not shown) is rotated by 90°. I−VI show distinct MotA subunits.
Fig. S3.
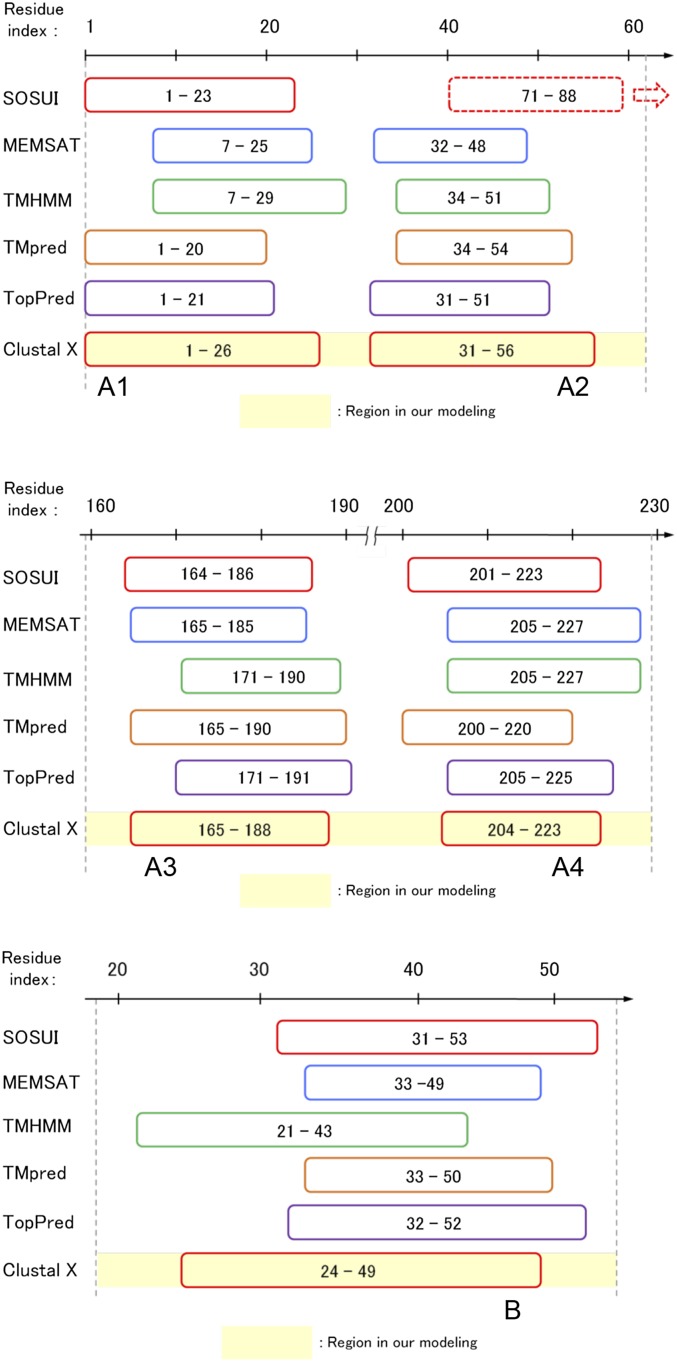
The results of the TM segment prediction.
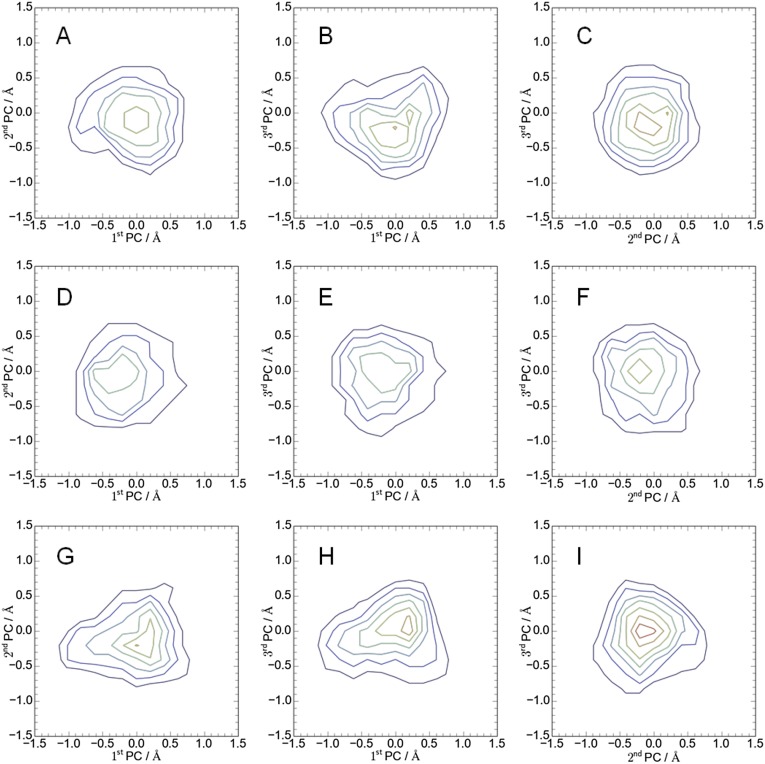
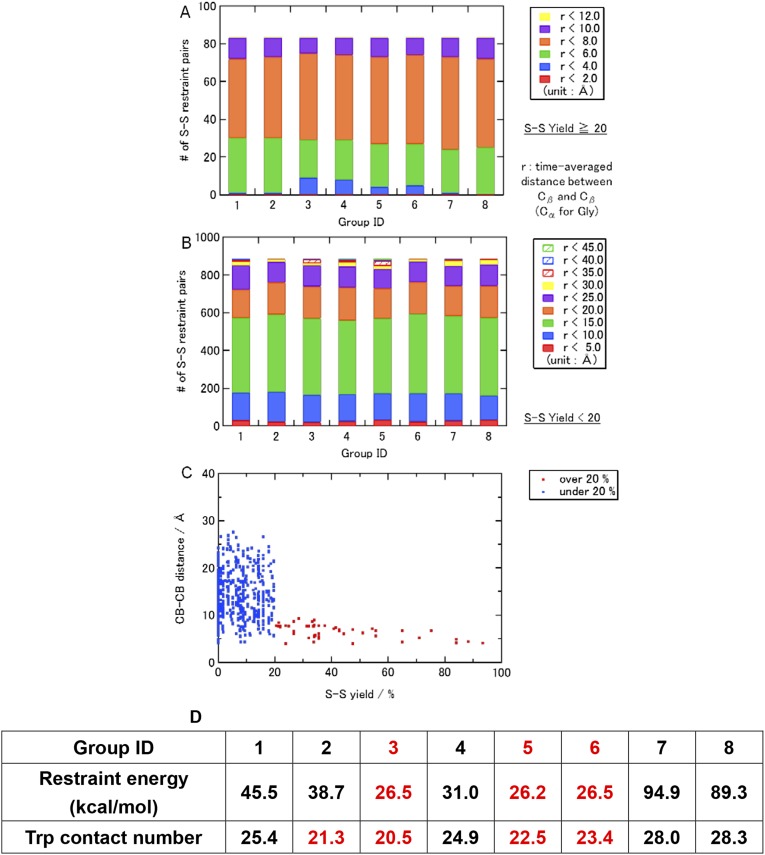
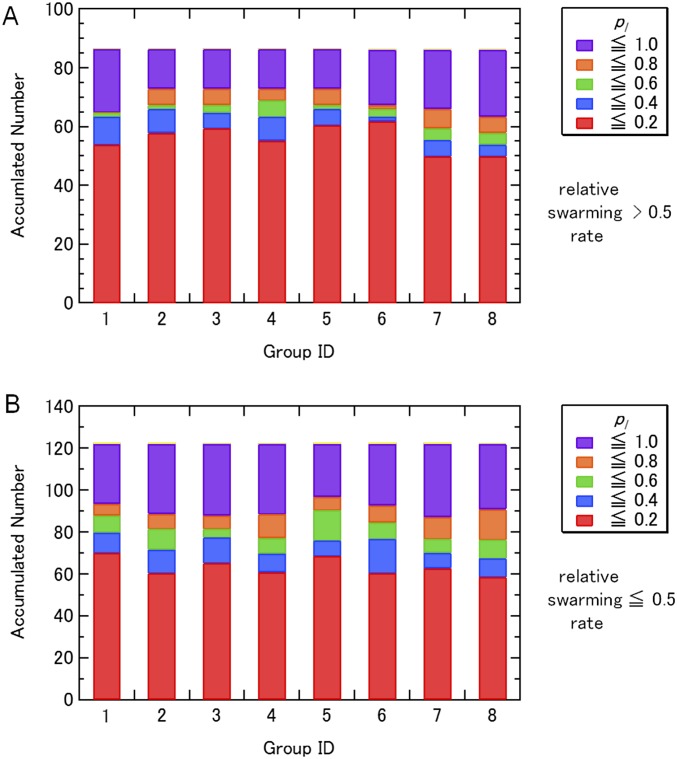
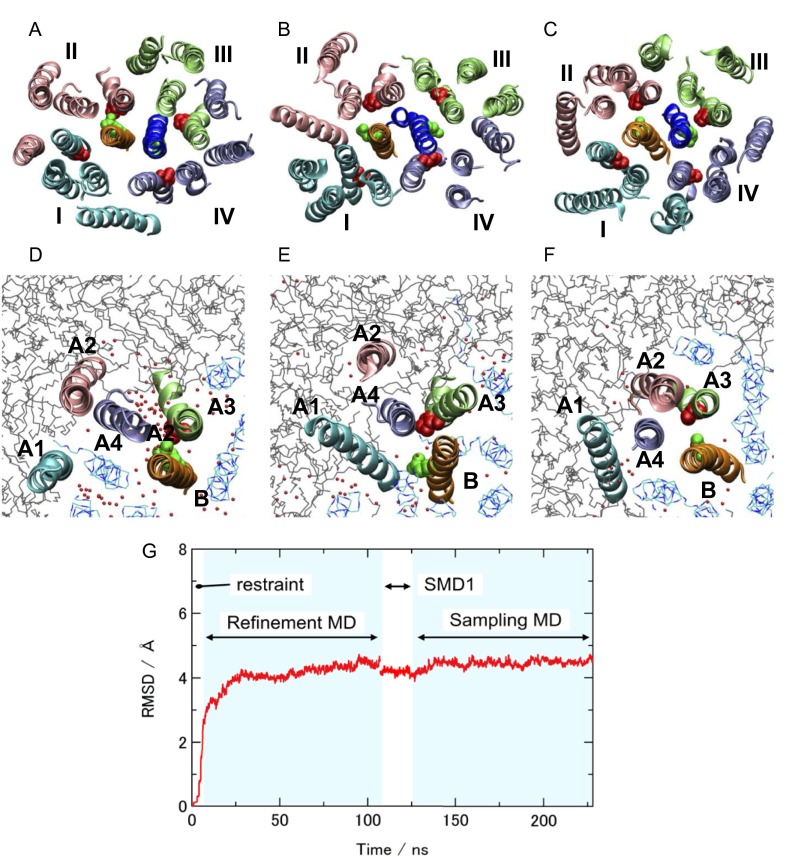
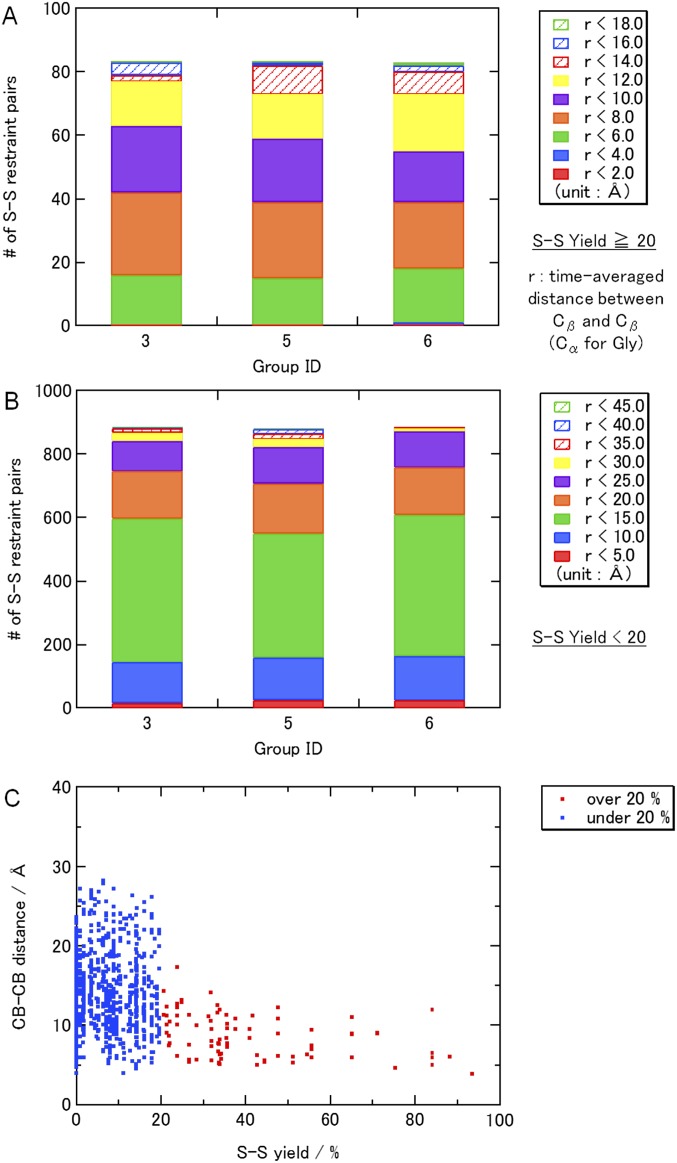
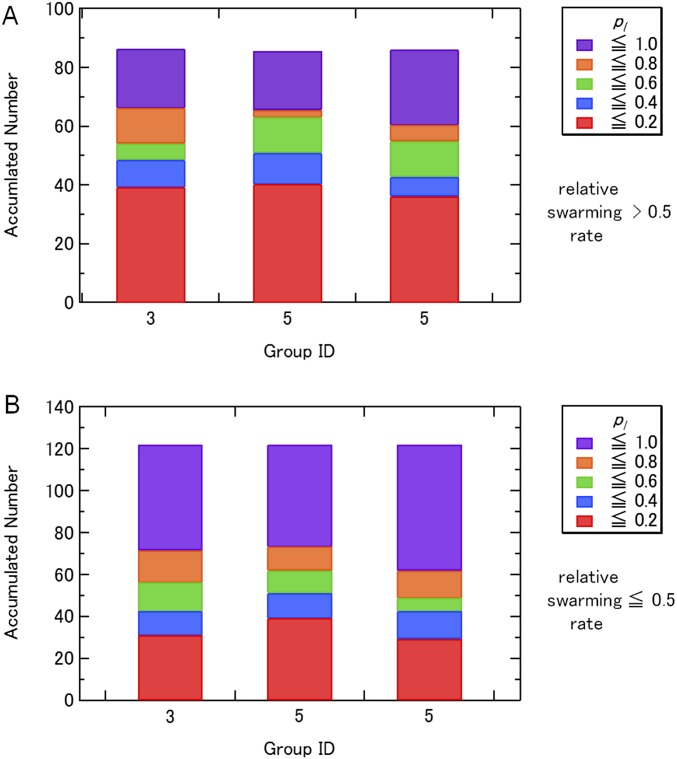
The outline of the simulations steps is summarized in Fig. S1. In the first stage of the modeling (initial modeling), simulated annealing and isothermal molecular dynamics (MD) simulations were conducted in vacuo with the S-S, H-bond, and E-E restraint energies, the bond, angle, and torsion energies, and the repulsive part of the Lennard−Jones energy. The use of the geometric conditions without full nonbonded energy terms in this stage simplifies protein energy surface and enables more-efficient sampling. The principal component analysis of the generated structures indicated that the probability distributions along all of the principal components were almost Gaussian (Fig. S4), which can be understood as a realization of the Gaussian law of error (the central limit theorem), and suggested an overall consistency among the restraints. The root-mean-square fluctuations from the average structures were well converged (0.85 ± 0.15 Å) with no attractive nonbonded energies, which suggests that the mutation data are sufficient for the structure modeling. The arrangements of the inner TM segments (A3, A4, and B segments) were almost the same among groups 1–8, whereas those of the outer TM segments (A1 and A2) were significantly different. The calculated models with the lowest violation energies fulfilled all of the S-S restraints within ca. 10 Å. The S-S restraint energies indicated that groups 3, 5, and 6 were significantly better than the others (Fig. S5). The structures from these three groups were selected for the next step of the modeling. The generated structures were also consistent with the interresidue distances that were not used for the S-S restraints (Fig. S5B). The Trp contact number analysis (SI Text) also showed the advantage of the group 3, 5, and 6 structures (Fig. S6). The best model structure in each of these groups was selected as the lowest S-S restraint energy conformation from 100 energy-minimized structures. The best structures from groups 3 and 5 also had the best Trp contact number, and that from group 6 had the third-best Trp contact number, which indicates high consistency between the S-S restraint and Trp contact. The three selected structures were further refined using all-atom MD simulations in the membrane and solution for 6 ns with the restraints, and after 100 ns without restraints (i.e., refinement MD; Fig. S7). The snapshots in the last 75-ns trajectories of the refinement MD fulfilled both the S-S restraints and Trp conditions well, although no restraints were applied (Figs. S8 and S9). The overall shapes of the group 3 and 5 structures were deformed from the initial modeling during the refinement MD because the interactions among A2, A3, and A4 were not well maintained and some water molecules (group 3, Fig. S7 A and D) and lipids (group 5, Fig. S7 B and E) entered into the gaps between these segments. Groups 3 and 5 had another problem in that no channels were clearly identified. The refinement did not cause a large conformational change in the group 6 structure but rather induced better packing of A1 and A2 around A3 and A4 (Fig. S7 C and F). The group 6 structure maintained a compact shape and possessed two channels surrounded by B, A3, and A4, which was selected as the best structure (Fig. 1 D–G). The selected structure can be considered to have twofold symmetry because the root-mean-square deviation of the structure rotated 180° from the original was 1.5 Å for a core part, B, A3, and A4 segments (2.2 Å for the whole segments), which is in the range of thermal fluctuation. The TM arrangement (Fig. 1 D and E) was consistent with the already suggested model (16–18).
Fig. S4.
Principal component analysis of the 25-ns MD simulation in vacuo (initial modeling). Projections of conformational ensembles were calculated from the trajectory with group 3 (A–C), group 5 (D–F), and group 6 (G–I). The x and y values represent the deviation from the average structure along the principal axes. Contour lines in purple, blue, cyan, green, yellow, orange, and red indicate values of probability density, 0.2, 0.3, 0.4, 0.5, 0.6, 0.7, and 0.8, respectively.
Fig. S5.
Breakdown of the interresidue distances for (A) the pairs used in the S-S restraints (yields ≥ 20%), (B) the pairs not considered (yields < 20%), and (C) the average distance between Cβs (Cα for Gly) as a function of the S-S yields during the restraint MD in vacuo (initial modeling). (D) Average restraint energies and Trp contact numbers for each group during the MD in vacuo (initial modeling). The 100 snapshots from the 25-ns MD in vacuo were selected and energy-minimized with steepest descent (3,000 steps) and conjugate gradient (3,000 steps) methods. Then, the averaged distances and the restraint energies were calculated.
Fig. S6.
Breakdown of the contact probabilities pl for the Trp mutants whose relative swarming rates are (A) >0.5 and (B) ≤0.5 during the restraint MD in vacuo (initial modeling).
Fig. S7.
Overall structures during the all-atom MD in membrane and solution (refinement MD). A–C are viewed from the periplasmic side. Two MotB proteins are shown by orange and blue, and four MotA subunits are represented by cyan (I), pink (II), lime (III), and purple (IV) (see also Fig. S2 for MotA subunit labels, I−IV). Asp32 on B (green) and Pro173 on A3 (red) were represented by vdW spheres. D–F show A1 (cyan), A2 (pink), A3 (lime), and A4 (purple) on the MotA subunit II, and B (orange). Gray lines indicate lipid molecules. Blue lines show the MotA TM segments that do not form the channel. (A and D) Group 3, (B and E) group 5, and (C and F) group 6. Small red dots and gray wire model represent oxygen atoms of water molecules in the membrane region and the lipids, respectively. (G) The root-mean-square deviation (RMSD) from the best snapshot in the initial modeling during the 6-ns decreasing restraint MD, the 100-ns refinement MD without the restraints, 20-ns SMD1, and 100-ns sampling MD.
Fig. S8.
Breakdown of the interresidue distances for (A) the pairs used in the S-S restraints (yields ≥ 20%), (B) the pairs not considered (yields < 20%), and (C) the average distance between Cβs (Cα for Gly) as a function of the S-S yields during the all-atom MD in membrane and solution without restraints (last 75-ns trajectory of the refinement MD) in the group 6 ensemble.
Fig. S9.
Breakdown of the contact probabilities pl for the Trp mutants whose relative swarming rates are (A) >0.5 and (B) ≤0.5 during the all-atom MD in membrane and solution without restraints (last 75-ns trajectory of the refinement MD).
Structure of MotA/B TM Regions.
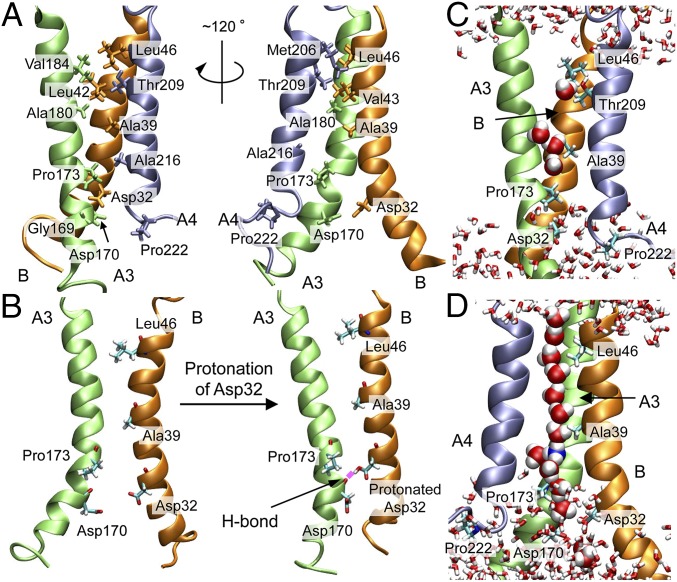
The proton binding site, Asp32 in B, faces the channel, as does nearby Pro173 in A3 (Figs. 2A and 1G), both of which are essential for motor function (24). The narrowest part of the channel is situated close to the periplasm around Val184 (A3 segment), Thr209 (A4), Leu42, and Leu46 (B) (Figs. 2A and 1F). No water molecule completely penetrated through the channels during the 100-ns refinement MD simulation without the restraints. To examine if the distance restraints overdetermined the channel structure, a set of water permeation SMDs through the channels (SMD1) was conducted starting from the best snapshot obtained during the refinement MD. The forward (periplasm to cytoplasm) SMD was repeated 20 times, alternating between the two channels. Starting from the last snapshot, additional 100-ns MD simulations (sampling MD) were performed for the models with the protonated Asp32 as well as for the default charged model (last 75-ns trajectory of the analysis was used). The model structure was stable during SMD1 and sampling MD (Fig. S7G). The protonation state of Asp32 was kept fixed during the simulations. It was confirmed that the permeations in SMD1 did not shift the channel structure significantly and no water molecules completely penetrated through the channels during the sampling MD. This result implies that the TM segments are usually in the closed state.
Fig. 2.
Key residues, conformational change, and water molecules in the MotA/B channel. (A) Key residues. (B) Conformational change of A3 and B induced by the Asp32 protonation and its H-bond formation with Asp170 in A3. Representative snapshots of (C) water distribution in the channel during the sampling MD and (D) water wire formed during H3O+ permeation in SMD2.
Protonation of Asp32 Induces Channel Expansion and A3 Straightening.
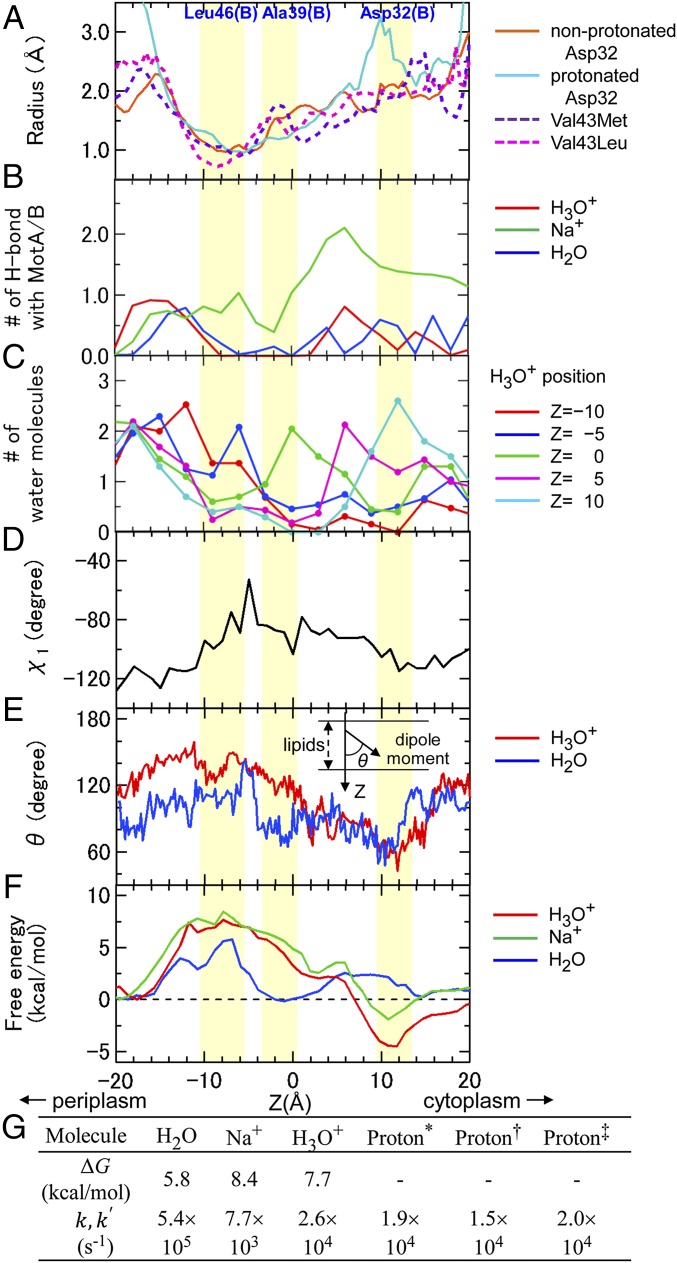
At equilibrium, MotA/B with nonprotonated Asp32 (B) forms channels with a radius of 1.0–2.3 Å (Fig. 3A). The channel radius increases gradually from the narrowest part around Leu46 (radius: 1.0 ± 0.3 Å) to the cytoplasm. The protonation of Asp32 caused an increase of the channel radius near the periplasm and cytoplasm but did not affect the radius of the narrowest part (1.0 ± 0.2 Å). The former increase can accelerate proton entry and release, whereas the latter may maintain ion selectivity upon protonation. The 100-ns MD trajectory analysis shows that the protonated Asp32 formed an H bond with the main-chain O of Asp170 (A3) just below Pro173 (A3) at around 50 ns, which induced a straighter shape of the A3 segment (Fig. 2B). In contrast, the A3 segment maintained a kink starting from Pro173 when Asp32 was not protonated. This indicates that Pro173 is crucial for the flexibility of the cytoplasmic side of A3, which is also consistent with the influence of Pro173 mutations on the torque of the motor and motor rotation (24). A similar relationship between the kink in A3 and protonated Asp32 was also suggested by Blair and coworkers (24, 37).
Fig. 3.
Ion/water permeation properties as a function of the z axis. (A) Average channel radii during the sampling MD of the nonprotonated and protonated Asp32, Val43Met, and Val43Leu. (B) Number of H bonds (or Na+−O interactions) between MotA/B and H3O+, Na+, and H2O during permeation. (C) Water distribution in the channel during H3O+ permeation at Z = 0, ±5, and ±10. (D) Side-chain χ1 angle of Leu46 (MotB) during H3O+ permeation. (E) Angles between the membrane normal and the dipole moment of H3O+ and H2O. The values in B–E are averaged over 10 SMD2 trajectories. (F) Free energy profiles for H3O+, Na+, and H2O permeation. (G) Free energy barrier heights ΔG and rate constants for water/ion permeation, k and k′. Here was deduced from experimental values with ω = 300 s−1, n = 1,240 (*), and N = 10 for Streptococcus (40), n/2N = 50 for E. coli (41) (†), and n/2N = 65 for E. coli (42) (‡).
Mutations Affect Channel Radius and Ion Selectivity.
Terahara et al. (7) reported that MotPS of B. alcalophilus is the stator driven by Rb+, K+, and Na+, whereas the Met33Leu mutant (equivalent of residue 43 in E. coli) on MotS selectively uses Na+. H+-driven motors commonly have Val at the equivalent positions of MotB, and Na+-driven motors have Leu instead, such as in V. alginolyticus. The 100-ns sampling MD was also conducted for the Val43Met and Val43Leu mutants. The wild-type Val43 (B) formed the interface with the A4 segment, whereas Met43 and Leu43 in the Val43Met and Val43Leu mutants were more exposed to the channel, and the channel radius at the narrowest point was reduced in the order Val (1.0 ± 0.3 Å) ≈ Met (0.9 ± 0.2 Å) > Leu (0.7 ± 0.4 Å) (Fig. 3A). The differences in channel size are consistent with the ion selectivity of the wild type and mutants because the order of the Lennard−Jones radii for the ions is Rb+ ≈ H3O+ > K+ > Na+, which suggests the ion permeation is sensitive to the channel size.
The mutations on Phe33 and Phe40 (B) and Ala180 (A3) reduce the mobility of E. coli by ca. 50% (16, 17). In the obtained model structure, Phe33 (B) was close to a regulator residue (Pro173) in the A3 segment of the subunit that does not form the channel (hereafter nonchannel subunit). Phe40 (B) and Ala180 (A3) of the nonchannel subunit are close; therefore a mutation on one of these may change the mutual interaction. The channel-forming residues near the periplasmic side have not been well examined in mutational studies. Leu46(B), Val184(A3), Leu188(A3), Thr209(A4), and Ile213(A4) are suggested as possible candidates for mutational experiments to examine the effects on the channel activity near the periplasmic side as well as the validity of the model structure.
Gating/Reorientation of H3O+ and Formation of Water Wire During Permeation.
The equilibrium water distribution in the channel of the nonprotonated MotA/B during the sampling MD (Fig. 2C) shows that four water molecules can enter the channel from the cytoplasmic side. One water molecule was trapped near the periplasimic side and formed a hydrogen bond with Thr209 (A4). Three other water molecules migrated through the large space of the cytoplasmic side and were exchanged with the bulk water. Water molecules interacted with Asp170 (A3) and Asp32 (B) near the cytoplasmic end of the channel.
To observe the transient MotA/B response, H3O+/Na+/H2O permeations through the channel were simulated by another set of SMD simulations (SMD2, Movies S1–S3). During SMD2, the permeated H2O was mainly H-bonded with MotA/B in three regions; the region just beyond the gate [Oγ of Thr209 (A4) and the main-chain O of Leu42 (B)], the middle part [main-chain O of Ala39 (B)] and the region around the binding site [Oδ of Asp170 (A4) and Asp32 (B), and the main-chain O of Gly169 (A4)] (Fig. 3B). The permeated H3O+ formed fewer H bonds with MotA/B in the middle of the channel (Fig. 3B) and was mainly H-bonded with water molecules (Fig. 3C). In addition, H3O+ formed H bonds with main-chain O at Ala39 and Leu42. To create an H bond with Ala39, the permeated H3O+ pushed out water molecules already H-bonded with Ala39.
The side-chain dihedral angle, χ1, of Leu46 (B) is clearly correlated with ion/water permeation (Fig. 3D and Movies S1–S3), which implies that Leu46 is responsible for the channel gating. Possible H-bonding sites in the MotA/B channel are significantly separated by the gate; therefore, protons are expected to be transported with H3O+ diffusion around the gate rather than by the HBC mechanism. The entry of H3O+ and Na+ was followed by a few bulk water molecules. At Z ≈ −5, the water molecules that entered from both the periplasmic and cytoplasmic sides became wired with H3O+ and Na+ (Figs. 2D and 3C). When H3O+ and Na+ migrated into the range Z > 5, the water wire from the periplasmic to the cytoplasmic sides was broken and water molecules near the periplasmic side escaped to the bulk solution. In contrast, the permeated H2O did not induce wire formation.
The permeated H2O largely changed its orientation at Z ≈ −5 to −4 upon exchange of the H-bonding partner from Leu42 (B) and Thr209 (A4) to Ala39 (B), as shown by the angles between the dipole moment of the permeated molecules and the membrane normal (Fig. 3E). The angle for H3O+ was also reversed by the interaction with Ala39 but more gradually from Z = −6 to +2. Concomitantly, generation of the water wire occurred. Thus, the reorientation induced by Ala39 is important for water wire formation. The Ala39Val mutant disrupts the swarming motility; however, this was recovered by the double mutant in combination with the Met206Ser (A4) mutation (38). The former single mutation may affect the reorientation of H3O+ and H2O, as well as their diffusion with the larger side-chain of Val. The effect of Met206Ser is not clear because it is situated near the periplasmic side and separated from Ala39 by ca. 12 Å.
Free Energy Profile for Ion Permeation and Ion Selectivity.
Free energy minima during H3O+ and Na+ permeation are situated at the proton binding site Asp32 (B) around Z = 10–12 Å, and the highest energy barriers are found at the gate Leu46 (Z ≈ −12 Å to −6 Å) (Fig. 3 F and G). The barrier height for H2O permeation was lower than that for the others, probably because only H2O can form an H bond with Thr209 (A4). The free energy profile for H2O shows a minimum around Z ≈ −1, where the water molecule formed a stable H bond with the carbonyl O of Ala39 (B). The negative free energy value upon binding of both H3O+ and Na+ to Asp32 (Z ≈ 10 Å) relative to the zero value at around the periplasm (Z ≈ −20 Å) indicates that these ions can spontaneously move from the periplasmic to cytoplasmic sides. This is consistent with the chimera study that suggests that both protons and sodium ions can permeate the TM region of MotA/B; the MotA/MomB7 motor functions in V. alginolyticus under a Na+ gradient, where MomB7 is a chimera of the TM N-terminal region of MotB from E. coli and the periplasmic C-terminal domain of PomB from V. alginolyticus (39). H3O+ permeation to Asp32 lowered the free energy down to −4.5 kcal/mol, whereas that for Na+ reached only −1.9 kcal/mol, which indicates that the MotA/B TM region is more optimized for proton transfer. Hosking et al. suggested that the plug involved with the channel opening/closing is an amphipathic α-helix that makes contact with the hydrophobic core of the membrane to close the channels (27); however, the expected length of the helical plug is estimated to be too short (<15 Å) to reach the membrane.
The ion permeation rate constants through the gate, k, were calculated using the equation from the free energy barrier height ΔG, the Boltzmann constant kB, temperature T, and Planck’s constant h, and assuming that one of the two channels works (Fig. 3G). This rate is comparable to the rate of proton transfer k′, estimated by where ω is the rotational speed of the flagella, n is the number of transferred protons per revolution, and N is the number of stators per flagellum (40–42) (Fig. 3G). The rate constant k for H3O+ permeation of 2.6× 10⁴ s−1 was consistent with k′, which indicates that the gating is the rate-limiting step. If both of the channels work, then all of the rates are doubled. The consistency between the rates deduced from the calculated energy barrier and those from the experimental values still holds, and is independent of the number of channels used for the proton transfer. H2O can enter the gate more frequently; however, it cannot induce formation of the water wire to enable proton transfer.
Validity of the Model and Possible Proton Permeation Mechanism.
The validity of the obtained model structure is supported by (i) good convergence of the structure ensembles in the initial modeling, (ii) no discrepancies among the restraints, (iii) consistency with the Trp mutations and unused Cys mutations, (iv) stability of the structure during SMD1 and sampling MD, (v) consistency between the calculated free energy barrier for H3O+ permeation and the proton transfer rate deduced from experimental values, (vi) rational explanations for the relation between mutation-dependent channel size and ion selectivity, and (vii) the severe mutational effects on Ala39 (B) and Pro173 (A3). Considering these features, the validity of the structure was determined to be high. The structure of the core part (B, A3, and A4) that is important for ion permeation was especially well determined.
A possible proton transfer mechanism suggested from the simulations is as follows. A proton can be transported into the channel entrance from the periplasmic side with the water wire or by the diffusion of H3O+, as implied by the water accessibility of the channel entrance (Fig. 3A; Z = −20 to −14). A proton should pass through the gate of Leu46 (B) by H3O+ diffusion as shown in SMD2 because the vicinity of the gate is hydrophobic. The size-dependent ion selectivity (7) is consistent with the mutation-induced change in channel size and the gating of H3O+. The SMD2 result showed that H3O+ changes its orientation upon H-bonding with Ala39 (B) and generates a water wire. Further proton transfer to Asp32 can occur by either proton hopping through the wire or H3O+ diffusion; however, the former is more probable because it is much faster (12). The water wire disappears when H3O+ reaches Z = 5 Å, which implies that entry of the first proton may not directly cause entry of the next proton.
Protonation/Deprotonation Induces Ratchet Motion of Cytoplasmic Domain.
The cytoplasmic domain of MotA (residues 61–160) situated between A2 and A3, which includes the rotor protein FliG binding sites Arg90 and Glu98 (22, 23), was not contained in the atomic structure; however, its possible motion was predicted by a simple model, where the cytoplasmic domain is assumed to move as a rigid body. The FliG binding site was assumed to be situated at 25 Å from the middle of the cytoplasmic ends of A2 and A3 (Fig. 4A), and its positional shift was estimated by comparison of the MotA/B structures in the last 50-ns MD trajectories with the nonprotonated and protonated Asp32. Protonation caused a 5-Å shift of the FliG binding site on average (11 Å at maximum; Fig. 4B), which indicates that the protonation/deprotonation cycle can induce a ratchet motion of the cytoplasmic domain. Although the position of the FliG binding site was assumed arbitrarily, the expected ratchet motion should be significantly large and independent of the binding site position when it is situated relatively distant from the cytoplasmic ends of A2 and A3. Finally, the mechanism for the protonation/deprotonation-induced ratchet motion of the cytoplasmic domain motion is summarized (Fig. 4C). When H3O+ passes through the Leu46 gate, a proton is transferred from H3O+ via a water wire to Asp32 or by H3O+ diffusion. The protonated Asp32 forms an H bond with Asp170 (A3), which moves A2, A3, and the cytoplasmic domain. After deprotonation of Asp32, the cytoplasmic domain moves back to the original position, which causes the ratchet motion of the cytoplasmic domain during the protonation/deprotonation cycle. This ratchet motion may be correlated to the motion of the flagellar rotor.
Fig. 4.
Ratchet motion of the cytoplasmic domain. (A) The MotA/B conformations with the nonprotonated and protonated Asp32. A conceptual cytoplasmic domain is represented by the cylinders. The yellow dots at the tips of the cylinders represent arbitrary FliG binding sites. (B) Positional differences of the FliG binding site in the cytoplasmic domain with the nonprotonated (snapshots, cyan; average, pink) and protonated Asp32 (snapshots, blue; average, red) in equilibrium. (C) Ratchet motion of the cytoplasmic domain motion induced by the protonation/deprotonation cycle.
Comparison with Other Proton Transfer Proteins.
The bacterial reaction center and bacteriorhodopsin are believed to use the HBC mechanism for proton transfer. In the bacterial reaction center of Rhodobacter sphaeroides, protons are transferred from the H through L and M subunits to quinone via bridging water molecules, and several charged and polar residues (43), whereas MotA/B have only a few charged residues in the TM regions. Gramicidin A is a dimer of small hydrophobic polypeptides that form a channel with a radius of 2 Å (44), and protons can be transferred through the water wire in the channel without a gating (12, 13). The M2 protein tetramer of the influenza A virus forms a channel with a radius of 0.7–3.3 Å (45), of which the residues are hydrophobic, except for Ser31 and His37 (46). The presence of the gate is similar to that for MotA/B, although this channel is regulated by protonation of the gate residue, His37. In MotA/B, the gate Leu46 (B) is hydrophobic, and gate opening is correlated with the side-chain rotations.
Materials and Methods
Modeling and Molecular Dynamics.
The initial modeling was performed with the GROMACS (47) using the CHARMM36 force field (48). The refinement and sampling MD simulations were performed with the NAMD (49) using the CHARMM36 force field (48) and TIP3P water model (50) (SI Text).
SMD and Free Energy Calculation.
A pulled molecule, such as H2O, H3O+, or Na+ (referred to as the SMD molecule), was set to pass through one of the two channels according to the constant velocity pulling scheme (32–34). For H3O+, a four-point charge model based on TIP3P was used (13). SMD1 was conducted for H2O permeation. SMD2 was performed 10 times for H3O+, H2O, and Na+ as SMD molecules for one of the channels. The umbrella sampling technique was used to calculate the free energy profile (SI Text).
SI Text
Energy Function for the S-S, H-Bond, and E-E Restraint Energies
The energy terms for the S-S, H-bond, and E-E distance restraints between the ith and jth atoms have a common functional form,
where rij is the interatomic distance between the ith and jth atoms, k is the force constant 64 kcal⋅mol−1⋅Å−2, and ΔR = 0.5 Å. The R values for the H-bond and E-E restraints are 3.0 Å and 20 Å, respectively, and those for the S-S restraints depend on the residue pairs as shown in S-S Restraints. The parabolic function started from R turns into a continuous linear function beyond the upper bound (R+ΔR). The value of ΔR is typically 1 to ∼2 Å in the NMR structure determination, but we used ΔR = 0.5 Å to allow larger deviation from R compared with typical NMR studies.
S-S Restraints
The disulfide cross-linking experimental data (16–18) were classified into five groups, 100–80, 80–60, 60–40, 40–20, and 20–0%, based on the values of the yields of dimer or tetramer. The S-S restraints were applied to the Cβ−Cβ atoms pairs (Cα for Gly) of the first four groups (Dataset S1) with R = 6.0 Å, 6.5 Å, 7.0 Å, and 7.5 Å, respectively (+1.0 Å per Gly). The residue pairs with the yields < 20% were only used for the validity check (Dataset S1).
H-Bond Restraints
The helical segments of MotA/B were predicted as the consensus among the results from multiple TM helix prediction methods, SOSUI, MEMSAT 1.5, TMHMM 2.0, TMpred, and TopPred, and from the multiple alignment, ClustalX (36) (Fig. S3). We adopted the result of ClustalX because the aligned segments included all TM segments predicted by the other methods, except for the A2 on MotA predicted by SOSUI. Four segments from MotA, A1 (residues 1–26), A2 (31–56), A3 (165–188), and A4 (204–223), and one segment from MotB, B (24–49), were assigned as the helical segments. The H-bond restraints were applied to these segments (Dataset S1). Five additional residues and two short loops connecting the A1 and A2 and the A3 and A4 segments were considered in the modeling (Fig. 1B).
Trp Contact
In the Trp mutagenesis experiments (19, 20), E. coli swarming rates were measured, and these data were used to judge whether the residue is expected to be exposed or not. Dataset S1 shows residues with the relative swarming rate of ≥0.5 and <0.5, respectively.
Consistency between the generated model and the Trp scanning mutations was examined. For each Trp mutant, nine Trp rotamers were generated by changing two dihedral angles, χ1 (N−CA−CB−CG) and χ2 (CA−CB−CG−CD1). To judge whether the Trp rotamers make contact with the surrounding residues, we calculated the van der Waals (vdW) energies of the Trp rotamers with the surrounding residues as follows:
where i and j indicate atom indices of the lth Trp and the mth surrounding residues in the kth snapshot, respectively. VijkvdW is the vdW energy between the ith and jth atoms in the kth snapshot. Vlmk is the minimum vdW energy between the lth Trp rotamer and the mth surrounding residues in the kth snapshot. The cutoff length was 5.0 Å. Hydrogen atoms and main-chain atoms were not considered. Here, we introduce the contact probability, pl,
where l, m, and k indicate the index of the Trp mutation index, the residue index on the stator, and the trajectory snapshot index, respectively, and T is the number of snapshots. Total Trp contact number is defined as
Structure Generation in Vacuo (Initial Modeling)
As the first stage of the modeling, simulated annealing and isothermal MD were conducted in vacuum with the S-S, H-bond, and E-E restraint energies, bond, angle, and torsion energies, and the repulsive part of Lennard−Jones energy. After energy minimization, MD simulation was first performed for 0.5 ns by gradually heating the system up to 1,000 K and keeping it at 1,000 K for 5 ns. Then, 0.5-ns cooling and 0.5-ns equilibration were repeated four times (800 K, 600 K, 400 K, and 310 K) until the system temperature was reached at 310 K. After further equilibration at 310 K for 5 ns, 25-ns MD simulations were performed to generate the candidate structures. Snapshots were stored every 1 ps. Temperature in the MD simulations was controlled by Nosé−Hoover thermostat. Nonbonded interactions were calculated using a cutoff of 14 Å. A time step was set to be 1.0 fs. The LINCS algorithm was applied to the bonds including hydrogen atoms. To use geometric and restraint conditions more effectively, the forces contributed from electrostatic and vdW attractive interactions were not considered. In the next step, the generated structures were evaluated. The evaluation was conducted based on the S-S restraint energy, the Trp-mutagenesis data (19, 20), and the disulfide cross-linking data (16–18) not used from S-S restraint conditions.
Structure Refinement in Membrane and Solution (Refinement MD)
The selected models were embedded into the lipid bilayer that consists of 306 1-palmitoyl-2-oleoyl-sn-phosphatidylethanolamine (POPE) and 102 1-palmitoyl-2-oleoyl-sn-phosphatidylglycerol (POPG) in 3:1 ratio (POPE:POPG) with the program g_membed. The z axis of the system was set to be perpendicular to the membrane surface. The system was solvated with 30,783 TIP3P water molecules, and chloride and sodium ions were added to create 0.15 M physiological concentration and to neutralize the system. The MotA/B complex structure was first kept rigid for the initial 1 ns. Then, the position restraints were applied and gradually weakened by decreasing the force constants for 6 ns. Finally, 100-ns MD simulations were performed without any restraint. Conformations were saved every 10 ps, and the last 75-ns trajectories were used for the analysis. The temperature of the simulated system was controlled to be 310 K by Langevin dynamics. The pressure of the system was maintained at 1 bar in the direction perpendicular to the membrane (NPAT ensemble simulations) by the Nosé−Hoover Langevin piston. The particle mesh Ewald algorithm was used for long-range electrostatic interactions, and other short-range nonbonded interactions were calculated using a cutoff of 14 Å. A time step was set to be 2.0 fs. The SHAKE algorithm was applied to the bonds including hydrogen atoms.
SMD1 and SMD2
In the SMD simulations, a pulled molecule, such as H2O, H3O+, or Na+ (referred to as the SMD molecule), was set to pass through one of the two channels according to the constant velocity pulling scheme (32−34). A dummy atom connected with the center of mass of the SMD molecule having a harmonic spring with a force constant of 10 kBT = 6.1574 kcal⋅mol−1⋅Å−2 was pulled along the direction of the z axis with a velocity of 0.05 Å/ps. The SMD molecule passed through the channel within 1 ns and was pulled up to 50 Å from the staring position along the z axis. SMD1 was conducted for H2O permeation starting from the best snapshot from the refinement MD trajectory in group 6. The forward SMD of H2O was repeated 20 times. SMD2 was performed for H3O+, H2O, and Na+ as SMD molecules. The top 10 snapshots that best satisfied the S-S restraints were then selected from the refinement MD. Starting from each snapshot, forward (from the periplasmic to cytoplasmic side) permeation paths were generated (a total of 10 forward paths).
Calculation of Free Energy Profile of Ion Permeation (Umbrella Sampling)
The umbrella sampling technique was used to calculate the free energy profile for H3O+, H2O, and Na+ permeation through the channel. The umbrella potential, U(z) = (k/2)(z − z0)2, was applied to the system where the force constant k = 2.0–5.0 kcal⋅mol−1⋅Å−2 and z0 is the expected peak position of the local probability density. Forty-one windows were used, and the initial coordinates were adopted for each window from the additional cycle of SMD1. The 1-ns MD simulations with U(z) in each window were performed. The histograms calculated from the simulations with U(z) at different locations were combined using the weighted histogram analysis method.
Supplementary Material
Acknowledgments
The authors thank Dr. Seiji Kojima and Prof. Michio Homma at Nagoya University for helpful discussions. The computations were partly performed using the supercomputers at the Research Center of Computational Science at the National Institute of Natural Science and the Institute for Solid State Physics at The University of Tokyo. The molecular images in the article were created with VMD (51). This work was supported by Computational Materials Science Initiative, Grants-in-Aid for Science Research in Innovative Areas (25104002), and Grants-in-Aid for Science Research B (23370066) from Japan Society for the Promotion of Science/the Ministry of Education, Culture, Sports, Science and Technology, Japan (to A.K.).
Footnotes
The authors declare no conflict of interest.
This article is a PNAS Direct Submission.
This article contains supporting information online at www.pnas.org/lookup/suppl/doi:10.1073/pnas.1502991112/-/DCSupplemental.
References
- 1.Larsen SH, Adler J, Gargus JJ, Hogg RW. Chemomechanical coupling without ATP: The source of energy for motility and chemotaxis in bacteria. Proc Natl Acad Sci USA. 1974;71(4):1239–1243. doi: 10.1073/pnas.71.4.1239. [DOI] [PMC free article] [PubMed] [Google Scholar]
- 2.Khan S, Dapice M, Reese TS. Effects of mot gene expression on the structure of the flagellar motor. J Mol Biol. 1988;202(3):575–584. doi: 10.1016/0022-2836(88)90287-2. [DOI] [PubMed] [Google Scholar]
- 3.Dean GE, Macnab RM, Stader J, Matsumura P, Burks C. Gene sequence and predicted amino acid sequence of the motA protein, a membrane-associated protein required for flagellar rotation in Escherichia coli. J Bacteriol. 1984;159(3):991–999. doi: 10.1128/jb.159.3.991-999.1984. [DOI] [PMC free article] [PubMed] [Google Scholar]
- 4.Stader J, Matsumura P, Vacante D, Dean GE, Macnab RM. Nucleotide sequence of the Escherichia coli motB gene and site-limited incorporation of its product into the cytoplasmic membrane. J Bacteriol. 1986;166(1):244–252. doi: 10.1128/jb.166.1.244-252.1986. [DOI] [PMC free article] [PubMed] [Google Scholar]
- 5.Chun SY, Parkinson JS. Bacterial motility: Membrane topology of the Escherichia coli MotB protein. Science. 1988;239(4837):276–278. doi: 10.1126/science.2447650. [DOI] [PubMed] [Google Scholar]
- 6.Hirota N, Kitada M, Imae Y. Flagellar motors of alkalohilic bacillus are powered by an electrochemical potential gradient of Na+ FEBS Lett. 1981;132(2):278–280. [Google Scholar]
- 7.Terahara N, Sano M, Ito M. A Bacillus flagellar motor that can use both Na+ and K+ as a coupling ion is converted by a single mutation to use only Na+ PLoS ONE. 2012;7(9):e46248. doi: 10.1371/journal.pone.0046248. [DOI] [PMC free article] [PubMed] [Google Scholar]
- 8.Nichols JW, Deamer DW. Net proton-hydroxyl permeability of large unilamellar liposomes measured by an acid-base titration technique. Proc Natl Acad Sci USA. 1980;77(4):2038–2042. doi: 10.1073/pnas.77.4.2038. [DOI] [PMC free article] [PubMed] [Google Scholar]
- 9.Onsager L. 1967. Thermodynamics and some molecular aspects of biology. The Neurosciences. A Study Program, eds Quarton GC, Melnechuk T, Schmidt FO (Rockefeller Univ Press, New York), pp 75–79.
- 10.Vuilleumier R, Borgis D. Transport and spectroscopy of the hydrated proton: A molecular dynamics study. J Chem Phys. 1999;111(9):4251–4266. [Google Scholar]
- 11.Schmitt UW, Voth GA. The computer simulation of proton transport in water. J Chem Phys. 1999;111(20):9361–9381. [Google Scholar]
- 12.Pomès R, Roux B. Structure and dynamics of a proton wire: A theoretical study of H+ translocation along the single-file water chain in the gramicidin A channel. Biophys J. 1996;71(1):19–39. doi: 10.1016/S0006-3495(96)79211-1. [DOI] [PMC free article] [PubMed] [Google Scholar]
- 13.Sagnella DE, Voth GA. Structure and dynamics of hydronium in the ion channel gramicidin A. Biophys J. 1996;70(5):2043–2051. doi: 10.1016/S0006-3495(96)79773-4. [DOI] [PMC free article] [PubMed] [Google Scholar]
- 14.Yamaguchi S, Fujita H, Ishihara A, Aizawa S, Macnab RM. Subdivision of flagellar genes of Salmonella typhimurium into regions responsible for assembly, rotation, and switching. J Bacteriol. 1986;166(1):187–193. doi: 10.1128/jb.166.1.187-193.1986. [DOI] [PMC free article] [PubMed] [Google Scholar]
- 15.Enomoto M. Genetic studies of paralyzed mutants in Salmonella. II. Mapping of three mot loci by linkage analysis. Genetics. 1966;54(5):1069–1076. doi: 10.1093/genetics/54.5.1069. [DOI] [PMC free article] [PubMed] [Google Scholar]
- 16.Braun TF, Blair DF. Targeted disulfide cross-linking of the MotB protein of Escherichia coli: Evidence for two H(+) channels in the stator complex. Biochemistry. 2001;40(43):13051–13059. doi: 10.1021/bi011264g. [DOI] [PubMed] [Google Scholar]
- 17.Braun TF, Al-Mawsawi LQ, Kojima S, Blair DF. Arrangement of core membrane segments in the MotA/MotB proton-channel complex of Escherichia coli. Biochemistry. 2004;43(1):35–45. doi: 10.1021/bi035406d. [DOI] [PubMed] [Google Scholar]
- 18.Kim EA, Price-Carter M, Carlquist WC, Blair DF. Membrane segment organization in the stator complex of the flagellar motor: Implications for proton flow and proton-induced conformational change. Biochemistry. 2008;47(43):11332–11339. doi: 10.1021/bi801347a. [DOI] [PMC free article] [PubMed] [Google Scholar]
- 19.Sharp LL, Zhou J, Blair DF. Features of MotA proton channel structure revealed by tryptophan-scanning mutagenesis. Proc Natl Acad Sci USA. 1995;92(17):7946–7950. doi: 10.1073/pnas.92.17.7946. [DOI] [PMC free article] [PubMed] [Google Scholar]
- 20.Sharp LL, Zhou J, Blair DF. Tryptophan-scanning mutagenesis of MotB, an integral membrane protein essential for flagellar rotation in Escherichia coli. Biochemistry. 1995;34(28):9166–9171. doi: 10.1021/bi00028a028. [DOI] [PubMed] [Google Scholar]
- 21.Zhou J, Fazzio RT, Blair DF. Membrane topology of the MotA protein of Escherichia coli. J Mol Biol. 1995;251(2):237–242. doi: 10.1006/jmbi.1995.0431. [DOI] [PubMed] [Google Scholar]
- 22.Zhou J, Blair DF. Residues of the cytoplasmic domain of MotA essential for torque generation in the bacterial flagellar motor. J Mol Biol. 1997;273(2):428–439. doi: 10.1006/jmbi.1997.1316. [DOI] [PubMed] [Google Scholar]
- 23.Zhou J, Lloyd SA, Blair DF. Electrostatic interactions between rotor and stator in the bacterial flagellar motor. Proc Natl Acad Sci USA. 1998;95(11):6436–6441. doi: 10.1073/pnas.95.11.6436. [DOI] [PMC free article] [PubMed] [Google Scholar]
- 24.Braun TF, et al. Function of proline residues of MotA in torque generation by the flagellar motor of Escherichia coli. J Bacteriol. 1999;181(11):3542–3551. doi: 10.1128/jb.181.11.3542-3551.1999. [DOI] [PMC free article] [PubMed] [Google Scholar]
- 25.Zhou J, et al. Function of protonatable residues in the flagellar motor of Escherichia coli: A critical role for Asp 32 of MotB. J Bacteriol. 1998;180(10):2729–2735. doi: 10.1128/jb.180.10.2729-2735.1998. [DOI] [PMC free article] [PubMed] [Google Scholar]
- 26.De Mot R, Vanderleyden J. The C-terminal sequence conservation between OmpA-related outer membrane proteins and MotB suggests a common function in both gram-positive and gram-negative bacteria, possibly in the interaction of these domains with peptidoglycan. Mol Microbiol. 1994;12(2):333–334. doi: 10.1111/j.1365-2958.1994.tb01021.x. [DOI] [PubMed] [Google Scholar]
- 27.Hosking ER, Vogt C, Bakker EP, Manson MD. The Escherichia coli MotAB proton channel unplugged. J Mol Biol. 2006;364(5):921–937. doi: 10.1016/j.jmb.2006.09.035. [DOI] [PubMed] [Google Scholar]
- 28.Walz D, Caplan SR. An electrostatic mechanism closely reproducing observed behavior in the bacterial flagellar motor. Biophys J. 2000;78(2):626–651. doi: 10.1016/S0006-3495(00)76622-7. [DOI] [PMC free article] [PubMed] [Google Scholar]
- 29.Berry RM. Torque and switching in the bacterial flagellar motor. An electrostatic model. Biophys J. 1993;64(4):961–973. doi: 10.1016/S0006-3495(93)81462-0. [DOI] [PMC free article] [PubMed] [Google Scholar]
- 30.Elston TC, Oster G. Protein turbines. I: The bacterial flagellar motor. Biophys J. 1997;73(2):703–721. doi: 10.1016/S0006-3495(97)78104-9. [DOI] [PMC free article] [PubMed] [Google Scholar]
- 31.Kojima S, Blair DF. Conformational change in the stator of the bacterial flagellar motor. Biochemistry. 2001;40(43):13041–13050. doi: 10.1021/bi011263o. [DOI] [PubMed] [Google Scholar]
- 32.Isralewitz B, Baudry J, Gullingsrud J, Kosztin D, Schulten K. Steered molecular dynamics investigations of protein function. J Mol Graph Model. 2001;19(1):13–25. doi: 10.1016/s1093-3263(00)00133-9. [DOI] [PubMed] [Google Scholar]
- 33.Isralewitz B, Gao M, Schulten K. Steered molecular dynamics and mechanical functions of proteins. Curr Opin Struct Biol. 2001;11(2):224–230. doi: 10.1016/s0959-440x(00)00194-9. [DOI] [PubMed] [Google Scholar]
- 34.Jensen MØ, Park S, Tajkhorshid E, Schulten K. Energetics of glycerol conduction through aquaglyceroporin GlpF. Proc Natl Acad Sci USA. 2002;99(10):6731–6736. doi: 10.1073/pnas.102649299. [DOI] [PMC free article] [PubMed] [Google Scholar]
- 35.Sorgen PL, Hu Y, Guan L, Kaback HR, Girvin ME. An approach to membrane protein structure without crystals. Proc Natl Acad Sci USA. 2002;99(22):14037–14040. doi: 10.1073/pnas.182552199. [DOI] [PMC free article] [PubMed] [Google Scholar]
- 36.Larkin MA, et al. Clustal W and Clustal X version 2.0. Bioinformatics. 2007;23(21):2947–2948. doi: 10.1093/bioinformatics/btm404. [DOI] [PubMed] [Google Scholar]
- 37.Blair DF. Structure and mechanism of the flagellar rotary motor. In: Jarrel KF, editor. Pili and Flagella: Current Research and Future Trends. Caister Academic; Norfolk, UK: 2009. pp. 121–136. [Google Scholar]
- 38.Sudo Y, Terashima H, Abe-Yoshizumi R, Kojima S, Homma M. Comparative study of the ion flux pathway in stator units of proton- and sodium-driven flagellar motors. Biophysics. 2009;5:45–52. doi: 10.2142/biophysics.5.45. [DOI] [PMC free article] [PubMed] [Google Scholar]
- 39.Asai Y, Yakushi T, Kawagishi I, Homma M. Ion-coupling determinants of Na+-driven and H+-driven flagellar motors. J Mol Biol. 2003;327(2):453–463. doi: 10.1016/s0022-2836(03)00096-2. [DOI] [PubMed] [Google Scholar]
- 40.Meister M, Lowe G, Berg HC. The proton flux through the bacterial flagellar motor. Cell. 1987;49(5):643–650. doi: 10.1016/0092-8674(87)90540-x. [DOI] [PubMed] [Google Scholar]
- 41.Samuel AD, Berg HC. Torque-generating units of the bacterial flagellar motor step independently. Biophys J. 1996;71(2):918–923. doi: 10.1016/S0006-3495(96)79295-0. [DOI] [PMC free article] [PubMed] [Google Scholar]
- 42.Block SM, Berg HC. Successive incorporation of force-generating units in the bacterial rotary motor. Nature. 1984;309(5967):470–472. doi: 10.1038/309470a0. [DOI] [PubMed] [Google Scholar]
- 43.Paddock ML, et al. Identification of the proton pathway in bacterial reaction centers: Cooperation between Asp-M17 and Asp-L210 facilitates proton transfer to the secondary quinone (QB) Biochemistry. 2001;40(23):6893–6902. doi: 10.1021/bi010280a. [DOI] [PubMed] [Google Scholar]
- 44.Arseniev AS, Barsukov IL, Bystrov VF, Lomize AL, Ovchinnikov YA. 1H-NMR study of gramicidin A transmembrane ion channel. Head-to-head right-handed, single-stranded helices. FEBS Lett. 1985;186(2):168–174. doi: 10.1016/0014-5793(85)80702-x. [DOI] [PubMed] [Google Scholar]
- 45.Wei C, Pohorille A. Activation and proton transport mechanism in influenza A M2 channel. Biophys J. 2013;105(9):2036–2045. doi: 10.1016/j.bpj.2013.08.030. [DOI] [PMC free article] [PubMed] [Google Scholar]
- 46.Pinto LH, et al. A functionally defined model for the M2 proton channel of influenza A virus suggests a mechanism for its ion selectivity. Proc Natl Acad Sci USA. 1997;94(21):11301–11306. doi: 10.1073/pnas.94.21.11301. [DOI] [PMC free article] [PubMed] [Google Scholar]
- 47.Hess B, Kutzner C, Van Der Spoel D, Lindahl E. GROMACS 4: Algorithms for highly efficient, load-balanced, and scalable molecular simulation. J Chem Theory Comput. 2008;4(3):435–447. doi: 10.1021/ct700301q. [DOI] [PubMed] [Google Scholar]
- 48.Klauda JB, et al. Update of the CHARMM all-atom additive force field for lipids: Validation on six lipid types. J Phys Chem B. 2010;114(23):7830–7843. doi: 10.1021/jp101759q. [DOI] [PMC free article] [PubMed] [Google Scholar]
- 49.Phillips JC, et al. Scalable molecular dynamics with NAMD. J Comput Chem. 2005;26(16):1781–1802. doi: 10.1002/jcc.20289. [DOI] [PMC free article] [PubMed] [Google Scholar]
- 50.Jorgensen WL, Chandrasekhar J, Madura JD, Impey RW, Klein ML. Comparison of simple potential functions for simulating liquid water. J Chem Phys. 1983;79(2):926–935. [Google Scholar]
- 51.Humphrey W, Dalke A, Schulten K. VMD: Visual Molecular Dynamics. J Mol Graph. 1996;14(1):33–38. doi: 10.1016/0263-7855(96)00018-5. [DOI] [PubMed] [Google Scholar]
Associated Data
This section collects any data citations, data availability statements, or supplementary materials included in this article.


