Abstract
How visual qualities of a food impact perceptions of the amount of food present and consumed have been studied. Previous research has investigated many factors affecting these perceptions, including the height of a glass, the size of a serving bowl, and other food intake cues. We investigated how the number of pieces a serving is divided into impacts perceptions of the amount of food present and consumed. Results indicate that dividing a fixed portion into a greater number of pieces leads people to perceive a greater amount of food in the serving.
Keywords: portion, size, eating, behavior, calorie, estimation, intake
The sensory properties of a food affect our perceptions of that food (eg Barnett-Cowan 2010). Visual perceptions play a role in our ability to estimate the amount of food/drink that is presented and consumed (Scheibehenne et al 2010). For example, the vertical dimension of a drinking glass can impact volume perceptions. Raghubir and Krishna (1999) found that increasing the height of a glass led to an overestimation of the amount of liquid compared to a shorter glass. Serving container size can also affect food perceptions, with large serving bowls leading to greater food consumption (Wansink and Cheney 2005). Interestingly, visual reminders of how much we have eaten can also affect our food perceptions. When chicken wing bones were left on the table as a reminder of how many had been consumed, people ate less food than when the bones were removed (Wansink and Payne 2007). We investigated if dividing a fixed portion of a food into more pieces would result in a larger perceived serving size.
Studies 1 and 2 were approved by the Clemson University Institutional Review Board (IRB) and were performed in accordance with the guidelines of the American Psychological Association and the World Medical Association Helsinki Declaration of 2008.
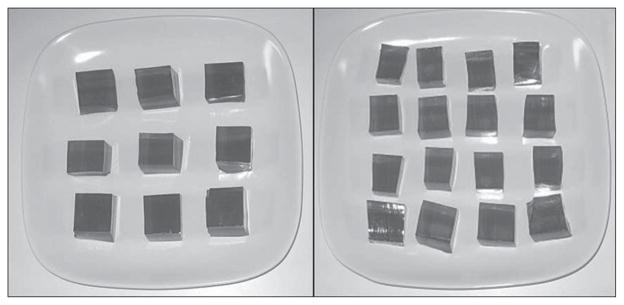
39 participants (18 females, mean age = 19.67 years, SD = 2.89 years) completed the two-condition within-subjects study 1. In condition one, participants were served 160 g of JELL-O® gelatin (Kraft Foods Inc, Glenview, IL, USA) cut into 9 equal pieces (each piece = 2.54 cm long × 2.54 cm wide × 1.91 cm deep). In condition two, participants were served 160 g of JELL-O® cut into 16 equal pieces (1.91 cm × 1.91 cm × 1.91 cm). These JELL-O® servings are shown in figure 1. The array area contained by a border drawn around the outside edges of the JELL-O® pieces, encompassing both the JELL-O® pieces and the white spaces between the JELL-O® pieces, was not held constant between conditions. However, the total plate area occupied by the JELL-O® pieces alone, excluding white spaces, was held constant at 58 cm2. Participants were served their favorite flavor: berry-blue, cherry, grape, lemon, lime, orange, peach, raspberry, or strawberry. Conditions were counterbalanced and occurred on different days. Participants consumed the entire snack in both conditions. Before and after eating, participants completed the Satiety Labeled Intensity Magnitude scale to measure hunger and fullness (Cardello et al 2005). After eating, participants estimated the number of grams consumed (without any reference servings or training), completed the Labeled Affective Magnitude scale to measure how much they liked the JELL-O® (Schutz and Cardello 2001), and completed an experimenter-developed satisfaction questionnaire.
Figure 1.

160 g of JELL-O® cut into 9 pieces (left) and 16 pieces (right).
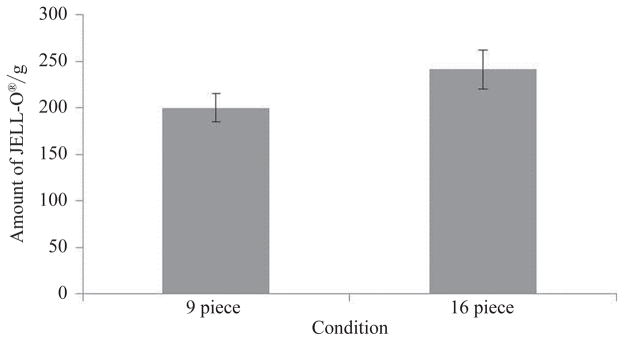
As shown in figure 2, the estimated number of grams consumed was significantly higher in the 16-piece condition (M = 241.36 g, SE = 20.90 g) than the 9-piece condition (M = 199.82 g, SE = 15.30 g) (t38 = 3.01, p < 0.05). Ratings of satisfaction, hunger, fullness, and liking did not differ between the two conditions.
Figure 2.

Participants reported consuming a larger amount of JELL-O® in the 16-piece condition than the 9-piece condition.
In study 2, 279 participants (192 females, mean age = 18.89 years, SD = 1.79 years) were shown both pictures in figure 1 on an Internet-based survey. The pictures were presented side-by-side, and picture order was split evenly among participants. Participants were asked to indicate if the two servings were the same, if the serving on the right had more, or if the serving on the left had more JELL-O®. Response options were randomly presented. 131 participants reported that the two servings were the same, 124 participants reported that the 16-piece serving was more, and 24 participants reported that the 9-piece serving was more JELL-O®, ( , p < 0.05).
The present studies indicate that dividing a fixedserving into more pieces may result in perceiving greater food amounts compared to dividing it into fewer pieces. The effects of piece size and number of pieces cannot be disentangled; that is, when a fixed portion is divided into more pieces, those pieces are smaller. Future research could further manipulate the number of divisions, and thus the difference in size and number of food pieces, to explore the limits of the effect. When the pieces are increasingly disparate in size and number, the effect of perceiving more food may persist, whereas when the pieces are more similar in size and number, the effect of perceiving more food may disappear.
A limitation was that the total area of the array of pieces was not controlled. In study 1, it is possible that the 16-piece condition tended to create a larger array area which may have contributed to the observed effect. In study 2, the total area of the 16-piece array was about 25% larger than of the 9-piece array. This larger array area may have contributed to the perception that more food was present in the 16-piece condition. Future research on this topic should take the array area into consideration for stimuli design.
The effect observed in these studies may have been largely visual. Participants in study 1 did not feel fuller in the 16-piece condition, even though they believed that they had eaten more food. This suggests that the portion size estimates were not derived from internal satiety signals but, instead, from visual cues. Additionally, participants in study 2 used only vision and estimated that the plate with 16 pieces had more food. This finding supports previous research suggesting that it is the visual properties of a food that strongly contribute to portion size estimates (eg Scheibehenne et al 2010).
Acknowledgments
The authors would like to thank Haley Good for her data collection assistance. The first author was supported by a Science, Mathematics, and Research for Transformation (SMART) scholarship. This paper contains work supported by the National Science Foundation under Grant SMA 1004413. Any opinions, findings, and conclusions or recommendations expressed in this material are those of the author(s) and do not necessarily reflect the views of the National Science Foundation.
References
- Barnett-Cowan M. An illusion you can sink your teeth into: Haptic cues modulate the perceived freshness and crispness of pretzels. Perception. 2010;39:1684–1686. doi: 10.1068/p6784. [DOI] [PubMed] [Google Scholar]
- Cardello AV, Schutz HG, Lesher LL, Merrill E. Development and testing of a labeled magnitude scale of perceived satiety. Appetite. 2005;44:1–13. doi: 10.1016/j.appet.2004.05.007. [DOI] [PubMed] [Google Scholar]
- Raghubir P, Krishna A. Vital dimensions in volume perception: Can the eye fool the stomach? Journal of Marketing Research. 1999;36:313–326. [Google Scholar]
- Scheibehenne B, Todd PM, Wansink B. Dining in the dark. The importance of visual cues for food consumption and satiety. Appetite. 2010;55:710–713. doi: 10.1016/j.appet.2010.08.002. [DOI] [PubMed] [Google Scholar]
- Schutz HG, Cardello AV. A labeled affective magnitude (LAM) scale for assessing food liking/disliking. Journal of Sensory Studies. 2001;16:117–159. [Google Scholar]
- Wansink B, Cheney MM. Super bowls: Serving bowl size and food consumption. JAMA: Journal of the American Medical Association. 2005;293:1727–1728. doi: 10.1001/jama.293.14.1727. [DOI] [PubMed] [Google Scholar]
- Wansink B, Payne CR. Counting bones: Environmental cues that decrease food intake. Perceptual and Motor Skills. 2007;104:273–276. doi: 10.2466/pms.104.1.273-276. [DOI] [PubMed] [Google Scholar]


