

Abstract
Aberrant regulation of gene expression in cancer can promote survival and proliferation of cancer cells. Here we integrate TCGA whole genome sequencing data of 436 patients from eight cancer subtypes with ENCODE and other regulatory annotations to identify point mutations in regulatory regions. We find evidence for positive selection of mutations in transcription factor binding sites, consistent with these sites regulating important cancer cell functions. Using a novel method that adjusts for sample- and genomic locus-specific mutation rate, we identify recurrently mutated sites across cancer patients. Mutated regulatory sites include known sites in the TERT promoter and many novel sites, including a subset in proximity to cancer genes. In reporter assays, two novel sites display decreased enhancer activity upon mutation. These data demonstrate that many regulatory regions contain mutations under selective pressure and suggest a larger role for regulatory mutations in cancer than previously appreciated.
Introduction
Cancer is the second leading cause of death in the United States1. As of 2009 approximately 40% of Americans will develop cancer in their lifetime and approximately 50% of these individuals will die of their disease2–4. Despite significant advances in our understanding of the genetic causes of cancer, many therapeutic challenges remain. The complexity of cancer etiology and therapy stems from the fact that no two individuals’ cancers are identical as cancer arises from selection of specific point mutations, structural variants, and epigenetic alterations from a large pool of such variation.
To better understand genetic causes of cancer, large-scale projects such as the Cancer Genome Atlas (TCGA) have performed comprehensive omics profiling of cancer and normal paired samples from thousands of individuals with diverse cancer types. These endeavors have focused primarily on exome sequencing with more recent efforts involving whole genome sequencing (WGS). Analysis of pan-cancer variation from exome sequencing revealed shared sets of mutated genes and pathways between groups of cancers types. Furthermore, these studies have identified mutations in coding genes known as driver mutations that undergo positive selection in cancer5.
Although the majority of sequencing studies in cancer have focused on the protein coding sequences, only a small fraction of the genome codes for protein. Of the remaining genomic sequence, a large portion contains regulatory elements6. It is possible that driver mutations in regulatory elements exist that dysregulate oncogenes and tumor suppressors. Recently an example of a regulatory mutation in cancer has been identified in the regulatory region upstream of the telomerase reverse transcriptase (TERT) gene7,8. Furthermore, Weinhold et al. identified recurrent regulatory mutations regulating expression of PLEKHS1, WDR74 and SDHD in an analysis of mutations in promoters and enhancers9. Fredriksson et al. identify recurrent mutations in proximity to gene transcriptional start sites (TSS), although only TERT mutations were significantly associated altered mRNA transcript levels10. To date, a genome-wide analysis of potential recurrent mutations in all annotated regulatory regions has yet to be performed.
The ENCODE project is a NHGRI funded project with the goal of identifying all the functional elements in the human genome. As of 2012 this project assayed up to 12 histone modifications in 46 cell types and 119 different DNA-binding proteins across 72 cell types6. Additional data from this project include DNaseI hypersensitivity assays, formaldehyde assisted isolation of regulatory elements (FAIRE), DNA methylation, chromosome interacting regions, and RNA transcription. These data and additional genome-wide data including recent Roadmap Epigenomics Mapping Consortium (REMC) data11 have been combined into database resources. One such resource, RegulomeDB12, provides regulatory annotations for any given position in the human genome, enabling facile annotation of regulatory features for potential disease causing variants.
In this study, we analyze TCGA whole genome sequencing data to define sets of point mutations for 436 cancers samples from 8 cancer types. We annotate the mutations with regulatory information and implement a statistical framework to define significantly mutated regulatory regions. We identify the previously observed TERT promoter mutations and numerous novel mutated regulatory sites. This study indicates a far greater role for regulatory region mutations in cancer than previously appreciated.
Results
Identification of Somatic Mutations in Cancer
To identify somatic cancer variants that reside in regulatory regions, we established a data processing workflow (Figure 1A). Whole genome sequencing data generated from cancer and normal tissues collected from 436 patients were subjected to a rigorous analysis to identify single nucleotide variants using two different algorithms. To increase our power to detect recurrent variants, we analyzed all available patient data from 8 different types of cancer (Figure 1A). We performed additional filtering after mutation calling to remove mutations that were likely falsely called due to mapping error (see Materials and Methods) (Supplementary Figure 2). This was done using a heuristic method that searches for homologous genomic regions where the called variant is present in the reference sequence. Lastly, to aid in downstream statistical analyses, we split our cancer samples into test and validation sets. These two sets were generated to have similar numbers of samples and similar distributions of number of mutations per sample (Supplementary Figure 2).
Figure 1.
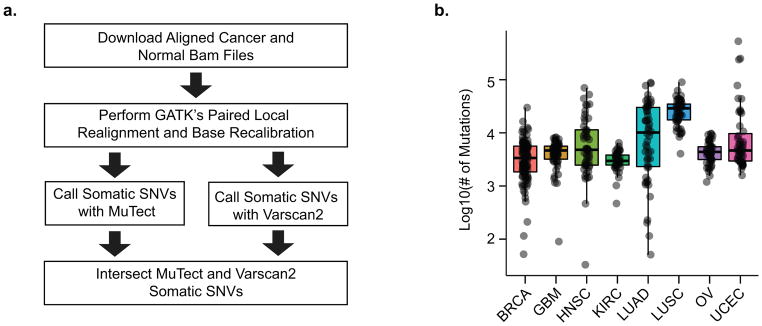
Mutation Calling From Whole Genome Sequencing (A) A schematic of the mutation calling workflow is depicted. (B) The number of mutations found in each cancer is plotted and overlaid with boxplots indicating the observed distribution for cancers of the same type. Upper and lower hinges correspond to 1st and 3rd quartiles. Center corresponds to the median. Whiskers correspond to highest/lowest values within a distance of 1.5 times the IQR from the hinge. BRCA=Breast Invasive Carcinoma, GBM=Glioblastoma Multiforme, HNSC=Head and Neck Squamous Cell Carcinoma, KIRC=Kidney Renal Clear Cell Carcinoma, LUAD=Lung Adenocarcinoma, LUSC=Lung Squamous Cell Carcinoma, OV=Ovarian Serous Cystadenocarcinoma, UCEC=Uterine Corpus Endometrial Carcinoma
Summarizing mutation count data for the samples shows substantial variability between samples within cancer types and between cancer types (Figure 1B) with a higher mutational load in the lung squamous cell carcinoma (LUSC) and lung adenocarcinoma (LUAD) samples, consistent with published data13. Mutation allele fractions differed slightly between cancer types and might reflect a difference in sample purity and/or clonogenicity (Supplementary Figure 1A). Mutation count was not correlated with sequencing depth, suggesting that the whole genome samples were sequenced at sufficient coverage (median of 34 for normal and 50 for cancer tissues) to capture a majority of abundant somatic mutations (Supplementary Figure 1B&C). These data support the integrity of the set of high quality mutations.
Annotation of Cancer Mutations
In order to investigate the role of regulatory mutations, we annotated our mutation set with gene and regulatory information from Gencode and RegulomeDB. RegulomeDB is a searchable database of publicly available regulatory data that includes a wealth of experimental data for transcription factors, epigenetic marks, motifs, and DNA accessibility12. We used this database because it provides uniformly processed, high quality annotations of known regulatory information for any given location in the human genome. For any given site, RegulomeDB provides a score between 1 and 7 in order of decreasing regulatory evidence. In addition to regulatory annotation, we performed transcript annotation using Gencode transcripts. Of note, the potential false positive mutations due to mapping error filtered out of our analysis were highly enriched in non-regulatory regions (Supplementary Figure 2), presumably due to the fact that the filtered sites often lie in difficult to align genomic regions that are also filtered out in the ENCODE peak-calling pipeline employed by RegulomeDB (Supplementary Figure 2). Overall, the annotation procedures revealed that mutations in coding exons and potential regulatory regions represent approximately 0.036–0.056% and 31–39% of the called mutations for each cancer type, respectively (Figure 2A–B). The large fraction of mutations that fall into putative regulatory regions underscores the potential for regulatory dysfunction in cancer.
Figure 2.

Global Analysis of Mutations in Coding and Regulatory Regions (A) Boxplots of the frequency relative to all mutations for each Gencode transcript region type are shown for each cancer type. Overlaid points represent each cancer type. (B) Similar to (A), boxplots of mutations pooled by cancer type are shown for regulatory and non-regulatory regions. Regulatory categories shown are from RegulomeDB. (C) Boxplots depict enrichment analysis of real mutations compared to simulated mutations in various Gencode transcript regions. (D) Similar to (C), boxplots depict enrichment analysis of regulatory region real mutations compared to simulated mutations for mutations annotated with various RegulomeDB scores. (E&F) Plots of sample and annotation (GENCODE transcript region in E and RegulomeDB score in F) pairs with a significant enrichment or depletion in real versus simulated mutations compared to intergenic regions (E) and not regulatory regions (F). Gray denotes P value (two-sided Fisher’s exact test) less than 0.05 in both test and validation sets. (G) Heatmaps of add-one smoothed enrichment and −log10(p-values) (two-sided Fisher’s exact test) are shown for pairs of cancer type and mutations subcategorized by transcription factor binding sites. Only factors that pass significance (FDR < 0.001) in the combined set of all cancer types for test and train are shown.
Absence of Purifying Selection in Regulatory Regions
We next sought to investigate whether mutations in regulatory regions are globally subject to purifying selection in cancer. Purifying selection occurs in order to preserve the fidelity of regions important to the survival of the cell and manifests in fewer observed mutations compared to what is expected by chance. Previously analysis showed that coding regions and regulatory elements are depleted for mutations compared to intergenic, non-regulatory regions9,14. These data could be explained by purifying selection or alternatively by correlation of regulatory elements with covariates known to affect mutation rate, including replication timing and base pair composition13. To analyze purifying selection independent of these covariates, we compared the fraction of mutations in regulatory elements to a set of simulated mutations selected to have matched replication timing, base pair composition, and sufficient coverage such that they could have been called mutations in our analyses (Supplementary Figure 2). Comparing actual to simulated mutations in regulatory regions relative to non-regulatory regions revealed little difference in mutation rate. The data actually show a slight enrichment of mutations in the regulatory regions although the effect size is sufficiently small that this is unlikely to be functionally significant (Figure 2D&F).
In parallel to our analysis of regulatory sites, we performed enrichment analysis of mutations in coding exons, coding introns, noncoding exons, and noncoding introns (Figure 2C&E). We similarly observed no consistent enrichment or depletion in coding exon mutations or any other transcript category. This is consistent with a previous study by Ostrow et al., which analyzed selective pressure in coding regions through analysis of synonymous versus nonsynonymous mutation rates. Ostrow et al. found that compared to germline variation, somatic variation in cancer is governed less by purifying selection and more by positive selection15.
Recurrent Mutation across Regulatory Element Binding Sites
Analysis of categories of regulatory mutations based on RegulomeDB score revealed some enriched categories and cancer type combinations; however, there was no consistent trend across all cancer types (Figure 2D&F). A subset of the regulatory mutations with scores 2a, 2c, and 3b overlap with a transcription factor ChIP Sequencing identified binding sites with a matched motif. We subcategorized these mutations by transcription factor for all sites that pass significance in the combined analysis of all cancer types in both the test and validation sets (Figure 2G and Supplementary Figure 3B). There were numerous categories of mutations that are enriched for mutations indicating positive selection in cancer and few categories that are depleted and thus negatively selected. Clusters of factors overlap highly in their target sites and thus have similar enrichment patterns (Supplementary Figure 3B). These clustered factors are often family members or different versions of a motif for the same factor(s). Mutation in the binding sites of CEBP factors are highly enriched and significant across all cancer types (p<10−10; two-sided Fisher’s exact test). CEBP factors are involved in both gene activation and repression16, thus mutation of CEBP sites likely alters transcriptional regulation.
To further analyze mutations within transcription factor motifs, we systematically aligned the sequences surrounding each mutation with published transcription factor position weight matrices (PWMs) (Figure 3A). For each mutation, we generated a random mutation within the PWM with base conversion probabilities matched to the original patient sample. We then computed a match score of the reference, mutant, and random mutant sequences to the motif PWM. Two examples of aligned mutations are shown for CEBPD and SPI1 in Figure 3B. CEBPD mutations are concentrated around the central CG dinucleotide in the palindromic CEBPD motif. In contrast SPI1 mutations are spread across the entire motif. The CEBPD mutation pattern is highly suggestive of selection for mutation of a specific residue of the motif. This selection might more effectively inhibit transcription factor binding, increase affinity of the transcription factor for the motif, or allow for creation of a new motif. We favor the possibility that mutations in CEBP sites modulate but do not destroy the specificity of the CEBP sites as many of the mutations do not decrease the match of the motif to PWMs from the literature and previous reports show that a CEBP binding site matching the mutant version identified here drives transcription in luciferase reporter assays17.
Figure 3.

Effects of Mutations on Transcription Factor Binding Sites (A) An illustration is shown describing the methodology of aligning and generating match scores for mutations contained within transcription factor binding sites. (B) Mutated regions for each transcription factor were aligned to the factor’s PWM and sequence logos were generated. Sequence logos for the literature motif, the aligned reference, and the aligned mutant sequences as well as the mutation counts at each position are shown for two representative transcription factors (CEBPD and SPI1). (C) For each transcription factor the match score to the transcription factor PWM was determined for all the factors mutated sites. Plotted is the mean difference in the match score (y-axis) for each transcription factor (x-axis) between the mutated sites and the reference. Red indicates FDR<0.05. P-value computed by two-sided paired Wilcoxon rank-sum test. (D) A table showing the breakdown of transcription factors that contain sites with match scores that are significantly different than reference and/or significantly different than those of random mutations. (E) A histogram of pooled match scores of factors that are significantly worse than reference and worse than random. (F) For each transcription factor with a significantly worse match score than reference and random the mean difference between the mutant sites and reference (x-axis) is plotted against the mean difference between the mutant sites and random mutant sites (y-axis). The color of the text scales with the −log10(p-value) of the real versus random scores and the size of the point scales with the number of mutant sites.
Analysis of the motif match scores for mutant sequences of all transcription factors compared to reference shows that for the majority of transcription factors the mutated sites significantly reduced the match scores (Figure 3C). Comparison of scores to the random mutations shows that 6 of these transcription factors (GATA3, GATA6, MAFK, FOS, AP1, and NFE2) have mutated sites with match scores significantly worse than random (p < 0.001; two-sided paired Wilcoxon rank-sum test) Figure 3D). For these factors, the distribution of the deviance of the real and random mutations in these transcription factor sites is shown in Figure 3E and the identity of these transcription factors and the mean deviance of their scores from reference and random is shown in 3F. Mutations in the binding sites for these factors tend to be concentrated in one or a few residues of the motif, suggesting selective pressure for these specific mutations (Supplementary Figure 4F). All six of these transcription factors have known roles in cancer. GATA3 and GATA6 belong to the GATA family of transcription factors which are often lost during advanced carcinogenesis18. MAFK belongs to the small MAF protein family and can form heterodimers with CNC transcription factors including NFE2, and their expression is often lower in cancer19. FOS as well as MAF family proteins are components of various AP-1 transcription factor complexes, which are canonically thought to promote proliferation and survival in cancer but in certain contexts may also have tumor suppressor activity20. Overall, these results indicate recurrent patterns of mutation in specific transcription factor sites that may either enhance or repress gene expression.
Given the uneven distribution of mutations within the binding sites of a number of the mutated transcription factors sites, we investigated the possibility that specific mutations within these sites might create de novo binding sites for other factors. We focused our attention on the highly significant enrichment of mutations in sites of the CEBP transcription factors and screened known binding site motifs for those with significantly higher match scores in the mutant CEBP sites than in the reference sites. We found that the mutated sites had higher match scores than reference for SOX17, DBP, SOX10, SOX5, HOXA10, PAX5, CMAF, PARP, EN1, BCL6, and CAP (Supplementary Figure 4A). Alignment of the mutant sequences revealed a consensus motif (Supplementary Figure 4B) with the most common instances of this motif shown in Supplementary Figure 4C. The CEBP mutated sites tend to be evenly distributed among all patients with the exception of one UCEC patient (Supplementary Figure 4D). Expression of the transcription factors for the high scoring motifs revealed no significant difference in expression between samples with and without mutations in these sites (Supplementary Figure 4E). These results suggest that selective pressure exists in cancer to convert CEBP sites into a common oncogenic site; however, it remains unclear whether any factors (either CEBP or alternative factors) bind these new sites.
Recurrently Mutated of Specific Regulatory Sites
We next sought to further investigate the possibility that a subset of recurrent mutations exist due to positive selection in cancer. Previous evidence for this phenomenon comes from the identification of somatic mutations upstream of the telomerase reverse transcriptase gene (TERT)7,8, somatic mutations in regulatory regions of PLEKHS1, WDR74 and SDHD9, as well as examples of germline mutations such as those found in the CCND1 enhancer21. Previous methodologies for whole genome analysis of recurrent mutations failed to take into account sample specific probabilities dependent on replication timing, base pair composition, and presence of annotated transcripts—covariates suggested from previous work to affect background mutation rate and model performance13. Our algorithm employs logistic regression to determine sample specific and covariate corrected background mutation probabilities followed by a Poisson binomial model to account for patient specific probabilities (Figure 4A). We trained our logistic regression model on all mutations from all samples and used the resulting model to estimate the probability of mutation for any given sample given any combination of replication timing, base pair type, and transcript region. Plotting boxplots of these predicted probabilities for all samples and all combinations of covariates shows that base pair composition and replication timing but not transcript region strongly influence the predicted mutation probability (Supplementary Figure 5A). All mutated genomic loci were evaluated for recurrent mutation of both single nucleotides and 10 base pair windows around identified mutations. Mutations that where potential false positives from mapping errors or common SNPs were removed from the analysis and multiple hypothesis testing was considered by applying a 5% false discovery rate cutoff by the Benjamini Hochberg procedure22. The total number of regions tested for the FDR cutoff was estimated as the average total number of positions in the genome with high read coverage.
Figure 4.

Identification of Repeatedly Mutated Regulatory Regions (A) Schematic of the significance assessment algorithm. For each regulatory site or window, the probability of k or more cancers containing a mutation in the region is approximated by a Poisson binomial model. Each mutation in each cancer sample is assigned a sample and site-specific mutation probability according to a logistic regression model. This model estimates the probability of mutation conditioned on replication timing, base pair type, transcript annotations, and sample ID. Post analysis filtering is performed to limit false positives. Sites are first filtered to remove common SNPs and likely mapping errors and then subjected to a false discovery rate cutoff of 0.05. (B) Shown is the −log10 of the probability of repeated mutation of individual sites for regulatory regions (y-axis) versus the number of times the site is found mutated (x-axis). (C) Shown is the −log10 of the probability of repeated mutation of 10 base pair windows for regulatory regions versus the number of times the site is found mutated. Arrows point to 2 known regulatory mutations in the TERT promoter.
Results are plotted for both single nucleotides (Figure 4B) and 10 base pair windows (Figure 4C). Selection of driver mutations in coding genes has been studied extensively, and we replicated a number of known findings, including the identification of selected mutations in the coding regions of TP53, AKT1, PIK3CA, PTEN, EGFR, CDKN2A, and KRAS (Figure 5 Source Data). In addition to previously identified TERT promoter mutations, we found eight novel mutated loci potentially regulating known cancer genes, including GNAS, INPP4B, MAP2K2, BCL11B, NEDD4L, ANKRD11, TRPM2, and P2RY8. GNAS, NEDD4L, BCL11B, and ANKRD11 are recurrently mutated in cancers5. TRPM2 and INPP4B are in the tumor suppressor database23. Additionally, GNAS, MAP2K2, BCL11B, and P2RY8 are in the cancer gene census24.
Figure 5.

Functional Validation of Identified Mutated Regions (A) Schematic of the luciferase reporter assays used to assess enhancer activity of the identified mutated regions. (B) Luciferase assay results for the wild-type and mutant versions of three regulatory regions repeatedly mutated in cancers. Assays are performed in NCI-H1437 (Lung), KYSE-450 (Esophageal), and Ku-19-19 (Bladder) cell lines. * represents p<0.05 (two-sided t-test) with 4 replicates. Error bars depict the standard deviation.
Our search for recurrent regulatory mutations is related to that of Fredriksson et al. and Weinhold et al. Fredriksson uses a threshold cutoff of 5 recurrent mutations in their published list of 17 recurrent promoter mutations. We find the same recurrent mutations in TERT (2 sites) and PLEKHS1 (1 site). Of the remaining 14 mutations 12 are in cancer types we did not analyze and 2 sites are present but below our statistical threshold. If we relaxed the criteria that mutations be called by both MuTect and Varscan2, then these additional two sites would also be called. Importantly, our method is much more sensitive than a 5 mutation threshold allowing us to find many more significantly mutated sites.
Comparing to Weinhold et al. our sites overlap with hotspot regions near C1orf159, TERT, and PLEKHS1. Weinhold uses a larger set of tumors and finds 193 hotspot regions in promoters and enhancers. We find mutations in our samples in 102 of these regions. 35 of these regions are completely removed from our analysis when accounting for potential mapping errors and 7 additional regions have at least one mutation that is likely a mapping error. Twelve of the 102 had counts high enough that they may have been called significant in our analysis if all the mutations had been within 10bp of each other but all but the PLEKHS1 hotspot region had a region size larger than 10bp, and thus the window size of our method did not identify these sites. Compared to the Weinhold method, we find an additional 210 significant single base recurrently mutated sites that are not in annotated coding regions. These data suggest that our methodology provides significant gains in both sensitivity and specificity over the Weinhold method.
We additionally searched for correlations between 116 mutated regulatory loci and their associated genes that had matched RNA Sequencing data both for all cancers and for each cancer type individually. After multiple hypothesis correction one site in proximity to the PLCXD1 gene significantly correlated with RNA expression (Supplementary Figure 5C). This analysis is severely limited by small sample size at any given site and fails to show a correlation even for TERT. In the case of TERT, the trend for increased expression with mutation is present but fails to reach significance after multiple hypothesis correction. This likely is due to our limited sample size and the fact that increased TERT expression is driven by mechanisms in addition to promoter mutation in cancer.
Somatic Mutation Alters Enhancer Activity
We chose to investigate the functional activity of 9 novel candidate regulatory mutations as well as 4 additional regions that were mutated in at least 3 samples but did not pass significance. One TERT promoter mutation was included as a positive control. We generated luciferase reporter constructs to test the enhancer activity of wild-type and mutated regulatory regions (Figure 5A) and screened them in a lung cancer cell line. We found two regions in addition to TERT that had substantial reporter activity relative to the empty vector and both of these regions showed decreased activity in the mutant (Supplementary Figure 6). These two regions were investigated further with the lung and two additional cell lines (a bladder and an esophageal cell line). Both mutations in the chromosome 14 region decreased activity in all three cell lines and the chromosome 19 mutant decreased activity in all but the esophageal cell line. In contrast, the mutant TERT promoter element increased activity in all cell lines (Figure 5B). The chromosome 19 mutant is in an intron of the GP6 gene which currently does not have a well-documented role in cancer. However, the chromosome 14 mutants are situated in a potential enhancer between SETD3 and BCL11B. BCL11B is implicated as a haploinsufficient tumor suppressor in T-cell acute lymphoblastic leukemia25, thus mutations in this element may decrease activity of BCL11B and contribute to oncogenesis. The GP6 mutated locus can bind ETS1, GAPBP1, POLR2A, SIN3A, EGR1 and the mutated site falls on the edge of an ESR1 motif. The BCL11B locus can bind IRF1, NFYA, NFYB, SP1, TBP, EGR1, MAX, FOS, and POLR2A. It remains unclear which factors may be disrupted by the mutations.
Discussion
Noncoding DNA elements comprise the majority of the genome, and the data in this study highlights the importance of these regions and regulatory regions in particular in cancer. Our study reveals that mutations in specific categories of regulatory sites undergo positive selection. We observe patterns of mutation that suggest that cancers select for specific mutations that destroy and/or possibly create new binding sites for certain transcription factors. Furthermore, we find evidence for the recurrent mutation of specific regulatory sites including many in proximity to known cancer genes. Two of these novel regulatory regions display reduced regulatory activity upon mutation.
We find that for most cancers, somatic mutations do not globally experience purifying selection in regulatory regions. This is in contrast to recent evidence that regulatory regions experience purifying selection at the human population level26. A major difference between selection in cancer and selection at the human population level is that in cancer only a single cell type is subject to selection whereas in an organism selection can occur via dysfunction of any cell type. Furthermore, in cancer damaging mutations may be more tolerated due to dysfunction in the normal apoptotic process. Previous studies, including those of Weinhold et al.9, show that the rate of mutation in intergenic regions is greater than coding and regulatory regions. Our analysis suggests that the observed difference in mutation rate can be explained largely, if not entirely, by potential false positive mutations from mapping errors and by differences in mutation rate based on base-pair type and replication timing. Nevertheless, our study is not without important caveats. Our results were generated using regulatory information collected from many cell types. Since only a fraction of the annotated regulatory regions are active in any given cell type, the mix of regulatory and non-regulatory regions may be skewing our results. Indeed, recent data from Polak et al. show that intra chromosomal mutation rate in cancer is inversely related to open chromatin state of the cell type of origin for each cancer type but not for other cell types. This finding is consistent with purifying selection occurring only in the subset of regulatory regions active in the cell type of origin for the cancer27.
Further sub-classification of regulatory mutations by transcription factor binding sites, revealed a subset of regulatory regions that are selectively mutated likely to either destroy the site or increase the affinity of the site for transcription factor binding. Presumably such mutations could promote cancer by repressing tumor suppressors or by activating oncogenes. Mutations could inactivate tumor suppressor genes by removing activating sites or adding repressive sites and activate oncogenes by removing repressive sites or adding activating sites.
Our study also highlights the potential importance of regulatory driver mutations at specific genomic loci in cancer progression. We find that in addition to the well-known TERT promoter mutations, there exist a number of regulatory mutations that are positively selected in cancer. Our study implicates a number of regulatory regions in proximity to known genes. Recurrent mutations occur near the known cancer genes GNAS, INPP4B, MAP2K2, BCL11B, NEDD4L, ANKRD11, TRPM2, and P2RY8 as well as newly implicated genes such as GP6. These analyses mark an important advance towards identifying recurrent functional regulatory region mutations. In the future, incorporation of additional cancer samples from an increased number of cancer types will enable a more comprehensive analysis of shared and cancer-type specific regulatory driver mutations.
It has been suggested that there are as many or more genomic regions responsible for gene regulation than genes themselves6. As such, a large number of such regions could be mutated in cancer. This regulatory redundancy may protect against selection for deleterious mutations in the regulatory regions of some tumor suppressors but should also increase the amount of regulatory sequence that could have a functional impact if mutated. The presence of multiple regions upstream of TERT that are implicated in cancer and the fact that any one gene can have numerous different enhancers28 supports this hypothesis. Overall, we expect that many regulatory regions will prove to play important roles in cancer and thus the approaches and information employed in this study represent an important step in our analysis of such regions.
Online Methods
Mutation Calling
Access to cancer and normal whole genome sequencing data was obtained from the Cancer Genome Atlas (TCGA) project via dbGaP and raw data were downloaded pre-aligned in bam file format from the Cancer Genomics Hub (CGHub). All aligned bam files were subjected to paired local realignment via GATK’s RealignerTargetCreator and IndelRealigner. The realigned bam files were then base recalibrated using GATK’s BaseRecalibrator. Point mutations were called with default settings using MuTect29 and Varscan2’s Somatic caller30. The intersection of the calls from both MuTect and Varscan2 was used for further analysis.
Regulatory Annotations
Mutations were assigned regulatory annotations via RegulomeDB12. Regulatory mutations were considered to be any mutation in RegulomeDB categories 1–5, which include all regions that minimally contain a transcription factor binding peak or a DNAse peak from experimental data.
Transcription Factor Binding Site Analysis
Position weight matrices (PWMs) for transcription factors were obtained from Jaspar31 and Transfac32. R code was written to align reference and mutated regions to factor specific PWMs based on the position of maximum PWM match score for the transcription factor in the reference sequence. The PWM match score algorithm is taken from Kel et al.33 The seqLogo R package was used for displaying sequence alignments and the Muscle R package was used to ensure optimal alignment of transcription factor motifs surrounding mutations. Both positive and negative strands (reverse complement) of the reference sequence were considered to optimize the alignments. For the loss of site analyses the reference sequence surrounding mutations was used to determine the position of maximal alignment to the transcription factor PWM. For gain of site analyses, the mutant sequence was used to identify the position of maximal binding. For the gain of site analysis presented in Supplementary Figure 4, only created sites with a median match score greater than 0.9 were considered. Random mutations in transcription factor binding sites were generated for each binding site mutation in each annotated binding site in each patient. These mutations were selected at random from within the motif with nucleotide conversion probabilities generated from the overall conversion frequencies for that patient.
Transcript Annotations
Transcript annotations in Figure 2 were generated by overlap of mutations with Gencode17 transcripts34. Mutation location (promoter, five prime UTR, intron, coding exon, three prime UTR, and gene symbol) annotations in Supplementary Figure 2B were generated using UCSC Gene Annotations35. For genes with multiple transcripts, location annotations were made in the following order: promoter, coding exon, five prime UTR, three prime UTR, intron. For example, if a mutation was in an annotated intron and also in an annotated three prime UTR the three prime UTR annotation was kept and the intron annotation discarded.
Sequencing Coverage Calculations
Sequencing coverage was calculated from the VarscanSomaticSNP output. This output gives cancer and normal read counts for all potential germline and somatic variants. The median coverage for each cancer and normal sequencing sample was determined by taking the median coverage of these variants.
Covariate Matched Simulated Mutations
Simulated mutations were generated by first randomly sampling positions in the genome for each patient that could have been called a mutation based on the MuTect coverage output. Replication timing and base pair composition covariates were determined for all real and random mutations and then the R Matching package36 was used to perform covariate matching for real and random mutations pooled by cancer type.
Splitting of Data into Experimental and Validation Sets
Samples were segregated by cancer type and for each cancer type sorted by the number of mutations. Walking down the sorted list the samples were sorted into experimental (E) and validation (V) as follows E, V, V, E, E, V, V … E.
Replication Timing
Encode replication timing data were downloaded from the UCSC Genome Browser.37 The average waveform from the following cell types was used to associate genomic regions with replication timing: Bj, Gm06990, Gm12801, Gm12812, Gm12813, Gm12878, Helas3, Hepg2, Huvec, Imr90, K562, Mcf7, Nhek, and Sknsh. These averages were then assigned to bins from 1:100 to discretize the data.
Statistical Modeling of Recurrent Mutations
All unique chromosomal mutations were tested for statistical significance. Let n=# of individuals, k=# of individuals with a mutation in a given region. Given a region of interest we sought to estimate the probability of k or more mutations from n individuals. We used a Poisson Binomial model, which differs from the binomial in that each tumor is assigned its own probability of mutation. Formally the probability we calculate is as follows:
where Fl is the set of all subsets of k integers that can be selected from {1,2, …, n}, n is the number of tumors, k is the number of tumors with the region mutated, pi is the probability that site i is mutated,
In practice we used an approximation for the Poisson binomial in the poibin R package38. Each individual’s unique mutation probability for a given region was determined by fitting a logistic regression model to all data with the following features: patient ID, replication timing bin, base pair (CG versus AT), and presence and type of annotated transcript in the region (none, coding exon, noncoding exon, coding intron, noncoding intron). Interactions between each patient ID and replication timing as well as between patient ID and base pair type were included in the model. These select interactions were included to increase the fit of the model. For regions, as opposed to single sites, the region probability was determined as follows:
where i is the base position within a site of length l and pi is the probability that base i is mutated
Filtering out False Positives from Mapping Errors and SNPs
SNPs from DBSNP build 141 were downloaded from the UCSC table browser. Called mutations that share the chromosomal position and variant allele with a common SNP were filtered out. Predicted mapping errors were determined by querying BLAT39 with a 201 base pair region centered on the genomic position of the variant. Importantly, the variant allele was used in place of the reference for this analysis. A score between 0 and 100 was given based on the length of the longest aligned region for a given BLAT result that included up to a 100 base pair long match to the reference genome such that the reference allele for the matched genomic region matches the called variant allele. A 201 base pair window was chosen as it should be sufficient to cover all potential overlapping reads as mapped read sizes are typically smaller than 100 base pairs. For the ten base pair window analysis, a region score was generated by averaging the scores of all the mutations contained within the region. Regions with an average score greater than 50 were filtered out as potential false positives. The 1000 genomes hs37d5 reference was used for the BLAT search. Overlap analysis in Supplementary Figure 2 of filtered out regions with difficult to align regions of the genome was performed using 50mer alignability tracks. Any mutation with a score of 0.5 or less was considered difficult to align.
Luciferase Reporter Assays
To examine the effects of recurrent somatic mutations on transcription, wild-type and mutant regions 201bp in length and centered on each mutation were synthesized and cloned into the KpnI and NheI site of the pGL4.23[luc2/pmin] luciferase reporter construct (Promega). Lung adenocarcinoma (NCI-H1437), esophageal adenocarcinoma (KYSE-450) and bladder carcinoma (Ku-19-19) cells, growing in 96-well plates, were transfected in quadruplicate with 200ng of the pGL4.23 reporter construct and 40ng of the pRL-CMV Renilla control plasmid (Promega). Forty-eight hours post-transfection luciferase activity was measured using the Dual-Glo Luciferase Assay System (Promega). Statistically significant differences in the relative luciferase activities between wild-type and mutant regions were determined using a two-sided Student’s t-Test, assuming equal variance. Visually the variance appears equal between the tested data and there is no biologically reason they should be different.
Code Availability
Code for identification of recurrently mutated genomics sites is available through GitHub.
Supplementary Material
Acknowledgments
We would like to thank members of the Snyder lab for critical reading of the manuscript. We would also like to thank Alan Boyle for helpful discussion regarding the use of RegulomeDB. Finally, we would like to thank members of the ENCODE consortium for their helpful scientific feedback during the course of this work. C.M. was supported by the Stanford Biomedical Informatics Training program and funds from the National Institutes of Health (NIH; 1K99CA191093). D.S. was supported by NIH/NHGRI T32 HG000044 and the Genentech Graduate Fellowship. This work was supported by funds to C.M. (NIH; 1K99CA191093-01) and M.S. (NIH 5U54HG006996-04).
Footnotes
Author Contributions
J.R. and D.S. contributed to experimental design, execution, and analysis of experiments in Figures 5 & Supplementary Figure 6. C.M. contributed to all other figures. C.M. and M.S. conceived the experiments, analyzed the data, and wrote the manuscript.
Competing Interests Statement
The authors declare no competing financial interests.
URLs
ENCODE 50mer alignability tracks http://genome.ucsc.edu/cgi-bin/hgFileUi?db=hg19&g=wgEncodeMapability; ENCODE Replication Timing http://hgdownload.cse.ucsc.edu/goldenPath/hg19/encodeDCC/wgEncodeUwRepliSeq/; The Cancer Genome Atlas (TCGA) http://cancergenome.nih.gov/; GitHub Site for recurrent mutation code https://github.com/collinmelton/RecurrentMutationStats/; Cancer Genomics Hub (CGHub) https://cghub.ucsc.edu/; dbSNP http://www.ncbi.nlm.nih.gov/SNP/; UCSC Table Browser https://genome.ucsc.edu/cgi-bin/hgTables; RegulomeDB regulome.stanford.edu;
References
- 1.Hoyert DL, Xu J. Deaths: Preliminary Data for 2011. National Vital Statistics Reports. 2012;61 [PubMed] [Google Scholar]
- 2.Howlander, et al. SEER Cancer Statistics Review, 1975–2010. 2013 at < http://seer.cancer.gov/csr/1975_2010/>.
- 3.Lifetime Risk (Percent) of Being Diagnosed with Cancer by Site and Race/Ethnicity: Males, 18 SEER Areas, 2008–2010 (Table 1.16) and Females, 18 SEER Areas, 2008–2010 (Table 1.17). at <http://seer.cancer.gov/csr/1975_2010/results_merged/topic_lifetime_risk_diagnosis.pdf>
- 4.Lifetime Risk (Percent) of Dying from Cancer by Site and Race/Ethnicity: Males, Total US, 2008–2010 (Table 1.19) and Females, Total US, 2008–2010 (Table 1.20). at <http://seer.cancer.gov/csr/1975_2010/results_merged/topic_lifetime_risk_death.pdf>
- 5.Tamborero D, et al. Comprehensive identification of mutational cancer driver genes across 12 tumor types. Sci Rep. 2013;3:2650. doi: 10.1038/srep02650. [DOI] [PMC free article] [PubMed] [Google Scholar]
- 6.ENCODE Project Consortium et al. An integrated encyclopedia of DNA elements in the human genome. Nature. 2012;489:57–74. doi: 10.1038/nature11247. [DOI] [PMC free article] [PubMed] [Google Scholar]
- 7.Huang FW, et al. Highly recurrent TERT promoter mutations in human melanoma. Science. 2013;339:957–959. doi: 10.1126/science.1229259. [DOI] [PMC free article] [PubMed] [Google Scholar]
- 8.Vinagre J, et al. Frequency of TERT promoter mutations in human cancers. Nature Communications. 2013;4 doi: 10.1038/ncomms3185. [DOI] [PubMed] [Google Scholar]
- 9.Weinhold N, Jacobsen A, Schultz N, Sander C, Lee W. Genome-wide analysis of noncoding regulatory mutations in cancer. Nat Genet. 2014 doi: 10.1038/ng.3101. [DOI] [PMC free article] [PubMed] [Google Scholar]
- 10.Fredriksson NJ, Ny L, Nilsson JA, Larsson E. Systematic analysis of noncoding somatic mutations and gene expression alterations across 14 tumor types. Nat Genet. 2014;46:1258–1263. doi: 10.1038/ng.3141. [DOI] [PubMed] [Google Scholar]
- 11.Roadmap Epigenomics Consortium et al. Integrative analysis of 111 reference human epigenomes. Nature. 2015;518:317–330. doi: 10.1038/nature14248. [DOI] [PMC free article] [PubMed] [Google Scholar]
- 12.Boyle AP, et al. Annotation of functional variation in personal genomes using RegulomeDB. Genome Res. 2012;22:1790–1797. doi: 10.1101/gr.137323.112. [DOI] [PMC free article] [PubMed] [Google Scholar]
- 13.Lawrence MS, et al. Mutational heterogeneity in cancer and the search for new cancer-associated genes. Nature. 2013;499:214–218. doi: 10.1038/nature12213. [DOI] [PMC free article] [PubMed] [Google Scholar]
- 14.Lee W, et al. The mutation spectrum revealed by paired genome sequences from a lung cancer patient. Nature. 2010;465:473–477. doi: 10.1038/nature09004. [DOI] [PubMed] [Google Scholar]
- 15.Ostrow SL, Barshir R, DeGregori J, Yeger-Lotem E, Hershberg R. Cancer evolution is associated with pervasive positive selection on globally expressed genes. PLoS Genet. 2014;10:e1004239. doi: 10.1371/journal.pgen.1004239. [DOI] [PMC free article] [PubMed] [Google Scholar]
- 16.Huber R, Pietsch D, Panterodt T, Brand K. Regulation of C/EBPβ and resulting functions in cells of the monocytic lineage. Cell Signal. 2012;24:1287–1296. doi: 10.1016/j.cellsig.2012.02.007. [DOI] [PubMed] [Google Scholar]
- 17.Miyazawa K, Mori A, Yamamoto K, Okudaira H. Transcriptional Roles of CCAAT/Enhancer Binding Protein-β, Nuclear Factor-κβ, and C-promoter Binding Factor 1 in Interleukin (IL)-1β-induced IL-6 Synthesis by Human Rheumatoid Fibroblast-like Synoviocytes. J Biol Chem. 1998;13:7620–7627. doi: 10.1074/jbc.273.13.7620. [DOI] [PubMed] [Google Scholar]
- 18.Zheng R, Blobel GA. GATA Transcription Factors and Cancer. Genes Cancer. 2010;1:1178–1188. doi: 10.1177/1947601911404223. [DOI] [PMC free article] [PubMed] [Google Scholar]
- 19.Kannan MB, Solovieva V, Blank V. The small MAF transcription factors MAFF, MAFG and MAFK: current knowledge and perspectives. Biochim Biophys Acta. 2012;1823:1841–1846. doi: 10.1016/j.bbamcr.2012.06.012. [DOI] [PubMed] [Google Scholar]
- 20.Shaulian E. AP-1--The Jun proteins: Oncogenes or tumor suppressors in disguise? Cell Signal. 2010;22:894–899. doi: 10.1016/j.cellsig.2009.12.008. [DOI] [PubMed] [Google Scholar]
- 21.Schödel J, et al. Common genetic variants at the 11q13.3 renal cancer susceptibility locus influence binding of HIF to an enhancer of cyclin D1 expression. Nat Genet. 2012;44:420–5. S1–2. doi: 10.1038/ng.2204. [DOI] [PMC free article] [PubMed] [Google Scholar]
- 22.Benjamini Y, Hochberg Y. Controlling the False Discovery Rate: A Practical and Powerful Approach to Multiple Testing. Journal of the Royal Statistical Society Series B (Methodological) 1995;57:289–300. [Google Scholar]
- 23.Zhao M, Sun J, Zhao Z. TSGene: a web resource for tumor suppressor genes. Nucleic Acids Res. 2013;41:D970–6. doi: 10.1093/nar/gks937. [DOI] [PMC free article] [PubMed] [Google Scholar]
- 24.Futreal PA, et al. A census of human cancer genes. Nat Rev Cancer. 2004;4:177–183. doi: 10.1038/nrc1299. [DOI] [PMC free article] [PubMed] [Google Scholar]
- 25.Van Vlierberghe P, Ferrando A. The molecular basis of T cell acute lymphoblastic leukemia. J Clin Invest. 2012;122:3398–3406. doi: 10.1172/JCI61269. [DOI] [PMC free article] [PubMed] [Google Scholar]
- 26.Khurana E, et al. Integrative annotation of variants from 1092 humans: application to cancer genomics. Science. 2013;342:1235587–1235587. doi: 10.1126/science.1235587. [DOI] [PMC free article] [PubMed] [Google Scholar]
- 27.Polak P, et al. Cell-of-origin chromatin organization shapes the mutational landscape of cancer. Nature. 2015;518:360–364. doi: 10.1038/nature14221. [DOI] [PMC free article] [PubMed] [Google Scholar]
- 28.Li G, et al. Extensive promoter-centered chromatin interactions provide a topological basis for transcription regulation. Cell. 2012;148:84–98. doi: 10.1016/j.cell.2011.12.014. [DOI] [PMC free article] [PubMed] [Google Scholar]
- 29.Cibulskis K, et al. Sensitive detection of somatic point mutations in impure and heterogeneous cancer samples. Nat Biotechnol. 2013;31:213–219. doi: 10.1038/nbt.2514. [DOI] [PMC free article] [PubMed] [Google Scholar]
- 30.Koboldt DC, et al. VarScan 2: somatic mutation and copy number alteration discovery in cancer by exome sequencing. Genome Res. 2012;22:568–576. doi: 10.1101/gr.129684.111. [DOI] [PMC free article] [PubMed] [Google Scholar]
- 31.Mathelier A, et al. JASPAR 2014: an extensively expanded and updated open-access database of transcription factor binding profiles. Nucleic Acids Res. 2014;42:D142–7. doi: 10.1093/nar/gkt997. [DOI] [PMC free article] [PubMed] [Google Scholar]
- 32.Matys V, et al. TRANSFAC and its module TRANSCompel: transcriptional gene regulation in eukaryotes. Nucleic Acids Res. 2006;34:D108–10. doi: 10.1093/nar/gkj143. [DOI] [PMC free article] [PubMed] [Google Scholar]
- 33.Kel AE, et al. MATCH: A tool for searching transcription factor binding sites in DNA sequences. Nucleic Acids Res. 2003;31:3576–3579. doi: 10.1093/nar/gkg585. [DOI] [PMC free article] [PubMed] [Google Scholar]
- 34.Harrow J, et al. GENCODE: the reference human genome annotation for The ENCODE Project. Genome Res. 2012;22:1760–1774. doi: 10.1101/gr.135350.111. [DOI] [PMC free article] [PubMed] [Google Scholar]
- 35.Karolchik D, et al. The UCSC Genome Browser database: 2014 update. Nucleic Acids Res. 2014;42:D764–70. doi: 10.1093/nar/gkt1168. [DOI] [PMC free article] [PubMed] [Google Scholar]
- 36.Sekhon JS. Multivariate and Propensity Score Matching Software with Automated Balance Optimization. The Matching Package for R. 2008 [Google Scholar]
- 37.Hansen RS, et al. Sequencing newly replicated DNA reveals widespread plasticity in human replication timing. Proc Natl Acad Sci USA. 2010;107:139–144. doi: 10.1073/pnas.0912402107. [DOI] [PMC free article] [PubMed] [Google Scholar]
- 38.Hong Y. On computing the distribution function for the Poisson binomial distribution. Computational Statistics & Data Analysis. 2013 [Google Scholar]
- 39.Kent WJ. BLAT--the BLAST-like alignment tool. Genome Res. 2002;12:656–664. doi: 10.1101/gr.229202. [DOI] [PMC free article] [PubMed] [Google Scholar]
Associated Data
This section collects any data citations, data availability statements, or supplementary materials included in this article.