

Abstract
Objective
To determine the impact of geographic location on advanced-stage ovarian cancer mortality in relation to adherence to National Comprehensive Cancer Network (NCCN) treatment guidelines and hospital case volume.
Study Design
Retrospective observational cohort study of patients diagnosed with stage IIIC/IV epithelial ovarian cancer (1/1/96-12/31/06) identified from the California Cancer Registry. Generalized additive models were created to assess the effect of spatial distributions of geographic location, demographic characteristics, disease-related variables, adherence to NCCN guidelines, and hospital case volume, with simultaneous smoothing of geographic location and adjustment for confounding variables.
Results
A total of 11,765 patients were identified. Twelve of the 378 hospitals (3.2%) were high-volume hospitals (≥20 cases/year, HVH) and cared for 2,112 patients (17.9%). For all patients, the median distance to a HVH was 22.7km/14.1mi and 80% were located within 79.6km/49.5mi of a HVH. Overall, 45.4% of patients were treated according to NCCN guidelines. The global test for location revealed that geographic position within the state was significantly correlated with ovarian cancer mortality after adjusting for other variables (p<0.001). Distance to receive care ≥32km/20mi was protective against mortality (HR=0.86, 95%CI=0.79–0.93), while distance from a HVH ≥80km/50mi was associated with an increased risk of death (HR=1.13, 95%CI=1.03–1.23). The effects of geographic predictors were attenuated when non-adherence to NCCN guidelines (HR=1.25, 95%CI=1.18–1.32) and care at a HVH (HR=0.87, 95%CI=0.81–0.93) were introduced into the model.
Conclusions
Geographic location is a significant predictor of advanced-stage ovarian cancer mortality and the effect is primarily related to the likelihood of receiving NCCN guideline adherent care and treatment at a HVH.
Keywords: ovarian cancer, geographic location
INTRODUCTION
In the United States (U.S.), there are 22,000 new cases of ovarian cancer diagnosed and over 14,000 disease-related deaths annually, which accounts for more deaths than all other gynecologic cancers combined [1]. Survival determinants are multi-factorial; however, health care delivery system characteristics have emerged as important predictors of ovarian cancer-related mortality. Adherence to National Comprehensive Cancer Network (NCCN) treatment guidelines for ovarian cancer has recently been validated as correlating with improved disease-specific and overall survival, with the demonstrable survival benefit being proportionally greater for women with advanced-stage disease [2–4]. In addition, average annual hospital ovarian cancer case volume has been correlated with improved outcomes [5–9]. Specifically, hospitals treating ≥20 cases/year, or high-volume hospitals (HVHs), are more likely to administer standard recommended treatment but are also associated with an independent survival benefit over and above adherence to treatment guidelines [3, 9].
The contribution of geographic location to differences in access to health care, resource utilization, and cancer survival is becoming increasingly relevant [10]. Recently, our group examined the impact of geographic location on adherence to NCCN treatment guidelines among patients with advanced-stage ovarian cancer and found that increasing distance from a HVH was an independent predictor of receiving non-guideline treatment, while increasing patient travel distance to receive care was protective [11]. While both adherence to NCCN treatment guidelines and care at a HVH have been previously correlated with improved ovarian cancer survival, the interaction between these survival determinants and geographic location has not been examined [2–5]. The objective of the current study, therefore, was to expand upon our initial work to determine the impact of geographic location on advanced-stage ovarian cancer mortality in relation to adherence treatment guidelines and average annual case volume of the hospital where care was received.
METHODS
Study Design
The study design was a retrospective population-based analysis of the effect of geographic variation on advanced-stage invasive epithelial ovarian cancer mortality for cases reported to the California Cancer Registry using generalized additive models (GAMs), with simultaneous smoothing of location and adjustment for known confounders [12, 13]. The study received exempt status by the Institutional Review Board of the University of California, Irvine (HS#2011-8317). Registry case reporting is estimated to be 99% for the entire state of California, with follow-up completion rates exceeding 95% [14]. International Classification of Disease Codes for Oncology based on World Health Organization’s criteria was used for tumor location and histology. Cases were identified using ovarian Surveillance, Epidemiology, and End Results (SEER) primary site code (C569).
Sample Population
The initial study population included women who were age ≥18 years at diagnosis of a first or only invasive epithelial ovarian cancer. A total of 21,044 incident cases were identified during the time period 1/1/96–12/31/06. We sequentially excluded: 101 borderline tumors, 165 of non-epithelial histology, 246 cases that had missing ICD-O-2 morphology code, 742 cases prepared from autopsy or death certificate only, 1,415 with incomplete clinical information, 78 with incomplete hospital information or location outside of California, and 98 with missing census tract information. In all, 2,845 cases were excluded. Among the remaining 18,199 cases of all stages, 11,765 patients diagnosed with International Federation of Gynecology and Obstetrics (FIGO) stage IIIC/IV disease were selected as the study population and represents a subset of a prior analyses investigating predictors of access to high-volume providers and the impact of geographic location on adherence to treatment guidelines [5, 11].
Statistical Analysis
The primary analysis was the effect of geographic variation on disease-specific mortality for stage IIIC/IV epithelial ovarian cancer. We examined geographic variation of ovarian cancer mortality by smoothing location while controlling for known individual-level risk factors using a generalized additive model (GAM) framework [13, 14]. The GAM estimates the effect of location on the log-hazard function for mortality throughout California by applying a bivariate smooth of the latitude and longitude of each subject’s location, represented by the centroid of the address census block.
The first model, GAM-1, included age at diagnosis as a continuous variable, tumor characteristics (FIGO stage, grade, histology and tumor size), insurance type, race, and SES. Insurance type was grouped into 6 categories: Managed Care (managed care, HMO, PPO, other private insurance), Medicare, Medicaid, Other Insurance (military, county-funded), Not Insured (self-pay), and Unknown. SES was classified according to increasing quintile of Yost score: lowest (SES-1), low-middle (SES-2), middle (SES-3), high-middle (SES-4) and highest (SES-5) [14]. The Yost score is an index of SES level based on a principal components analysis of variables at the census block group-level and includes education, household income, proportion below 200% poverty level, house value, rent, percent employed, and percent with blue-collar employment [15]. In addition, we included variables for distance between patients and the hospital where they sought treatment as well as distance to the closest HVH. Hospital volume was calculated based on the average annual number of all ovarian cancer cases (stages I-IV) that were admitted to that hospital. Hospitals with ≥20 cases per year were classified as HVH, while hospitals treating <20 cases per year were considered low-volume (LVH) [6–9]. Distances were calculated using ArcMap (version 10.0, ESRI; Redlands, CA) and categorized by quintiles: distance to care (<5km/3mi; 5–9km/3–5mi; 10–16km/6–9mi; 17–31km/10–19mi; ≥32km/20mi) and distance to closest HVH (<9km/5mi; 9–17km/5–10mi; 18–33km/11–20mi; 34–79km/21–49mi;≥80km/50mi).
The second model, GAM-2, was identical to GAM-1 but introduced additional variables for whether the hospital where treatment was received was a HVH or a LVH and whether that treatment was adherent or non-adherent to NCCN guidelines for advanced-stage ovarian cancer. Adherence to guidelines was based on recommendations for surgery and chemotherapy according to the time period of diagnosis [16–20]. A minimum of oophorectomy (with or without hysterectomy) and omentectomy was considered adherent surgical care, and either initial surgery or chemotherapy was characterized as appropriate. Administration of multi-agent chemotherapy was characterized as adherent care. Dichotomous variables, adherence or non-adherence, were created for the overall treatment program.
We used a locally weighted regression smoother (loess) for the effect of location in the Cox model [21]. GAM estimation for the bivariate smoother corresponding to location was carried out via backfitting on the linear predictor from the Cox model, using a smoothed estimate of the Fisher information matrix. The number of data points used for smoothing was determined by minimizing Akaike’s Information Criterion (AIC). We generated an evenly-spaced grid of prediction points approximately 5km apart that extended across the latitude and longitude coordinates of participants’ locations throughout California, resulting in in a grid of over 7,500 points. We did not predict for areas with sparse population data [22]. At each point on the grid we calculated the log hazard multiplier and hazard ratio using the average log hazard for the study area as the reference. Without the bivariate smooth term for location, the model reduces to a standard Cox proportional hazards regression model.
GAMs also provide a useful framework for hypothesis testing [23]. We implemented a permutation test of the null hypothesis that ovarian cancer survival does not depend on the geographic location of participants, adjusting for other risk factors. Residential locations were permuted 999 times while preserving participants’ outcome status and covariates. For each permutation, the Cox model, including a smoothed effect of location, was refit and a global deviance statistic was computed by taking the difference of the deviances of the Cox model with and without the location term. Spatial analyses were conducted in the R Package (version 2.12.02; Vienna Austria) using the MapGAM package.
RESULTS
Population Characteristics
The median age at diagnosis for the 11,765 subjects was 65.0 years (mean=63.8 years, range=18–104 years), and 7,216 patients (61.3%) had stage IIIC disease (Table 1). Overall, 5,343 patients (45.4%) were treated according to NCCN guidelines (Figure 1). A total of 378 hospitals provided care to the study population (Figure 2). Of these, 12 hospitals (3.2%) were HVHs (2,112 patients, 17.9% of cases), while 366 hospitals were LVHs (9,653 patients, 82.0% of cases). For patients receiving care at a HVH, the median driving distance was 20.4km/12.7mi, with 80% of patients driving a distance of ≤56.2km/34.9mi. For patients treated at a LVH, the median driving distance was 11.4km/7.1mi, and 80% of patients travelled ≤28.3km/17.6i to receive care. For all patients, the median Euclidean distance to a HVH was 22.7km/14.1mi, with 80% of patients living within 79.6km/49.5mi of a HVH.
Table 1.
Study population characteristics.
| Characteristic | N | Percent |
|---|---|---|
| Total | 11,765 | 100.0 |
| Age at diagnosis | ||
| <45 years | 1,035 | 8.8 |
| 45–54 years | 2,062 | 17.5 |
| 55–69 years | 4,179 | 35.5 |
| ≥70 years | 4,489 | 38.2 |
| Race/ethnicity | ||
| White | 8,432 | 71.7 |
| Black | 556 | 4.7 |
| Asian/Pacific Islander | 1,803 | 15.3 |
| Hispanic | 974 | 8.3 |
| Insurance | ||
| Managed care | 5,272 | 44.8 |
| Medicare | 3,798 | 32.3 |
| Medicaid | 941 | 8.0 |
| Other insurance | 1,109 | 9.4 |
| Not insured | 318 | 2.7 |
| Unknown | 327 | 2.8 |
| Socioeconomic status | ||
| Lowest (SES-1) | 1,528 | 13.0 |
| Low-middle (SES-2) | 2,137 | 18.2 |
| Middle (SES-3) | 2,481 | 21.1 |
| High-middle (SES-4) | 2,751 | 23.4 |
| Highest (SES-5) | 2,868 | 24.4 |
| Tumor stage | ||
| Stage IIIC | 7,216 | 61.3 |
| Stage IV | 4,549 | 38.7 |
| Tumor grade | ||
| Grade 1 | 344 | 2.9 |
| Grade 2 | 1,562 | 13.3 |
| Grade 3 | 4,992 | 42.4 |
| Grade 4 | 1,239 | 10.5 |
| Unknown | 3,628 | 30.9 |
| Tumor histology | ||
| Serous | 5,740 | 48.8 |
| Mucinous | 415 | 3.5 |
| Endometrioid | 638 | 5.4 |
| Clear cell | 321 | 2.7 |
| Adenocarcinoma, NOS | 1,969 | 16.7 |
| Tumor size | ||
| <5cm | 1,274 | 10.8 |
| 5–10cm | 2,114 | 18.0 |
| ≥10cm | 2,000 | 17.0 |
| Unknown | 6,377 | 54.2 |
| Hospital volume | ||
| High-volume | 2,112 | 18.0 |
| Low-volume | 9,653 | 82.0 |
| NCCN treatment guideline adherence | ||
| Adherent | 5,342 | 45.4 |
| Non-adherent | 6,423 | 54.6 |
NOS: not otherwise specified; NCCN: National Comprehensive Cancer Network
Figure 1.

(A) Geographic distribution of 11,765 cases of stage IIIC/IV epithelial ovarian cancer stratified by adherence and non-adherence to NCCN treatment guidelines for advanced-stage ovarian cancer.
Figure 2.
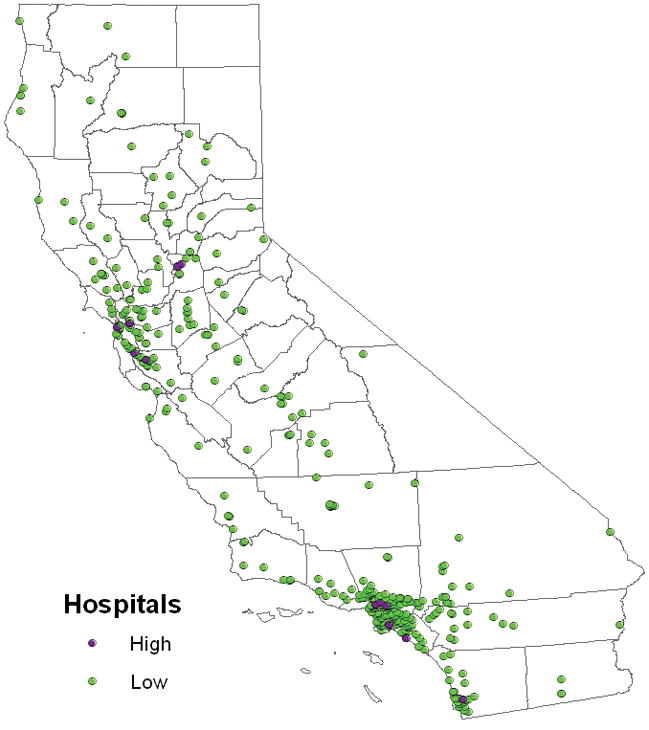
Geographic distribution of hospitals stratified by high-volume (n=12) and low-volume (n=366) hospital.
Spatial Analysis of Advanced-Stage Ovarian Cancer Mortality
In GAM-1, the initial iteration of the spatial analysis reflects the effect of geographic location on ovarian cancer mortality without adjusting for the effects of other variables and shows the hazard ratio at each location using the average log hazard for the entire state as the reference (Figure 3A: map hazard ratio [HR] range=0.73–1.25, p<0.001). The impact of geographic distribution on ovarian cancer mortality was affected as additional variables were introduced into the model in a stepwise fashion: age at diagnosis, tumor stage, tumor histology, and tumor grade (Figure 3B: map HR range=0.81–1.23, p<0.001); race/ethnicity (Figure 3C: map HR range=0.80–1.30, p<0.001); insurance status (Figure 3D: map HR range=0.80–1.34, p<0.001); socioeconomic status (Figure 3E: map HR range=0.86–1.44, p<0.001); distance to receive care (Figure 3F: map HR range=0.85–1.48, p<0.001), and distance to the closest HVH (Figure 3G: map HR range=0.85–1.48, p<0.001). The global test for location was highly significant for all analyses (p<0.001), indicating that ovarian cancer mortality was significantly associated with the geographic location of subjects. In GAM-1, after controlling for disease-related characteristics, the model showed that distance to receive care 17–31km/10–19mi (HR=0.87, 95%CI=0.81–0.94) and ≥32km/20mi (HR=0.86, 95%CI=0.79–0.93) were significantly protective against ovarian cancer mortality, while distance from a HVH ≥80km/50mi was associated with an increased risk of death (HR=1.13, 95%CI=1.03–1.23) (Table 2).
Figure 3.
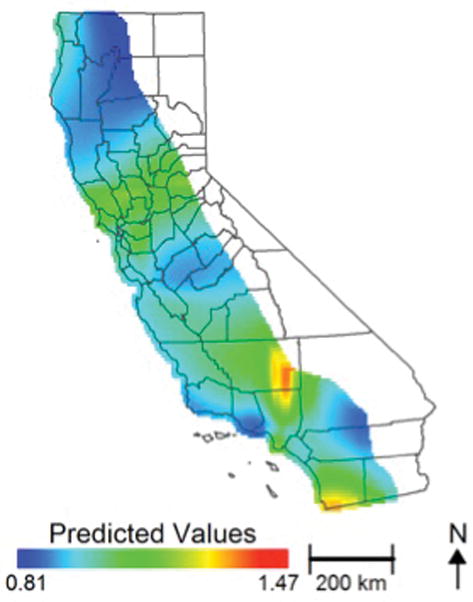
Effect of geographic location on risk of ovarian cancer mortality among patients with stage IIIC/IV disease (n=11,765): Figure 3A: the initial iteration of the spatial analysis shows the hazard ratio using the average log hazard for the study area as the reference without adjusting for the effects of other variables (Figure 3A); adjusted for stage at diagnosis, tumor stage, tumor histology, and tumor grade (Figure 3B); with additional adjustment for race/ethnicity (Figure 3C), insurance status (Figure 3D), socioeconomic status (Figure 3E), distance to receive care (Figure 3F), distance to the closest HVH (Figure 3G), and annual hospital ovarian cancer case volume and treatment adherence/non-adherence to NCCN guidelines (Figure 3H).
Table 2.
Generalized additive models (GAM) of the effect of geographic location on ovarian cancer mortality; GAM-1 unadjusted for adherence to NCCN guidelines and treating hospital ovarian cancer case volume; GAM-2 adjusted for adherence to NCCN guidelines and treating hospital ovarian cancer case volume.
| GAM-1 | GAM-2 | |||
|---|---|---|---|---|
| Characteristic | HR | 95%CI | HR | 95%CI |
| Age at diagnosis | 1.02 | 1.02–1.03 | 1.02 | 1.02–1.03 |
| Race/ethnicity | ||||
| White | 1.00 | 1.00 | ||
| Black | 1.20 | 1.06–1.36 | 1.18 | 1.04–1.34 |
| Asian/Pacific Islander | 0.93 | 0.85–1.02 | 0.93 | 0.85–1.01 |
| Hispanic | 0.92 | 0.86–0.99 | 0.92 | 0.85–1.01 |
| Socioeconomic status | ||||
| Lowest (SES-1) | 1.25 | 1.14–1.38 | 1.23 | 1.11–1.35 |
| Low-middle (SES-2) | 1.19 | 1.10–1.30 | 1.18 | 1.08–1.28 |
| Middle (SES–3) | 1.16 | 1.07–1.25 | 1.13 | 1.05–1.22 |
| High-middle (SES-4) | 1.09 | 1.02–1.17 | 1.08 | 1.00–1.16 |
| Highest (SES-5) | 1.00 | 1.00 | ||
| Insurance status | ||||
| Managed care | 1.00 | 1.00 | ||
| Medicare | 1.00 | 0.94–1.07 | 0.99 | 0.93–1.06 |
| Medicaid | 1.05 | 0.95–1.15 | 1.05 | 0.95–1.14 |
| Other | 0.96 | 0.88–1.19 | 0.94 | 0.86–1.02 |
| Uninsured | 1.03 | 0.89–1.19 | 1.05 | 0.91–1.22 |
| Unknown | 1.06 | 0.91–1.24 | 1.07 | 0.91–1.25 |
| Tumor stage | ||||
| Stage IIIC | 1.00 | 1.00 | ||
| Stage IV | 1.54 | 1.46–1.62 | 1.52 | 1.44 |
| Tumor grade | ||||
| Grade 1 | 0.61 | 0.53–0.69 | 0.59 | 0.52–0.67 |
| Grade 2 | 0.91 | 0.84–0.98 | 0.89 | 0.82–0.96 |
| Grade 3 | 1.00 | 1.00 | ||
| Grade 4 | 1.04 | 0.95–1.12 | 1.05 | 0.96–1.14 |
| Unknown | 1.33 | 1.25–1.42 | 1.28 | 1.20–1.37 |
| Tumor histology | ||||
| Serous | 1.00 | 1.00 | ||
| Mucinous | 1.58 | 1.38–1.82 | 1.53 | 1.33–1.76 |
| Endometrioid | 0.89 | 0.80–0.98 | 0.87 | 0.79–0.97 |
| Clear cell | 1.42 | 1.22–1.65 | 1.42 | 1.21–1.66 |
| Adenocarcinoma, NOS | 1.51 | 1.39–1.63 | 1.44 | 1.33–1.56 |
| Distance to care | ||||
| <5km/3mi | 1.00 | 1.00 | ||
| 5–9km/3–5mi | 0.91 | 0.84–0.98 | 0.91 | 0.84–0.98 |
| 10–16km/6–9mi | 0.94 | 0.87–1.02 | 0.95 | 0.88–1.03 |
| 17–31km/10–19mi | 0.87 | 0.81–0.94 | 0.89 | 0.82–0.97 |
| ≥32km/20mi | 0.86 | 0.79–0.93 | 0.92 | 0.84–1.00 |
| Distance to a HVH | ||||
| <9km/5mi | 1.00 | 1.00 | ||
| 9–17km/5–10mi | 1.02 | 0.94–1.10 | 0.98 | 0.91–1.06 |
| 18–33km/11–20mi | 1.07 | 0.99–1.16 | 1.02 | 0.94–1.03 |
| 34–79km/21–49mi | 1.00 | 0.92–1.08 | 0.94 | 0.86–1.02 |
| ≥80km/50mi | 1.13 | 1.03–1.23 | 1.03 | 0.94–1.14 |
| Adherence to NCCN guidelines | ||||
| Adherent | - | 1.00 | ||
| Non-adherent | - | - | 1.25 | 1.18–1.32 |
| Treating hospital volume | ||||
| LVH | - | 1.00 | ||
| HVH | - | - | 0.87 | 0.81–0.93 |
HR: hazard ratio; CI: confidence interval; NOS: not otherwise specified; NCCN: National Comprehensive Cancer Network; LVH: low-volume hospital; HVH: high-volume hospital
In the final iteration of the model, GAM-2, variables for the annual ovarian cancer case volume of the treating hospital and treatment adherence/non-adherence to NCCN guidelines were introduced (Figure 3H: map HR range=0.80–1.40, p<0.001, supplemental material Figure 3-video). Treatment at a HVH was significantly protective against ovarian cancer mortality (HR=0.87, 95%CI=0.81–0.93), while treatment non-adherence to NCCN guidelines was an independent risk factor for an increased risk of death (HR=1.25, 95%CI=1.18–1.32) (Table 2). In the final model, distance to care and proximity to a HVH were no longer significantly associated with ovarian cancer mortality after adjusting for treating hospital volume and treatment adherence to NCCN guidelines. Among demographic characteristics, Black race (HR=1.18, 95%CI=1.11–1.35) was negatively associated with ovarian cancer mortality. There was also a statistically significant and independent inverse linear relationship between SES and ovarian cancer mortality after adjusting for other variables, ranging from a HR=1.00 for SES-5 (highest SES and referent group) to a HR=1.23 for SES-1 (lowest SES) (Table 2). Increasing age, stage IV disease, and atypical tumor histology were also significantly associated with ovarian cancer mortality.
COMMENT
Regional differences in health services for ovarian cancer have been described for both surgery and chemotherapy [11, 24–26]. While reducing regional variation in the quality of care has been proposed as a mechanism to improve ovarian cancer outcomes, there is very limited data examining the relationship between geographic location and survival [27, 28]. In Canada, Dehaeck et al. reported a population-based study of 854 ovarian cancer patients within five health authority regions in the province of British Columbia demonstrating geographic variation in practice patterns in the context of a single-payer, publicly funded health care system [29]. Significant differences were observed across provincial regions for access to a gynecologic oncologist, the rate of optimal debulking, and administration of combination chemotherapy. There was no significant effect for geography (health authority region) on survival, however, after adjusting for treatment-related factors. In Spain, Lope and coworkers examined the spatial distribution of ovarian cancer mortality across municipalities, but this study was focused on environmental and occupational exposures rather than treatment differences [30]. In the U.S., Fairfield and coworkers studied 4,589 patients from the SEER database (1998–2002) and found that hospital referral region, defined as a health care market for specialized consultative care, was significantly associated with all-cause mortality; however, after adjusting for cancer-directed surgery, that correlation was no longer significant [28].
The current study improves upon the work of previous investigators and advances the existing knowledge base in several respects. In contrast to earlier work that employed relatively broad measures of geography (e.g. health authority region, hospital referral region), the current analysis utilized the centroid of the address census block as a more precise approximation of patient location in GAM analyses to estimate ovarian cancer mortality throughout California based on a grid of over 7,500 geographic prediction points. In this framework, the global test for location was statistically significant in all iterations of the GAM, indicating that geographic location is indeed an important predictor of advanced-stage ovarian cancer mortality. The current study also utilized a composite ovarian cancer quality of care process measure that has been previously validated as correlating with survival, adherence to NCCN treatment guidelines, rather than individual treatment components [2–4]. Notably, the geographic variables associated with either proximity to expert care (distance ≥80km/50mi from a HVH) and an ability/willingness to travel longer distances for treatment (distance to receive care ≥32km/20mi), were independent and statistically significant predictors of ovarian cancer mortality in GAM-1. However, after adjusting for treatment adherence/non-adherence to NCCN guidelines and hospital ovarian cancer case volume in GAM-2, these geographic factors were no longer significantly associated with the risk of death. Although the focus of this work was not socio-demographic disparities in ovarian cancer survival, the current data confirm the findings of previous investigators that Black race and low SES are associated with an increased risk of disease-related death after adjusting for geographic location, disease-related characteristics, hospital case volume, and treatment guideline adherence [2, 9, 31–35]. In our prior work examining the effect of geographic location of treatment guideline adherence using a similar study population, low SES was associated with an increased risk of residing ≥80km/50mi from a HVH, while racial/ethnic minorities were less likely to travel ≥32km/20mi to receive care compared to Whites [11]. Whether additional, unexamined geographic barriers to care contribute to the observed survival disparities is unknown [11, 24, 26, 28].
Strengths of the current study include the proven reliability of the California Cancer Registry, the large study population size, and examination of a time period during which no major treatment paradigm shifts occurred. There are also several limitations that must be considered. First, the retrospective study design and population-based data set are accompanied by an inherent potential for reporting and selection bias. Second, important variables, such as the presence of medical comorbidities, the extent of initial disease, and the amount of residual disease, are not captured by the CCR. As a result, we were unable to control for these potentially confounding variables that could influence ovarian cancer mortality. A third potential limitation is that the current dataset utilized de-identified patient data, such that the census block of residence for each subject was used rather than the exact latitude and longitude of patient residence. It is possible that the results could be affected by more precise reference points for geographic location, although it is not possible to predict in which direction the observed associations might migrate. A fourth potential limitation is that demographic composition of California is relatively unique, where racial minorities now comprise a majority of the state population [36, 37]. As a result, the generalizability of our results to the broader U.S. population cannot be determined.
Despite these limitations, two salient conclusions can be drawn from the current study that are relevant to patients as well as health care administrators and policy makers. First, the observed data indicate that geographic location, as a stand-alone variable, is a significant predictor of advanced-stage ovarian cancer mortality. Second, and perhaps more importantly, the identified geographic variables associated with ovarian cancer death, distance to receive care and proximity to a HVH, were largely irrelevant after adjusting for adherence to NCCN guideline care and treatment at a HVH. These data clearly suggest that access to appropriate treatment is the dominant factor predicting ovarian cancer mortality and that additional efforts are needed to ensure that all women with ovarian cancer are afforded the same standard of care, regardless of where they reside.
Supplementary Material
effect of geographic location on advanced-stage ovarian cancer mortality adjusted for the effects of other variables.
Acknowledgments
Dr. Bristow was supported in part by an unrestricted research grant from the Queen of Hearts Foundation. Dr. Vieira was supported by the Superfund Research Program (NIEHS 2P42ES007381-18). Research reported in this publication was supported by the National Cancer Institute of the National Institutes of Health under award number P30CA062203.
Footnotes
The authors report no conflict of interest.
Presented at the American Public Health Association 142nd Annual Meeting and Exposition, New Orleans, November 15-19, 2014.
The content is solely the responsibility of the authors and does not necessarily represent the official views of the National Institutes of Health.
References
- 1.Siegel R, Ma J, Zou Z, Jemal A. Cancer statistics 2014. CA Cancer J Clin. 2014;64 (1):9–29. doi: 10.3322/caac.21208. [DOI] [PubMed] [Google Scholar]
- 2.Bristow RE, Powell MA, Al-Hammadi N, Chen L, Miller JP, Roland PY, et al. Disparities in ovarian cancer care quality and survival according to race and socioeconomic status. J Natl Cancer Inst. 2013;105(11):823–32. doi: 10.1093/jnci/djt065. [DOI] [PMC free article] [PubMed] [Google Scholar]
- 3.Bristow RE, Chang J, Ziogas A, Anton-Culver H. Adherence to treatment guidelines for ovarian cancer as a measure of quality care. Obstet Gynecol. 2013;121(6):1226–34. doi: 10.1097/AOG.0b013e3182922a17. [DOI] [PubMed] [Google Scholar]
- 4.Erickson BK, Martin JY, Shah MM, Straughn JM, Leath CA. Reasons for failure to deliver National Comprehensive Cancer Network (NCCN)-adherent care in the treatment of epithelial ovarian cancer at an NCCN cancer center. Gynecol Oncol. 2014;133(2):142–46. doi: 10.1016/j.ygyno.2014.02.006. [DOI] [PMC free article] [PubMed] [Google Scholar]
- 5.Bristow RE, Chang J, Ziogas A, et al. High-volume ovarian cancer care: survival impact and disparities in access for advanced-stage disease. Gynecol Oncol. 2014;132(2):403–10. doi: 10.1016/j.ygyno.2013.12.017. [DOI] [PubMed] [Google Scholar]
- 6.Goff BA, Matthews BJ, Wynn M, Muntz HG, Lishner DM, Baldwin LM. Ovarian cancer: patterns of surgical care across the United States. Gynecol Oncol. 2006;103(2):383–90. doi: 10.1016/j.ygyno.2006.08.010. [DOI] [PubMed] [Google Scholar]
- 7.Goff BA, Matthews BJ, Larson EH, Andrilla CH, Wynn M, Lishner DM, et al. Predictors of comprehensive surgical treatment in patients with ovarian cancer. Cancer. 2007;109(10):2031–42. doi: 10.1002/cncr.22604. [DOI] [PubMed] [Google Scholar]
- 8.Bristow RE, Zahurak ML, Diaz-Montes TP, Giuntoli RL, Armstrong DK. Impact of surgeon and hospital ovarian cancer surgical case volume on in-hospital mortality and related short-term outcomes. Gynecol Oncol. 2009;115(3):334–38. doi: 10.1016/j.ygyno.2009.08.025. [DOI] [PubMed] [Google Scholar]
- 9.Bristow RE, Palis BE, Chi DS, Cliby WA. The National Cancer Database on advanced-stage epithelial ovarian cancer: impact of hospital surgical case volume on overall survival and surgical treatment paradigm. Gynecol Oncol. 2010;118(3):262–67. doi: 10.1016/j.ygyno.2010.05.025. [DOI] [PubMed] [Google Scholar]
- 10.Cooper RA, Cooper MA, McGinley EL, Fax X, Rosenthal JT. Poverty, wealth, and health care utilization; a geographic assessment. J Urban Health. 2012 Oct;89(5):828–47. doi: 10.1007/s11524-0412-9689-3. [DOI] [PMC free article] [PubMed] [Google Scholar]
- 11.Bristow RE, Chang J, Ziogas A, Anton-Culver H, Vieira VM. Spatial analysis of adherence to treatment guidelines for advanced-stage ovarian cancer and the impact of race and socioeconomic status. Gynecol Oncol. 2014;134(1):60–7. doi: 10.1016/j.ygyno.2014.03.561. [DOI] [PMC free article] [PubMed] [Google Scholar]
- 12.Vieira V, Webster T, Weinberg J, Aschengrau A, Ozonoff D. Spatial Analysis of lung, colorectal, and breast cancer on Cape Cod: An application of generalized additive models to case-control data. Environmental Health: A Global Access Science Source. 2005 Jun 14;4:11. doi: 10.1186/1476-069X-4-11. [DOI] [PMC free article] [PubMed] [Google Scholar]
- 13.Webster T, Vieira V, Weinberg J, Aschengrau A. Method for mapping population-based case-control studies: an application using generalized additive models. International Journal of Health Geographics. 2006 Jun;5:26. doi: 10.1186/1476-072X-5-26. [DOI] [PMC free article] [PubMed] [Google Scholar]
- 14.Parikh-Patel A, Allen M, Wright WE. Validation of self-reported cancers in the California Teachers Study. Am J Epidemiol. 2003;157(6):539–45. doi: 10.1093/aje/kwg006. [DOI] [PubMed] [Google Scholar]
- 15.Yost K, Perkins C, Cohen R, Morris C, Wright W. Socioeconomic status and breast cancer incidence in California for different race/ethnic groups. Cancer Causes Control. 2001;12(8):703–11. doi: 10.1023/a:1011240019516. [DOI] [PubMed] [Google Scholar]
- 16.Morgan RJ, Copeland L, Gershenson D, Locker G, McIntosh D, Ozols R, et al. Update of the NCCN ovarian cancer practice guidelines. Oncology. 1997 Nov;11:95–105. [PubMed] [Google Scholar]
- 17.Morgan R, Alvarez RD, Armstrong DK, Copeland L, Fiorica J, Fishman DA, et al. NCCN practice guidelines for ovarian cancer. Version 2000. National Comprehensive Cancer Network; 2000. [Google Scholar]
- 18.Morgan R, Alvarez RD, Armstrong DK, Copeland L, Fiorica J, Fishman DA, et al. Ovarian cancer guideline. Version 1.2002. National Comprehensive Cancer Network; 2002. [Google Scholar]
- 19.Morgan R, Alvarez RD, Armstrong DK, Chen LM, Copeland L, Dupont J, et al. Ovarian cancer. Version 1.2003. National Comprehensive Cancer Network; 2003. [Google Scholar]
- 20.Morgan R, Alvarez RD, Armstrong DK, Chen LM, Copeland L, Fiorica J, et al. Ovarian cancer. Version 1.2005. National Comprehensive Cancer Network; 2005. [DOI] [PubMed] [Google Scholar]
- 21.Hastie T, Tibshirani R. Generalized Additive Models. New York: Chapman and Hall; 1990. [DOI] [PubMed] [Google Scholar]
- 22.Vieira VM, Hart JE, Webster TF, Weinberg J, Puett R, Laden F, et al. Association between Residences in U.S. Northern Latitudes and Rheumatoid Arthritis: A Spatial Analysis of the Nurses' Health Study. Environ Health Perspect. 2010;118(7):957–61. doi: 10.1289/ehp.0901861. [DOI] [PMC free article] [PubMed] [Google Scholar]
- 23.Bliss RL, Weinberg J, Vieira VM, et al. Adjusted significance cutoffs for hypothesis tests applied with generalized additive models with bivariate smoothers. Spatial and Spatio-temporal Epidemiology. 2011;2(4):291–300. doi: 10.1016/j.sste.2011.09.001. [DOI] [PMC free article] [PubMed] [Google Scholar]
- 24.Polsky D, Armstrong KA, Randall TC, Ross RN, Even-Shoshan O, Rosenbaum PR, et al. Variation in chemotherapy utilization in ovarian cancer: the relative contribution of geography. Health Services Res. 2006;41(6):2201–18. doi: 10.1111/j.1475-6773.2006.00596.x. [DOI] [PMC free article] [PubMed] [Google Scholar]
- 25.Thrall MM, Gray HJ, Symons RG, Weiss NS, Flum DR, Goff BA. Trends in treatment of advanced epithelial ovarian cancer in the Medicare population. Gynecol Oncol. 2011;122(1):100–6. doi: 10.1016/j.ygyno.2011.03.022. [DOI] [PMC free article] [PubMed] [Google Scholar]
- 26.Ulanday KT, Ward KK, Macera CA, Ji M, Plaxe SC. Regional variation in surgical assessment of lymph nodes for staging among women with early-stage epithelial ovarian cancer. Gynecol Oncol. 2014;132(2):411–15. doi: 10.1016/j.ygyno.2013.11.009. [DOI] [PubMed] [Google Scholar]
- 27.Patterson CC, Kee F. Geographic variations and recent trends in cancer mortality in Northern Ireland. Ulster Med J. 1991;60(2):137–49. [PMC free article] [PubMed] [Google Scholar]
- 28.Fairfield KM, Lucas FL, Earle CC, Small L, Trimble EL, Warren JL. Regional variation in cancer-directed surgery and mortality among women with epithelial ovarian cancer in the Medicare population. Cancer. 2010;116(20):4840–48. doi: 10.1002/cncr.25242. [DOI] [PubMed] [Google Scholar]
- 29.Dehaeck U, McGahan CE, Santos JL, Carey MS, Swenerton KD, Kwon JS. The impact of geographic variation in treatment on outcomes in ovarian cancer. Int J Gynecol Cancer. 2013;23(2):282–87. doi: 10.1097/IGC.0b013e31827b87b1. [DOI] [PubMed] [Google Scholar]
- 30.Lope V, Pollan M, Perez-Gomez B, Aragones N, Vidal E, Gomez-Barroso D, et al. Municipal distribution of ovarian cancer mortality in Spain. BMC Cancer. 2008 Sep 12;8:258. doi: 10.1186/1471-2407-8-258. [DOI] [PMC free article] [PubMed] [Google Scholar]
- 31.Harlan LC, Greene AL, Clegg LX, Mooney M, Stevens JL, Brown ML. Insurance status and the use for guideline therapy in the treatment of selected cancers. J Clin Oncol. 2005;23(36):9079–88. doi: 10.1200/JCO.2004.00.1297. [DOI] [PubMed] [Google Scholar]
- 32.Harlan LC, Clegg LX, Trimble EL. Trends in surgery and chemotherapy for women diagnosed with ovarian cancer in the United States. J Clin Oncol. 2003;21(18):3488–94. doi: 10.1200/JCO.2003.01.061. [DOI] [PubMed] [Google Scholar]
- 33.Parham G, Phillips JL, Hicks ML, et al. The National Cancer Data Base report on malignant epithelial ovarian carcinoma in African-American women. Cancer. 1997;80(4):816–26. [PubMed] [Google Scholar]
- 34.Barnholtz-Sloan JS, Talnsky MA, Abrams J, Severson RK, Quereshi F, Jacques SM, et al. Ethnic differences in survival among women with ovarian carcinoma. Cancer. 2002;94(6):1886–93. doi: 10.1002/cncr.10415. [DOI] [PubMed] [Google Scholar]
- 35.Terplan M, Schluterman N, McNamara EJ, Tracy JK, Temkin SM. Have racial disparities in ovarian cancer increased over time? An analysis of SEER data. Gynecol Oncol. 2012;125(1):19–24. doi: 10.1016/j.ygyno.2011.11.025. [DOI] [PubMed] [Google Scholar]
- 36.U.S. Department of Commerce. United States Census Bureau. Newsroom. [cited 2014 Jan 21]. Available from: http://www.census.gov/newsroom/releases/archives/population/cb08-123.html.
- 37.Center for American Progress. Toward 2050 in California. [cited 2014 Jan 21]. Available from: http://www.americanprogress.org/issues/race/report/2012/03/26/11327/toward-2050-in-california/
Associated Data
This section collects any data citations, data availability statements, or supplementary materials included in this article.
Supplementary Materials
effect of geographic location on advanced-stage ovarian cancer mortality adjusted for the effects of other variables.