Abstract
Background
Myocardial fat deposition (FAT-DEP) has been frequently observed in regions of chronic myocardial infarction in patients with ischemic cardiomyopathy (ICM). The role of FAT-DEP within scar-related ventricular tachycardia (VT) circuits has not been investigated.
Objective
This pilot study aimed to assess the impact of myocardial FAT-DEP on local electrograms and VT circuits in patients with ICM.
Methods
Contrast-enhanced computed tomography (CE-CT) was performed in 22 patients with ischemic VT. Electroanatomic map (EAM) points were registered to corresponding CE-CT images. Myocardial FAT-DEP were identified and characterized using a post-processing image overlay that highlighted areas below 0 Hounsfield units (HU). The mean attenuation of local myocardial regions corresponding to sampled electrograms was measured on short axis images. The associations of mean attenuation with bipolar and unipolar amplitudes, left ventricular (LV) wall thickness and VT circuit sites were investigated.
Results
Of 1801 EAM points, 519 (28.8%) were located in regions with FAT-DEP. Significant differences were observed in mean intensity (23.2±35.6 vs. 81.7±21.9 HU, P<0.001), bipolar (0.75±0.83 vs 2.9±2.4 mV, P<0.001) and unipolar (3.1±1.7 vs. 7.4±4.3 mV, P<0.001) amplitudes and LV wall thickness (5.2±1.7 vs. 8.2±2.5 mm, P<0.001) between regions with and without FAT-DEP. Lower HU was strongly associated with lower bipolar and unipolar amplitude (P<0.0001, respectively). Importantly, FAT-DEP was associated with critical VT circuit sites with fractionated or isolated potentials.
Conclusions
FAT-DEP was associated with electrogram features and VT circuit sites. Further work will be needed to determine whether FAT-DEP plays a causal role in the generation of ischemic scar-related VT circuits.
Keywords: ventricular tachycaridia, ischemic cardiomyopathy, fat, computed tomography, magnetic resonance imaging
Introduction
Myocardial fat deposition (FAT-DEP) or lipomatous metaplasia has been frequently observed in regions of chronic myocardial infarction in patients with ischemic cardiomyopathy (ICM).1–7 Baroldi et al. have shown that myocardial regions with FAT-DEP co-exist with areas of fibrosis that form the substrate of life threatening reentrant ventricular tachycardia (VT).1,2 Similar to FAT-DEP, ischemic scar-related VTs occur more often late after the onset of myocardial infarction. Previous reports have shown the association of ischemic scar on late-gadolinium enhanced cardiac magnetic resonance (LGE-CMR) with local electrogram characteristics such as bipolar and unipolar voltage, electrogram duration and fractionated or isolated potentials.8,9 Critical VT circuit sites associate closely with conducting channels within scar identified on LGE-CMR. In a recent study, Pouliopoulos et al have demonstrated that increased intramyocardial adipose tissue in sheep is significantly associated with altered electrophysiological properties such as slower conduction velocity and lower electrogram amplitude, and has an impact on scar-related VT circuits.10 Computed tomography (CT) offers higher spatial resolution and can identify fat tissue based on CT attenuation density values (Hounsfield units, HU).3–6 In addition, contrast-enhanced computed tomography (CE-CT) can accurately define anatomical structures including chamber boundaries and coronary arteries, which can be integrated into electroanatomic mapping (EAM) systems. The limitations of CT include ionizing radiation, and lower contrast to noise ratio. However, recent technologic advances with multi-detector scanners have mitigated both of these issues. This pilot study aimed to a) quantitatively examine the association of FAT-DEP on CE-CT with local electrogram characteristics and b) define the association of FAT-DEP with reentrant VT circuits in patients with ICM.
Methods
Study patients
The Institutional Review Board of Johns Hopkins University approved the retrospective study protocol. All patients had provided written informed consent. The study included 22 ICM patients (66±9 years, 21 males).who had CE-CT before catheter ablation of scar-related VTs and 20 ICM patients (70±8 years, 16 males) without a history of VTs as an age-matched control group. CE-CT was performed for 3D anatomical guidance during VT ablation (22 patients) or assessment of coronary artery stenosis (20 patients). Of 22 patients with ischemic scar-related VTs, 19 patients had implantable cardioverter defibrillator (ICD) or biventricular ICD systems. A subset of 10 patients underwent both LGE-MRI and CE-CT examinations.
Cardiac CT Examinations
All CE-CT examinations were performed on a 320 detector-row CT scanner (Aquilion One, Toshiba, Medical Systems, Otawara, Japan). Iodinated contrast was injected intravenously. The scan parameters were as follows:, 320×0.5 mm collimation, 500 ms rotation time, temporal resolution 125–250 milliseconds, 100–120 kV, and 350–500mAs. The image data were reformatted into short axis images with 8mm slice thickness, to match the LGE-CMR slice thickness.
CMR studies
CMR examinations were performed with a 1.5T CMR scanner (Avanto, Siemens, Erlangen, Germany). In patients with ICD systems, potential risks were explained and CMR were performed using our established protocol.11 Standard steady-state free precession cine images were acquired in multiple cardiac planes. Ten minutes after the injection of the contrast medium, LGE-CMR images were obtained in short axis with a segmented inversion-recovery gradient-echo turbo fast low angle shot sequence with TR 1 R-R interval, TE 1.04 ms, flip angle 25°, average in-plane resolution 1.3×1.3 mm, slice thickness 8 mm, and inversion time typically 240–360 ms.8
CT Image Analysis
CT datasets were reconstructed in 8mm thick slices in the short-axis imaging plane using a dedicated workstation (ZIOSTATION; Ziosoft, Tokyo, Japan). The mean intensity of each of 20 radial sectors per 8 mm short-axis plane was measured. Areas of myocardial FAT-DEP were identified using a post-processing image overlay that highlighted areas between intensity of −180 and 0 Hounsfield units (HU).3,6,12 Identification of FAT-DEP was confirmed when the intensity met our criteria for an area larger than 1 mm2. Sectors with calcification were also identified.
CMR Image Analysis
For the subset of patients with LGE-CMR, QMass MR (Medis, Leiden, Netherlands) was used to measure scar transmurality. Candidate hyperenhanced regions were identified as scar if the mean intensity of the hyperenhanced region was >3 standard deviations above the mean intensity of remote normal myocardium.9 Scar transmurality was determined as previously described.13
Electrophysiological Study
In patients with ICD systems, tachyarrhythmia therapies were disabled before the procedure. Ventricular programmed-stimulation to induce VT was performed with up to triple extrastimuli. If the induced VT sustained without hemodynamic collapse, electroanatomic map (EAM) was performed during the tachycardia. Otherwise, substrate mapping was performed during sinus rhythm or ventricular pacing.
Three-dimensional Electroanatomic Maps and Electrogram Characteristics
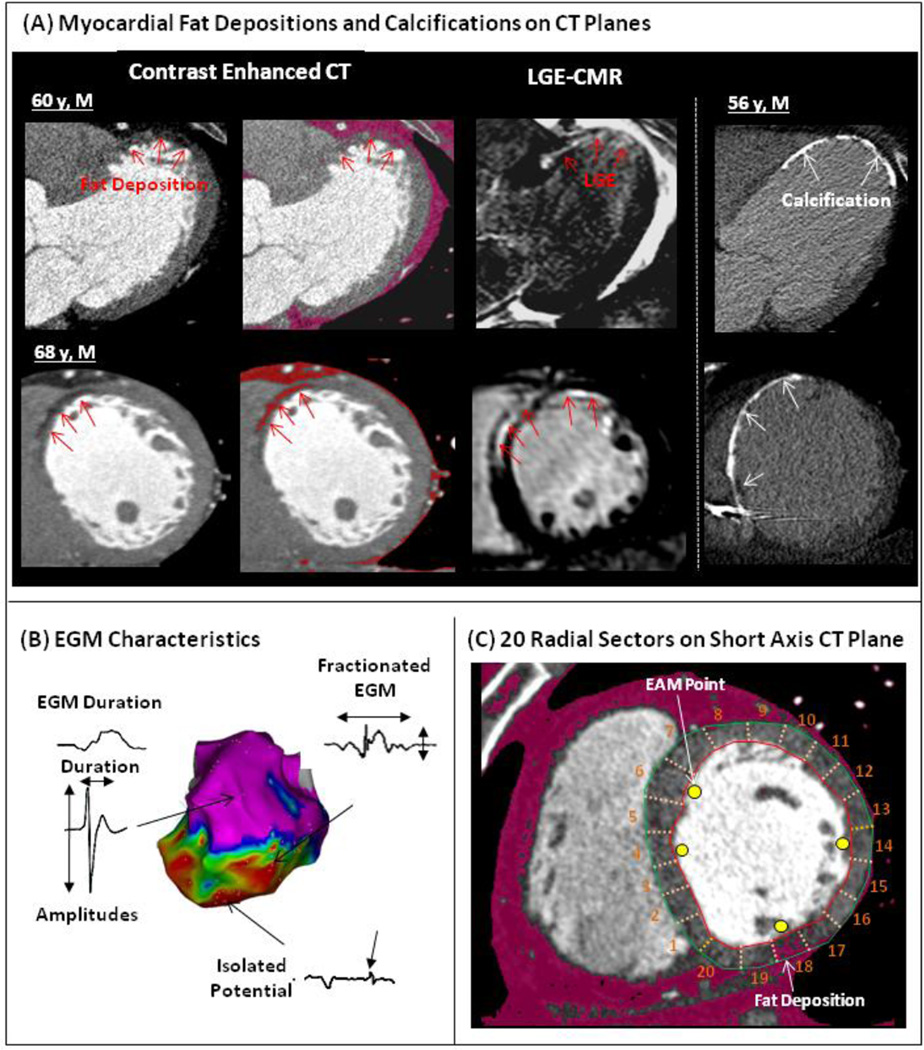
A 3-dimensional EAM system (CARTO, Biosense Webster, Inc., Diamond Bar, CA) was used to create endocardial voltage maps in the left ventricle (LV) during sinus rhythm or ventricular pacing using a 3.5 mm-tip electrode (Thermocool, Biosense Webster, Inc.). The reconstructed LV shell was registered to the LV EAMs.8,9 Registration accuracy was determined using statistical summation on the EAM system. Local bipolar and unipolar voltage and duration were measured (Figure 1B).8,9,14 Bipolar and unipolar electrograms were filtered at 10–400Hz and 1–240Hz, respectively. Electrogram duration was measured from the onset to the end of the electrogram deflections at 400mm/s speed. Fractionated potentials and isolated potentials on bipolar electrogram s were identified based upon previous criteria.15 Two independent observers analyzed electrogram characteristics. In accepting the electrogram in each EAM point, we confirmed that at least 2 consecutive electrograms had the same morphology to avoid electrogram artifact due to poor catheter contact.
Figure 1. Methods.
(A) In the left-side panels, Fat depositions (FAT-DEP) identified as low attenuation regions on contrast enhanced computed tomography (CE-CT) are indicated by red arrows (left panels) in 2 different patients with ischemic cardiomyopathy. FAT-DEPs on CE-CT are also highlighted by a red mask based upon intensity measurements (CT values from −180 to 0 Hounsfield units). Late gadolinium-enhanced cardiac magnetic resonance (LGE-CMR) shows enhancement in the corresponding plane to CE-CT. (B) Electrogram (EGM) parameters and potential types were assessed. (C) Electroanatomic Map (EAM) points were superimposed onto the corresponding short axis CE-CT images divided into 20 radial sectors.
Catheter Ablation of Scar-related VT
Catheter ablation was performed with maximum power of 50W for 30–60 seconds. Ablation targets were determined by pace mapping, and/or entrainment mapping during sustained VT. VT circuit sites of scar-related VT were defined as sites with12/12 ECG morphology pace-map match to target VT, and/or concealed entrainment and post pacing interval minus VT cycle length <30 msec identified during stable VT.8,9,14 In addition, critical VT circuit sites were determined as the sites where catheter ablation successfully eliminated the target VT. Additional radiofrequency lesions targeted abnormal potentials such as isolated or fractionated potentials within scar or connecting scar to nearby non-conductive structures.8,9
Registration of EAM Points to CE-CT and LGE-CMR images
Each EAM point was superimposed onto the corresponding CE-CT planes using previously validated custom software (Volley, Johns Hopkins University) (Figure 1C). In a subgroup of patients with CMR studies, short axis LGE-CMR images were also retrospectively registered to the endocardial EAM.8,16
Statistical Analysis
Continuous variables are expressed as mean ± SD and categorical data as numbers or percentages. Comparisons of continuous variables regarding each electrogram parameter and LV wall thickness were made using ANOVA or a nonparametric test. Categorical variables were compared using the χ2 or Fisher’s exact tests. Comparisons of continuous variables regarding each electrogram parameter were made using ANOVA. Generalized estimating equations models with a working exchangeable covariance structure were utilized to examine the association of electrogram parameter as the dependent variable with CT intensity, while adjusting for age, gender, BMI, LV ejection fraction and wall thickness as independent variables. Statistical analyses were performed using STATA and JMP software.
Results
Patients Characteristics
Twenty-two ICM patients with sustained monomorphic VTs and 20 ICM patients with no history of VTs comprised the study group and the age-matched control group. Baseline patient characteristics of both groups have been summarized in Table 1. FAT-DEP was identified on CE-CT in all patients with VTs and 16 (80%) patients without VTs. There were significant differences in the prevalence of FAT-DEP on CE-CT (100% vs 80%; P=0.049) in addition to body mass index (28.8±4.4 vs 23.0±2.5; P<0.001), years since diagnosis of myocardial infarction (14±7 vs.7±5 years; P=0.01), etc. between 2 groups.
Table 1.
Patient Characteristics
| ICM with VTs N=22 |
Control N=20 |
P Value | |
|---|---|---|---|
| Age [years] | 66±9 | 70±8 | 0.09 |
| Gender Male / Female | 21 / 1 | 16 / 4 | 0.18 |
| Body mass index [kg/m2] | 28.8±4.4 | 23.0±2.5 | <0.001 |
| Myocardial Infarction | |||
| Anteroseptal/Inferior/lateral/multi-vessel | 8 / 9 / 3 / 2 | 9 / 7 / 1 / 3 | 0.70 |
| Years since diagnosis of myocardial Infarction [years] | 14±7 | 7±5 | 0.01 |
| LV Fat Deposition on CT | 22 (100%) | 16 (80%) | 0.043 |
| Intramural Calcification in LV on CT | 5 (24%) | 0 (0%) | 0.049 |
| CT with In-situ ICD or Biventricular ICD | 20 (91%) | 0 (0%) | <0.001 |
| MRI Scans [%] | 10 (46%) | 0 (0%) | <0.001 |
| Echocardiographic Findings | |||
| LV Ejection Fraction [%] | 28±14 | 46±10 | <0.001 |
| LV Diastolic Diameter [mm] | 59±16 | 53±4 | 0.009 |
| Use of Antiarrhythmic Drug | |||
| Amiodarone/Sotalol/β Blocker | 16 / 2 / 14 | 0 / 0 / 15 | 0.001 |
| Total Number of Induced VTs (22 patietns) | 42 | (−) | |
| Mean Cycle Length [msec] | 411±127 | (−) | |
| Morphologies | |||
| Right / Left Bundle Branch Block | 32 / 10 | (−) | |
| Superior / Inferior Axis | 22 / 20 | (−) |
FAT-DEP on Short Axis CT Planes in Patients with Ischemic VTs and controls
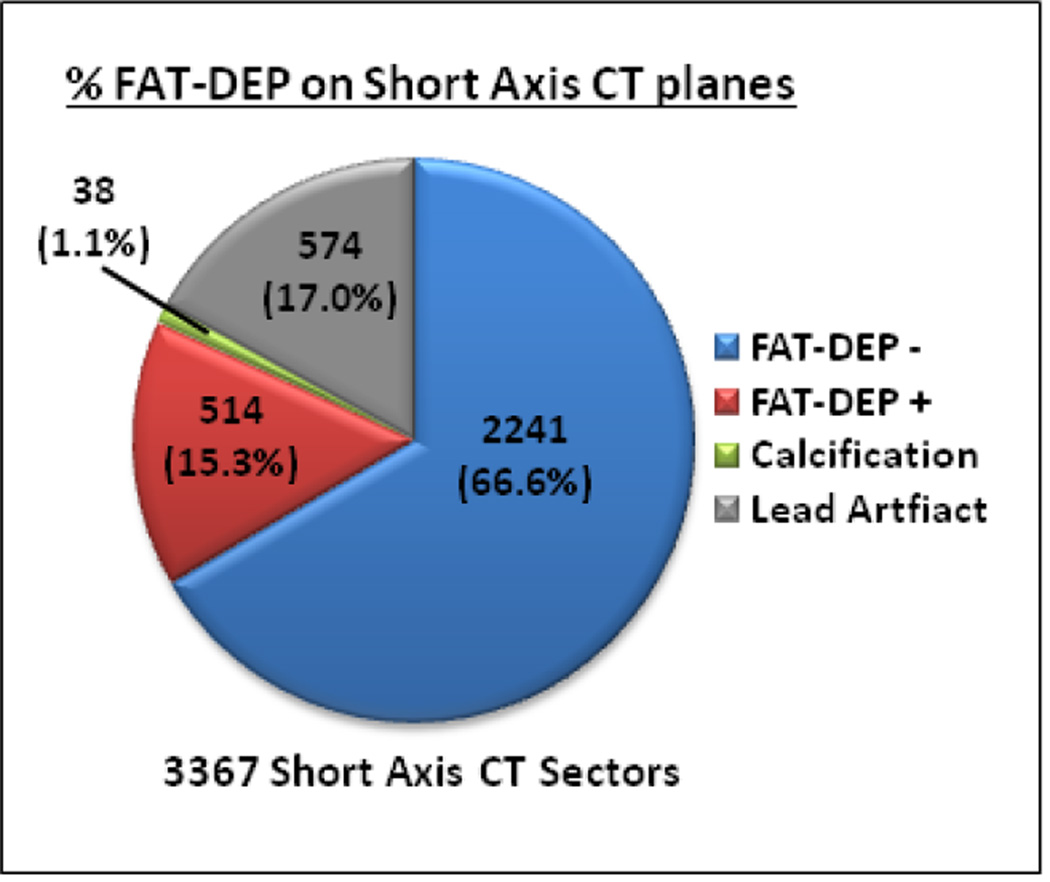
Of 3367 image sectors in short axis CE-CT planes reviewed, 2793 (83%) were suitable for analysis in patients with scar-related VTs (Figure 2). The remaining 17% were excluded due to lead artifacts in patients with ICD systems. In all patients with VTs, FAT-DEP was identified on 514 (18.4%) CE-CT sectors. In contrast, calcification was only observed in 38 (1.4%) CE-CT sectors. Of 514 sectors, FAT-DEP was transmuraly identified in 214 (38.8%) sectors with FAT-DEP. In the control group, FAT-DEP on CE-CT was observed in 250 (7.7%) of 3260 analyzed CE-CT sectors. Of 250 sectors with FAT-DEP, FAT-DEP was transmuraly identified in 45 sectors (18.0%). There are significant differences between the ICM patients with and without VTs in the extent of CE-CT sectors with FAT-DEP (18.4% vs. 7.7%; P<0.0001) and the presence of transmural FAT-DEP (38.8% vs. 18.0%; P<0.0001).
Figure 2. Fat Depositions in Ischemic Scar-related VTs.
Pie graph demonstrating the distribution of sectors with FAT-DEP, without FAT-DEP, calcification, and lead artifact. Abbreviations as in Figure 1.
Comparison of Electrogram Characteristics between the Sectors with and without FAT-DEP
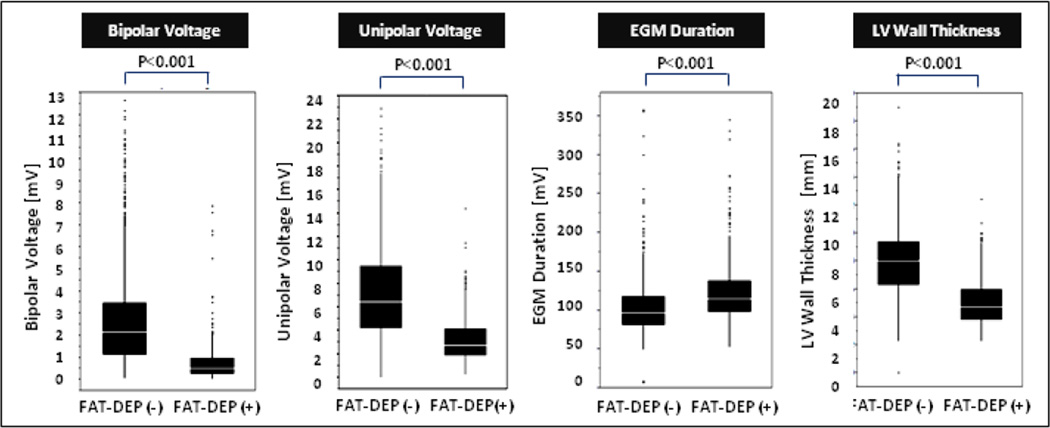
Of 1801 EAM points registered to the CE-CT images, 519 (28.8%) were located in the sectors with FAT-DEP. The remaining 1220 (67.7%) points were located in the sectors without FAT-DEP. In addition, 62 (3.4%) points were located in the sectors with calcification. The LV shells segmented from CE-CT images were successfully merged with the endocardial LV EAM with a mean surface registration error of 2.5±0.6 mm. The sectors with FAT-DEP had lower mean CT intensity (23.2±35.6 vs. 81.7±21.9 HU, P<0.001), lower bipolar (0.75±0.83 vs. 2.9±2.4 mV, P<0.001) and unipolar voltage (3.1±1.7 vs. 7.4±4.3 mV, P<0.001), longer electrogram duration (126±45 vs. 102±32 ms, P<0.001) and thinner LV wall thickness (5.2±1.7 vs. 8.2±2.5 mm, P<0.001) compared with sectors without FAT-DEP (Figure 3). The sectors with calcification also had lower bipolar (0.3±0.3 mV) and unipolar (2.4±1.3 mV) voltages and thinner LV wall thickness (4.5±1.8 mm) compared with sectors without FAT-DEP (P<0.001, respectively).
Figure 3. Comparison of Electrogram Characteristics between the Sectors with and without FAT-DEP.
electrogram parameters between the CE-CT sectors with and without FAT-DEP were compared with boxplot graphs demonstrating the median (white line), interquartile range (solid box), range (black line), and outliers. Abbreviations as in Figure 1.
Association of CT Intensity with Electrogram Characteristics
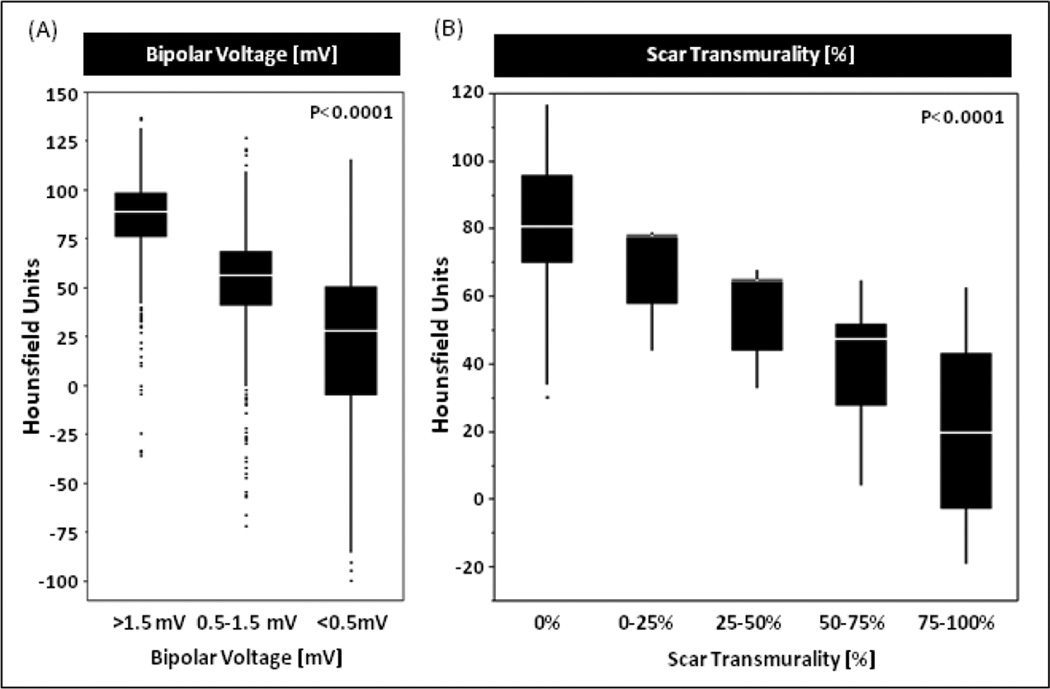
Generalized estimating equations models demonstrated bipolar and unipolar voltages, electrogram duration and LV wall thickness were significantly associated with CE-CT intensity (P<0.001, Supplemental Table 1). Bipolar and unipolar voltage and LV wall thickness were positively associated with CE-CT intensity. Meanwhile, electrogram duration was negatively associated with CE-CT intensity. The mean CE-CT intensities of the sectors with >1.5mV, 0.5–1.5mV and <0.5mV on EAM were 86.1±21.1 HU, 52.4±27.2 HU and 20.7±36.9 HU, respectively (P<0.0001, Figure 4A).
Figure 4. CT Intensity in Regions with Low Voltage Area on EAM and Scar on LGE-CMR.
The mean CT intensities in normal myocardium with >1.5mV bipolar voltage on electroanatomic map (EAM) and no scar on LGE-CMR were 86.1±21.1 HU and, 80.3±17.0 HU, respectively. In addition, the mean intensities in transmural scar with 0.5mV> bipolar voltage and >75% scar transmurality were 20.7±36.9 HU and 21.9±12.2 HU, respectively. HU=Hounsfield unit, LGE-CMR=late gadolinium enhanced cardiac magnetic resonance
Association of FAT-DEP on CE-CT with Scar on LGE-CMR
A total of 485 sectors were correspondingly compared between CE-CT and LGE-CMR in the 10 patients that had both CE-CT and LGE-CMR. The incidence of FAT-DEP on CE-CT was significantly higher in the sectors with LGE on CMR than those without LGE (41.6% vs. 4.4%; P<0.001, Supplemental Figure 1). Therefore, some areas that display LGE retain contrast because of fat deposition, rather than fibrotic transformation. In addition, higher mean intensity on CE-CT was significantly associated with lower scar transmurality on LGE-CMR in the corresponding sectors. In fact, the mean intensities of the corresponding CE-CT sectors with 0%, 0–25%, 25–50%, 50–75% and 75–100% scar transmurality on LGE-CMR were 80.3±17.0 HU, 69.1±13.0HU, 57.3±12.2 HU, 42.1±14.8 HU and 21.9±12.2 HU, respectively (P<0.0001, Figure 4B).
Association of FAT-DEP with Fractionated and Isolated Potentials
Of 1707 analyzed sectors, 13.2% had fractionated electrograms, and 2.4% had isolated potentials. Fractionated and isolated potential were more frequently observed in the sectors with FAT-DEP compared with those without FAT-DEP. Of 487 sectors with FAT-DEP, 29.0% and 6.6% had fractionated and isolated potentials, respectively (P<0.001).
Association of FAT-DEP with Critical VT Circuit Sites
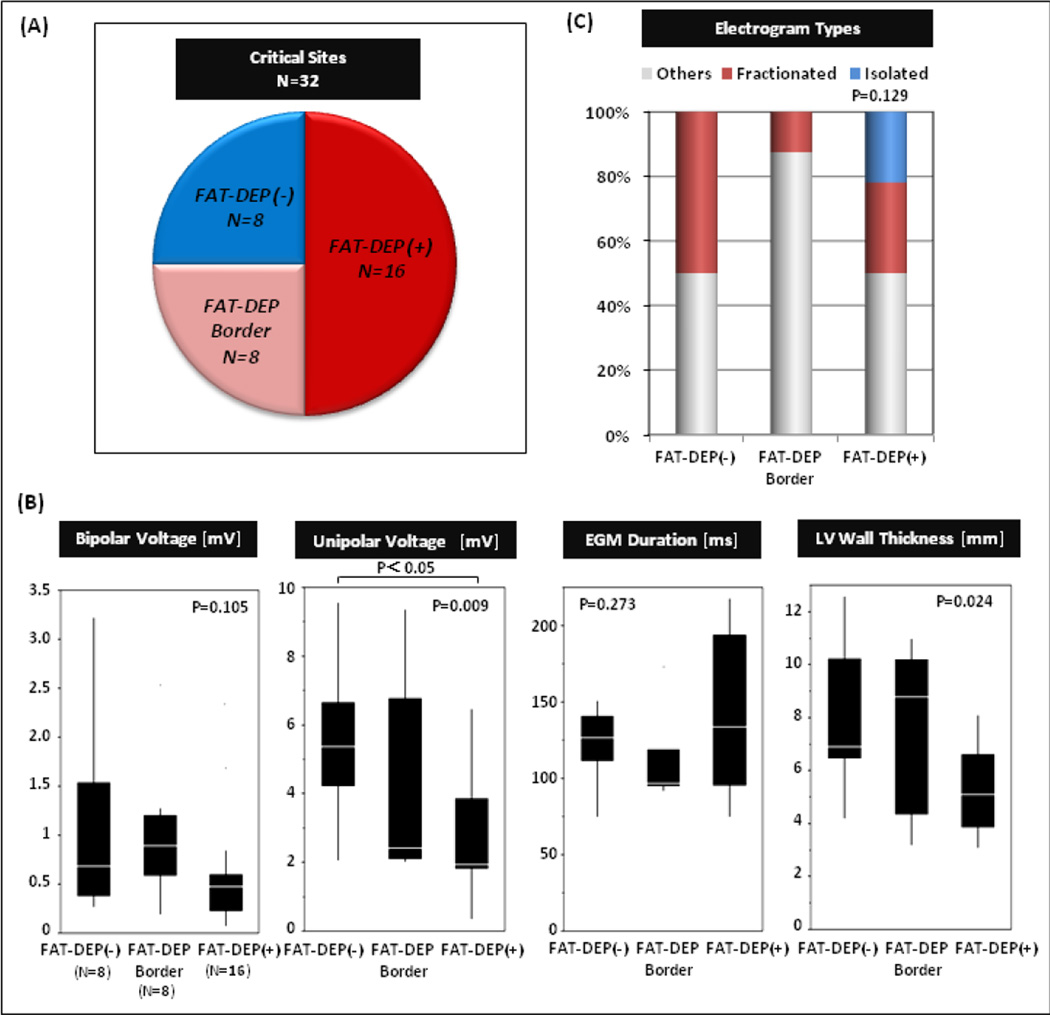
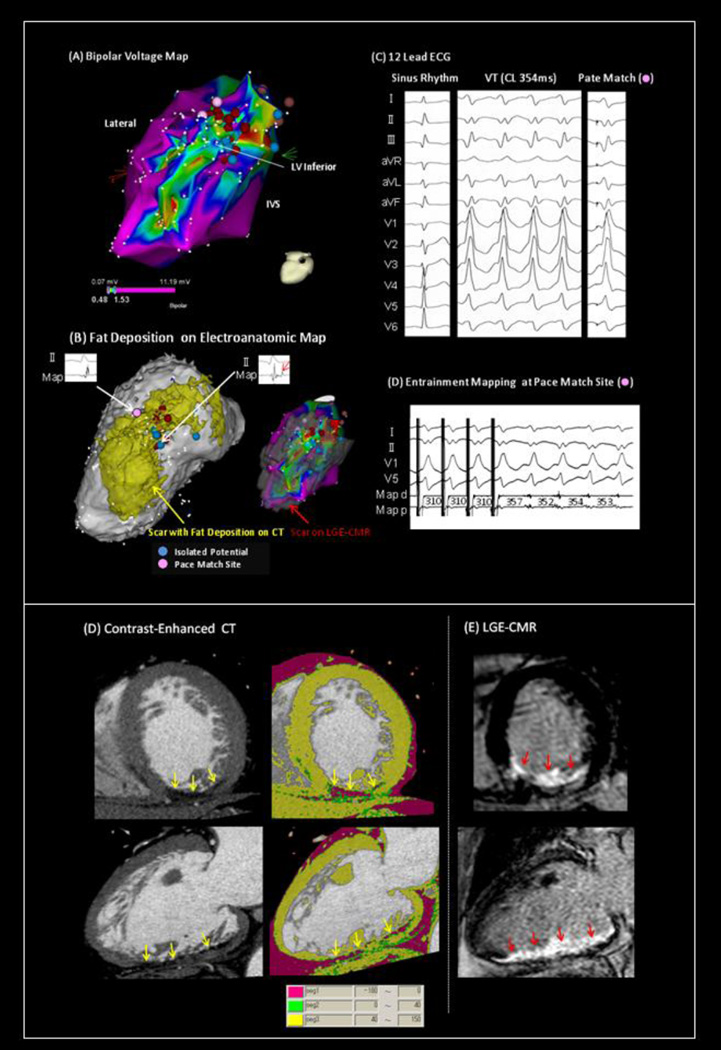
Of 32 critical VT circuit sites identified in this study, 16 (50%) were located in the sectors with FAT-DEP, and 8 sites (25%) were located adjacent to the sectors with FAT-DEP. Meanwhile, the remaining 8 sites (25%) were located in the sectors without FAT-DEP (Figure 5A). Mean CT intensities in the critical VT sites with FAT-DEP, adjacent to FAT-DEP, without FAT-DEP were 11.1±22.8, 51.8±13.2 and 58.4±8.9, respectively (P<0.001, nonparametric). Critical VT sites without FAT-DEP were confined to regions with low voltage suggesting scar substrate. The electrogram characteristics of critical VT circuit sites have been summarized in Figure 5B. There were significant differences in unipolar voltage (P=0.009) and LV wall thickness (P=0.024) among regions without, with, or on the border of FAT-DEP. The VT circuit sites with FAT-DEP had lower bipolar and unipolar voltages, longer electrogram duration and thinner LV wall thickness than those adjacent to FAT-DEP or without FAT-DEP. Isolated potentials were only observed in the critical VT circuit sites with FAT-DEP (Figure 5C). Figure 6 demonstrated that a critical VT circuit site with 12/12 pace match and a concealed entrainment was identified within FAT-DEP in a patient with inferior myocardial infarction and scar-related VT. Figure 6B showed that the segmented FAT-DEP on EAM looks very similar to the bipolar voltage map and the segmented scar on LGE-CMR.
Figure 5. Association of Fat Depositions with VT Circuit Sites.
The figure summarizes electrogram characteristics of 32 VT circuit sites among sites stratified by the absence of fat depositions (FAT-DEP), being on the border of FAT-DEP, or within regions of FAT-DEP.
Figure 6. VT Circuit Sites within the Area with Fat Depositions in a Case with inferior myocardial Infarction.
(A) Bipolar voltage map shows large low voltage area in regions with inferior myocardial infarction. (B) The segmented FAT-DEP on EAM looks very similar to the bipolar voltage map and the segmented scar on LGE-CMR. (C, D) A critical VT circuit site with 12/12 pace match and a concealed entrainment was identified within FAT-DEP. (E) FAT-DEP on CE-CT and (F) scar on LGE-CMR was identified in the same area with myocardial infarction.
Discussion
FAT-DEP in Ischemic Scar-related VT
Previous reports have shown that myocardial FAT-DEP is frequently observed in patients with chronic myocardial infarction.1–7,17 In this pilot study, all patients with scar-related VT had FAT-DEP within the LV myocardium.1 Transmural and endocardial FAT-DEP patterns were predominantly observed, similar to the distribution of scar in ICM.18 Compared to control ICM patients with no prior history of VTs, the extent of FAT-DEP was greater in ICM patients with VTs. Given that FAT-DEP was observed in all patients with ischemic VTs, FAT-DEP might be associated with the pathogenesis of scar-related VT circuits. However, it is important to note that causal relationships cannot be determined on the basis of this study and further work will be necessary to elucidate whether fat tissue plays a role in arrhythmogenic slow conducting circuits or is rather merely a marker of at-risk areas of myocardial scarring. The mechanism of FAT-DEP remains unclear. Goldfarb et al. have speculated that infarct myocardium is populated with adipose tissue following the replacement of infarct myocardium with fibrous scar tissue.7 Baroldi et al. have hypothesized that reduced myocardial contractility is involved in the pathogenesis of FAT-DEP in infarct myocardium.1 According to these hypotheses, FAT-DEP arises as result of ventricular remodeling after myocardial infarction. FAT-DEP will negatively affect the remodeling process, leading to depressed regional ventricular mechanics and global ventricular function.6 FAT-DEP also may have negative effects on electrical conductivities within fibrotic scar tissue that will lead to circuit formations of scar-related VTs; however, the possibility of such effects needs further study.
FAT-DEP and Electrogram Characteristics
Decreased bipolar and unipolar voltages, prolonged electrogram duration, reduced LV wall thickness and the incidence of fractionated and isolated potentials were all associated with FAT-DEP. These associations are very similar to those of scar on LGE-CMR.8,9 In fact, in the subset of patients who also had a cardiac MRI, FAT-DEP was always a subset of regions with scar on LGE-CMR. Due to the nature of LGE-CMR, both FAT and scar are demonstrated as high intensity areas on LGE-CMR.6 Therefore, previous studies that have shown associations between local electrograms and LGE may have analyzed regions that were composed of both fat and fibrosis as homogeneous regions. This present study suggests that the existence of FAT-DEP is associated with lower voltage and longer electrogram duration.
Tissue Characterization on Contrast-enhanced CT
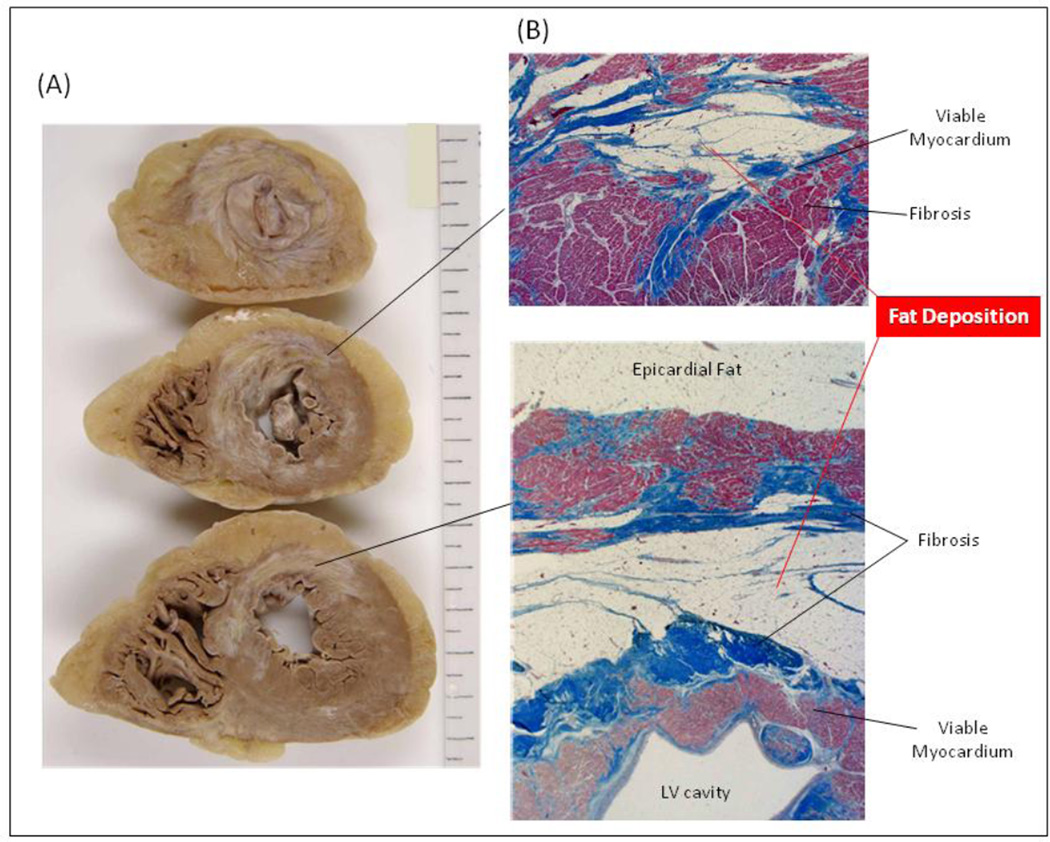
Gupta et al. reported a non-contrast enhanced CT intensity threshold of 21.7 HU to identify regions with myocardial infarction.19 In addition, Nikolaou et al. showed that the mean intensity of infarct regions was 54±19 HU versus 117±28 HU for non-infarcted myocardium.20 In this study, we have found similar results, with the median CT intensity of the regions with 0.5–1.5 mV bipolar voltage on EAM or 0–25% scar transmurality on LGE-CMR were 52.4±27.2 HU or 57.3±12.2 HU, respectively. Therefore, it may be feasible to identify low voltage regions using CE-CT noninvasively. The mean intensity of a sector is a composite pixel containing fat, fibrosis, and viable myocardium in each sector. Given that FAT-DEP always coexists with fibrosis,1,2 the sectors with intensity <0 HU on CE-CT may include more fat tissue than fibrosis. In contrast, the sectors with intensity > 0 HU may include more fibrosis and myocytes than fat tissue. Figure 7 illustrates a histologic example of FAT-DEP identified during autopsy of a patient who died of pneumonia 7 years post antero-septal myocardial infarction. FAT-DEPs exist adjacent to fibrosis within myocardium. Despite higher spatial resolution, the contrast to noise ratio of CE-CT with late enhancement techniques is lower than that provided by CMR. However, our results suggest that CE-CT can be helpful in patients with scar-related VT by identifying fat deposition that appears to co-exist with scar tissue.
Figure 7. Histology of Fat Depositions in a Case with Anteroseptal Myocardial Infarction.
Fat depositions within myocardium in the left ventricle (LV) were observed (A) macroscopically and (B) microscopically in a patient with anteroseptal myocardial infarction.
The Role of FAT-DEP in Scar-related VT Circuits
The previous studies have electrophysiologically elucidated the details of scar-related VT circuits.21,22 The non-conductive barriers to conduction and slowly conducting zones that form VT substrates have been considered to be due to myocardial fibrosis. Prior LGE-CMR studies regarding VT substrates have also pointed to fibrosis as the primary barrier to conduction and/or mediator of slow conduction zones.23 Some reports have focused more on the importance of heterogeneity of signal intensity on LGE-CMR in scar-related VT circuits.16 However, prior reports have not described the impact of FAT-DEP. This is the first report that demonstrated the association of FAT-DEP on CE-CT images with scar-related VT circuits in patients with ICM. Indeed, 75% of the critical VT circuit sites were located in the regions with FAT-DEP or the regions adjacent to FAT-DEP. This finding seems to be very similar to the etiology of scar-related VTs in arrhythmogenic right ventricular cardiomyopathy (ARVC).24 The pathophysiology of ARVC suggests that fat infiltration has a significant impact upon arrhythmogenecity.15,25 In addition, isolated potentials during sinus rhythm or mid diastolic potentials during VT are frequently observed during VT ablation in ARVC patients. Similarly, in our study isolated potentials were frequently observed in regions with FAT-DEP. Since fat works as an electrical insulator, fibrosis along with FAT-DEP might support slow conduction within VT circuits. However, it is important to note that fat was also seen in control patients with prior ischemia and no VT, although to a lesser extent.
Clinical Implication
LGE-CMR has been recognized as the “gold standard” noninvasive modality for detection of scar tissue.13 However, many patients with scar-related VTs have an ICD system before VT ablation. Although CMR is feasible in patients with ICD systems, image susceptibility artifacts often limit the quality and utility of images.11 In contrast, image artifacts on CE-CT are far smaller than artifacts due to ICD generators on LGE-CMR.26 In addition, CT acquisition is easy and quick and can be performed in any ICM patients with exception of those with renal failure or history of allergic reaction to iodinated contrast media. This pilot study has revealed that FAT-DEP after myocardial infarction is strongly associated with local electrogram characteristics and some of VT circuit sites. This finding suggests that CE-CT may be used as an alternative to LGE-CMR for detecting scar tissue and scar-related VT circuit sites. Further study is required to investigate the potential that FAT-DEP on CE-CT may enable the identification of critical sites for scar-related VT circuits.
Limitations
The main limitation of this study is the relatively small sample size. Further prospective studies will be necessary to confirm our results in larger cohorts. In this study, 602 (16.4%) sectors on short axis CE-CT images were excluded due to artifacts from device leads. Intensity on CE-CT in myocardium is affected by myocardial contrast enhancement, which depends on a number of independent variables such as contrast injection protocol and cardiac output; therefore myocardial intensity will vary between patients.19 Results may also be limited by a possibility for positional errors when registering EAM points to LGE-CMR images.8,9,14 In addition, we do not have pathologic proof that the low attenuation pixels correspond to fat in this study; however, the correlation of CT intensities with fat deposition has been well established.3–5,12, 20 The percentage of sectors containing any fat and those with transmural fat were both significantly lower in the control group, which suggests that the controls had less extensive fat. However, we were unable to precisely measure the absolute quantity of fat in these groups due to ICD artifacts and it is possible that the absolute quantity of fat may be similar between groups but only differs in distribution throughout the LV. These potential differences of FAT-DEPs between ICM patients with and without scar-related VTs will need to be further investigated in future studies. Measurement of electrogram duration may differ depending upon the criteria for analysis. Inter-observer reliability analysis was not formally performed. However, disagreements among the three observers were rare.
Conclusions
FAT-DEP after myocardial infarction on CE-CT was strongly associated with bipolar and unipolar voltage, electrogram duration and critical VT circuit sites in this pilot study. These associations suggest that FAT-DEP within infarcted myocardium may play a significant role in the generation of scar-related VT circuits in patients with ICM. Regions with FAT-DEP may provide new targets for VT ablation. These results provide novel information that may complement current strategies for the identification and targeting of the VT substrate in patients with ICM.
Supplementary Material
Clinical Perspectives.
Fat deposition within myocardial infarction has frequently been observed in patients with ICM. The association of scar on LGE-CMR with local electrogram characteristics and critical VT circuit sites has been investigated. Here we sought to elucidate the association of fat deposition on CE-CT with local electrograms and critical VT circuit sites in patients undergoing catheter ablation of scar-related monomorphic VTs. We also compared the electrograms near LGE regions on CMR and fat deposition on CE-CT in a subset of patients. Fat depositions on CE-CT were significantly associated with local electrogram characteristics and critical VT circuit sites, similar to the associations with LGE on CMR. Lower bipolar and unipolar amplitudes and longer electrogram duration were associated with increased fat deposition. In addition, 75% of critical VT circuit sites were identified in infarct regions with fat deposition. In patients with ischemic scar-related VTs, the use of LGE-CMR may by limited due to artifacts by implantable cardioverter defibrillators even with MRI-conditional devices. However, CE-CT is readily available in those patients. Prior knowledge of the associations of fat depositions within infarct scar and local electrograms or VT circuit sites should provide useful information for catheter ablation of post-infarct scar-related VTs. Further prospective study will be required to elucidate any causal association of fat deposition with VT circuit generation and to verify the impact of fat targeting based upon preprocedural CE-CT on ablation outcomes in ICM patients with scar-related VTs.
Acknowledgments
Funding Sources – The study was supported by grants K23HL089333 and R01HL116280 from the US National Institutes of Health to Dr. Nazarian.
Dr. Nazarian is a scientific advisor to and PI for research support to Johns Hopkins from Biosense Webster Inc.
Abbreviations
- FAT-DEP
fat deposition
- ICM
ischemic cardiomyopathy
- VT
ventricular tachycardia
- LGE-CMR
Late gadolinium enhanced cardiac manetic resonance
- CE-CT
contrast-enhanced computed tomography
- EAM
electroanatomic map
- ICD
Implantable cardioverter defibrillator
- LV
left ventricle
- HU
Hounsfield units
- ARVC
arrhythmogenic right ventricular cardiomyopathy
Footnotes
Publisher's Disclaimer: This is a PDF file of an unedited manuscript that has been accepted for publication. As a service to our customers we are providing this early version of the manuscript. The manuscript will undergo copyediting, typesetting, and review of the resulting proof before it is published in its final citable form. Please note that during the production process errors may be discovered which could affect the content, and all legal disclaimers that apply to the journal pertain.
Conflict of Interest Disclosures – The Johns Hopkins University Conflict of Interest Committee manages all commercial arrangements.
References
- 1.Baroldi G, Silver MD, De Maria R, Parodi O, Pellegrini A. Lipomatous metaplasia in left ventricular scar. Can J Cardiol. 1997;13:65–71. [PubMed] [Google Scholar]
- 2.Su L, Siegel JE, Fishbein MC. Adipose tissue in myocardial infarction. Cardiovasc Pathol. 2004;13(2):98–102. doi: 10.1016/S1054-8807(03)00134-0. [DOI] [PubMed] [Google Scholar]
- 3.Winer-Muram HT, Tann M, Aisen AM, Ford L, Jennings SG, Bretz R. Computed tomography demonstration of lipomatous metaplasia of the left ventricle following myocardial infarction. J Comput Assist Tomogr. 2004;28:455–458. doi: 10.1097/00004728-200407000-00004. [DOI] [PubMed] [Google Scholar]
- 4.Ichikawa Y, Kitagawa K, Chino S, Ishida M, Matsuoka K, Tanigawa T, Nakamura T, Hirano T, Takeda K, Sakuma H. Adipose tissue detected by multislice computed tomography in patients after myocardial infarction. JACC Cardiovasc Imaging. 2009;2:548–555. doi: 10.1016/j.jcmg.2009.01.010. [DOI] [PubMed] [Google Scholar]
- 5.Schmitt M, Samani N, McCann G. Images in cardiovascular medicine. Lipomatous metaplasia in Ischemic cardiomyopathy: a common but unappreciated entity. Circulation. 2007;116:e5–e6. doi: 10.1161/CIRCULATIONAHA.107.690800. [DOI] [PubMed] [Google Scholar]
- 6.Lücke C, Schindler K, Lehmkuhl L, Grothoff M, Eitel I, Schuler G, Thiele H, Kivelitz D, Gutberlet M. Prevalence and functional impact of lipomatous metaplasia in scar tissue following myocardial infarction evaluated by MRI. Eur Radiol. 2010;20:2074–2083. doi: 10.1007/s00330-010-1791-x. [DOI] [PubMed] [Google Scholar]
- 7.Goldfarb JW, Roth M, Han J. Myocardial fat deposition after left ventricular myocardial infarction: assessment by using MR water-fat separation imaging. Radiology. 2009;253:65–73. doi: 10.1148/radiol.2532082290. [DOI] [PubMed] [Google Scholar]
- 8.Sasaki T, Miller CF, Hansford R, et al. Myocardial Structural Association with Local Electrograms: A Study of Post-infarct Ventricular Tachycardia Pathophysiology and Magnetic Resonance Based Non-Invasive Mapping. Circulation Arrythm Electorphysiol. 2012;5:1081–1090. doi: 10.1161/CIRCEP.112.970699. [DOI] [PMC free article] [PubMed] [Google Scholar]
- 9.Desjardins B, Crawford T, Good E, Oral H, Chugh A, Pelosi F, Morady F, Bogun F. Infarct architecture and characteristics on delayed enhanced magnetic resonance imaging and electroanatomic mapping in patients with postinfarction ventricular arrhythmia. Heart Rhythm. 2009;6:644–651. doi: 10.1016/j.hrthm.2009.02.018. [DOI] [PMC free article] [PubMed] [Google Scholar]
- 10.Pouliopoulos J, Chik WW, Kanthan A, Sivagangabalan G, Barry MA, Fahmy PN, Midekin C, Lu J, Kizana E, Thomas SP, Thiagalingam A, Kovoor P. Intramyocardial Adiposity Post-Myocardial Infarction: New Implications of a Substrate for Ventricular Tachycardia. Circulation. 2013;128:2296–2308. doi: 10.1161/CIRCULATIONAHA.113.002238. [DOI] [PubMed] [Google Scholar]
- 11.Nazarian S, Hansford R, Roguin A, et al. A prospective evaluation of a protocol for magnetic resonance imaging of patients with implanted cardiac devices. Ann Intern Med. 2011;155:415–424. doi: 10.7326/0003-4819-155-7-201110040-00004. [DOI] [PMC free article] [PubMed] [Google Scholar]
- 12.Buzug TM. Introduction to computed tomography. Berlin: Sringer-Verlag Berlin Heidelberg; 2008. Hounsfield Units; pp. 475–477. [Google Scholar]
- 13.Nazarian S, Bluemke DA, Lardo AC, et al. Magnetic resonance assessment of the substrate for inducible ventricular tachycardia in nonischemic cardiomyopathy. Circulation. 2005;112:2821–2825. doi: 10.1161/CIRCULATIONAHA.105.549659. [DOI] [PMC free article] [PubMed] [Google Scholar]
- 14.Polin GM, Haqqani H, Tzou W, Hutchinson MD, Garcia FC, Callans DJ, Zado ES, Marchlinski FE. Endocardial unipolar voltage mapping to identify epicardial substrate in arrhythmogenic right ventricular cardiomyopathy/dysplasia. Heart Rhythm. 2011;8:76–83. doi: 10.1016/j.hrthm.2010.09.088. [DOI] [PubMed] [Google Scholar]
- 15.Vassallo JA, Marchlinski FE, Buxton AE, Untereker WJ, Josephson ME. Endocardial mapping in humans in sinus rhythm with normal left ventricles: activation patterns and characteristics of electrograms. Circulation. 1984;70:37–42. doi: 10.1161/01.cir.70.1.37. [DOI] [PubMed] [Google Scholar]
- 16.Estner HL, Zviman MM, Herzka D, Miller F, Castro V, Nazarian S, Ashikaga H, Dori Y, Berger RD, Calkins H, Lardo AC, Halperin HR. The critical isthmus sites of ischemic ventricular tachycardia are in zones of tissue heterogeneity, visualized by magnetic resonance imaging. Heart Rhythm. 2011 Dec 8;(12):1942–1949. doi: 10.1016/j.hrthm.2011.07.027. [DOI] [PubMed] [Google Scholar]
- 17.Basso C, Fox PR, Meurs KM, Towbin JA, Spier AW, Calabrese F, Maron BJ, Thiene G. Arrhythmogenic right ventricular cardiomyopathy causing sudden cardiac death in boxer dogs: a new animal model of human disease. Circulation. 2004;109:1180–1185. doi: 10.1161/01.CIR.0000118494.07530.65. [DOI] [PubMed] [Google Scholar]
- 18.Karamitsos TD, Francis JM, Myerson S, Selvanayagam JB, Neubauer S. The Role of Cardiovascular Magnetic Resonance Imaging in Heart Failure. J Am Coll Cardiol. 2009;54:1407–1424. doi: 10.1016/j.jacc.2009.04.094. [DOI] [PubMed] [Google Scholar]
- 19.Gupta M, Kadakia J, Hacioglu Y, Ahmadi N, Patel A, Choi T, Yamada G, Budoff M. Non-contrast cardiac computed tomography can accurately detect chronic myocardial infarction: Validation study. J Nucl Cardiol. 2011;18:96–103. doi: 10.1007/s12350-010-9314-3. [DOI] [PMC free article] [PubMed] [Google Scholar]
- 20.Nikolaou K, Knez A, Sagmeister S, Wintersperger BJ, Boekstegers P, Steinbeck G, Reiser MF, Becker CR. Assessment of Myocardial Infarctions Using Multidetector-Row Computed Tomograpy. J Comput Assist Tomogr. 2004;28:286–292. doi: 10.1097/00004728-200403000-00021. [DOI] [PubMed] [Google Scholar]
- 21.Stevenson WG, Sager PT, Natterson PD, Saxon LA, Middlekauff HR, Wiener I. Relation of pace mapping QRS configuration and conduction delay to ventricular tachycardia reentry circuits in human infarct scars. J Am Coll Cardiol. 1995;26:481–488. doi: 10.1016/0735-1097(95)80026-d. [DOI] [PubMed] [Google Scholar]
- 22.Almendral JM, Gottlieb CD, Rosenthal ME, Stamato NJ, Buxton AE, Marchlinski FE, Miller JM, Josephson ME. Entrainment of ventricular tachycardia: explanation for surface electrocardiographic phenomena by analysis of electrograms recorded within the tachycardia circuit. Circulation. 1988;77:569–580. doi: 10.1161/01.cir.77.3.569. [DOI] [PubMed] [Google Scholar]
- 23.Psaltis PJ, Carbone A, Leong DP, et al. Assessment of myocardial fibrosis by endoventricular electromechanical mapping in experimental nonischemic cardiomyopathy. Int J Cardiovasc Imaging. 2011;27:25–37. doi: 10.1007/s10554-010-9657-5. [DOI] [PubMed] [Google Scholar]
- 24.Komatsu Y, Jadidi A, Sacher F, et al. Relationship Between MDCT-Imaged Myocardial Fat and Ventricular Tachycardia Substrate in Arrhythmogenic Right Ventricular Cardiomyopathy. J Am Heart Assoc. 2014 Aug; doi: 10.1161/JAHA.114.000935. [DOI] [PMC free article] [PubMed] [Google Scholar]
- 25.Philips B1, Madhavan S, James C, Tichnell C, Murray B, Needleman M, Bhonsale A, Nazarian S, Laurita KR, Calkins H, Tandri H. High prevalence of catecholamine-facilitated focal ventricular tachycardia in patients with arrhythmogenic right ventricular dysplasia/cardiomyopathy. Circ Arrhythm Electrophysiol. 2013;6:160–166. doi: 10.1161/CIRCEP.112.975441. [DOI] [PubMed] [Google Scholar]
- 26.Sasaki T, Hansford R, Zviman MM, et al. Quantitative assessment of artifacts on cardiac magnetic resonance imaging of patients with pacemakers and implantable cardioverter-defibrillators. Circ Cardiovasc Imaging. 2011;4:662. doi: 10.1161/CIRCIMAGING.111.965764. [DOI] [PMC free article] [PubMed] [Google Scholar]
Associated Data
This section collects any data citations, data availability statements, or supplementary materials included in this article.


