Figure 3.
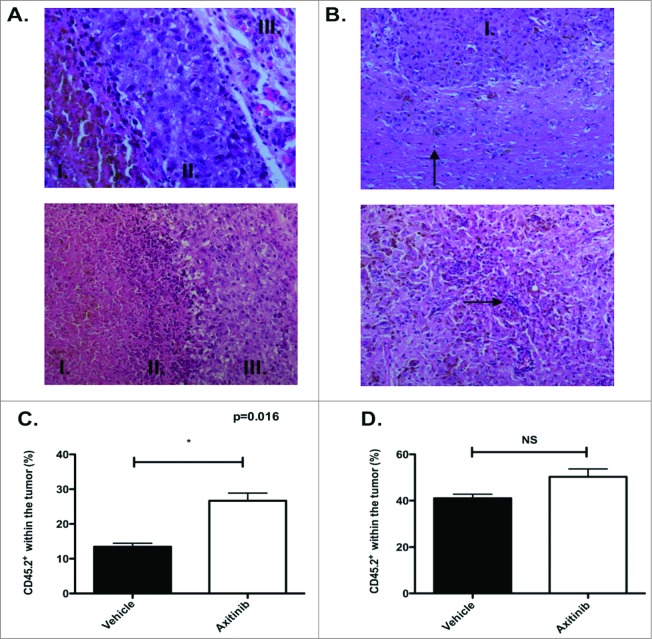
Histological screening of tumors and increased infiltration of OT-1 T cells after axitinib treatment. (A–B). Histochemistry. (A). Subcutaneous tumor. Upper panel. Vehicle-treated mice. Amorf necrotic material with apoptic cells, nuclei and pigment (I.); viable tumor cells surrounding necrotic region (II.) and normal subcutaneous tissue (III.) (H&E, x40). Lower panel. Axitinib-treated mice. Amorf necrotic material with apoptic cells, nuclei and pigment (I.); transition between necrotic tissue and viable tumor: presence of cell and nuclear debris, and lymphocytic infiltrate (II); viable tumor cells surrounding necrotic region (III.) (H&E, x20). (B). Intracranial tumor. Upper panel. Vehicle-treated mice. Viable pleomorphic tumor cells. Solid growth pattern (I.). Lymphocytic infiltration less pronounced than in subcutaneous tumor (arrow)(H&E, x20). Lower panel. Axitinib-treated mice. Reduced tumoral cellularity. Subnecrotic tissue in between tumor cells. Lymphocytes surrounding cell and nuclear debris (arrow)(H&E, 20x) C-D. OT-1 infiltration. MO4 cells were subcutaneously (C.) or intracranially (D.) inoculated in CD45.1 transgenic mice and treated with vehicle or axitinib at 25mg/kg bid by oral gavage for 7 d. On the first day of axitinib-treatment, a lymphodepleting dose of cyclophosphamide was given (2mg diluted in 100μL of PBS per mouse, intraperitoneally). On the third day of axitinib-treatment, CD45.2 OT-1 T cells were infused intravenously. On the last day of treatment (5 d after the adoptive transfer), mice were sacrificed and single cell suspensions of the subcutaneous tumors were made. The percentage of CD45.2 OT-1 T cells within the tumor was subsequently analyzed with flow cytometry. In axitinib-treated mice there was a significant increased tumor infiltration (subcutaneous of CD45.2 OT-1 T cells (C.). In the intracranial tumors the tumor infiltration of CD45.2 OT-1 T cells was increased (not significant, D.) and two independent experiments were performed (3 mice per group) and results are presented as mean ± SEM.

