

Abstract
Pancreatic α cells are exposed to metabolic stress during the evolution of type 2 diabetes (T2D), but it remains unclear whether this affects their survival. We used electron microscopy to search for markers of apoptosis and endoplasmic reticulum (ER) stress in α and β cells in islets from T2D or non-diabetic individuals. There was a significant increase in apoptotic β cells (from 0.4% in control to 6.0% in T2D), but no α cell apoptosis. We observed, however, similar ER stress in α and β cells from T2D patients. Human islets or fluorescence-activated cell sorting (FACS)-purified rat β and α cells exposed in vitro to the saturated free fatty acid palmitate showed a similar response as the T2D islets, i.e. both cell types showed signs of ER stress but only β cells progressed to apoptosis. Mechanistic experiments indicate that this α cell resistance to palmitate-induced apoptosis is explained, at least in part, by abundant expression of the anti-apoptotic protein Bcl2l1 (also known as Bcl-xL).
Keywords: Pancreatic α cells, Type 2 diabetes, Apoptosis, Metabolic stress, Palmitate, Bcl2l1, ER stress
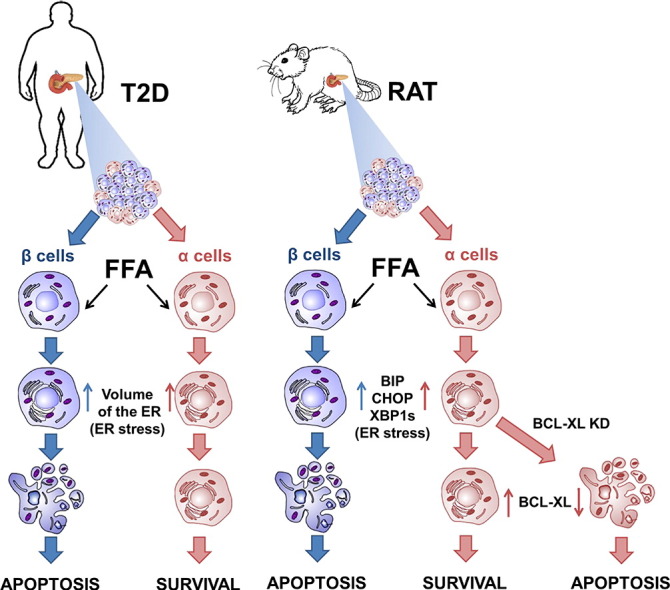
Graphical abstract
Highlights
-
•
Pancreatic β and α cells show markers of endoplasmic reticulum stress during T2D or metabolic stress.
-
•
Pancreatic β cells, but not α cells, undergo apoptosis secondary to this metabolic stress.
-
•
Resistance of α cells to metabolic stress-induced apoptosis is due to a higher expression of anti-apoptotic Bcl2l1 protein.
1. Introduction
Type 2 diabetes (T2D) affects 380 million individuals worldwide, and its prevalence will further increase in the coming decades with the obesity epidemic (IDF Diabetes Atlas, 2013). T2D is characterized by progressive loss of pancreatic β cell function and insulinopenia, and by non-suppressed post-prandial glucagon secretion by pancreatic α cells (D'Alessio, 2011). β cell failure is associated with β cell apoptosis and a progressive decrease in β cell mass (Butler et al., 2003, Rahier et al., 2008). β cell death is probably secondary to metabolic stress mediated by high levels of saturated free fatty acids (FFAs) and glucose (Poitout and Robertson, 2008). Possible mechanisms of metabolic stress-induced β cell apoptosis in T2D include endoplasmic reticulum (ER) stress (Kharroubi et al., 2004), oxidative stress (Carlsson et al., 1999) and ceramide production (Shimabukuro et al., 1998), and this culminates in activation of the intrinsic or mitochondrial pathway of apoptosis (Cunha et al., 2012, Gurzov and Eizirik, 2011). A high-fat and high-sugar diet decreases β cell mass but increases α cell mass in nonhuman primates (Fiori et al., 2013). Recent evidence obtained in mice, monkeys and humans suggests that β cells may dedifferentiate and adopt α cell characteristics (Fiori et al., 2013, Gao et al., 2014, Talchai et al., 2012, White et al., 2013), putatively contributing to the decreased insulin production and increased glucagon secretion in T2D. α Cell dysfunction and hyperglucagonemia is induced by postprandial lipemia in healthy subjects and by treating mouse islets with triglyceride-rich lipoproteins (Niederwanger et al., 2014).
Pancreatic α and β cells have similar embryonic origins (Teitelman et al., 1993), and are equally exposed to metabolic stress during the evolution of T2D, but it remains unclear whether metabolic stress affects α cell survival. Here we examined the presence of apoptosis and ER stress in α and β cells of T2D individuals and in human islets exposed to palmitate. Both cell types show signs of ER stress, but only β cells progress to apoptosis. To clarify the mechanisms involved, we developed a method to fluorescence-activated cell sorting (FACS)-isolate pure (> 90%) and viable (> 90%) rat α cells. In keeping with the human islet data, palmitate induced ER stress in α and β cells, but apoptosis was only present in β cells. This α cell resistance to lipotoxicity is due to higher anti-apoptotic protein expression.
2. Materials and Methods
2.1. Human Islet EM
Organ donor pancreata were handled with the approval of the Ethics Committee of the University of Pisa, Italy. Samples from 8 non-diabetic and 9 T2D organ donors were studied, individual characteristics of age, gender, BMI, cause of death and anti-diabetic treatment are listed in Table S1. Samples were processed as previously described (Cnop et al., 2014, Marchetti et al., 2007). In brief, the tissue was fixed with 2.5% glutaraldehyde in 0.1 M of cacodylate buffer, pH 7.4 for 1 h at 4 °C. After rinsing in cacodylate buffer, the tissue was postfixed in 1% cacodylate buffered osmium tetroxide for 2 h at room temperature, then dehydrated in a graded series of ethanol, quickly transferred to propylene oxide and embedded in Epon-Araldite. Ultrathin sections (60–80 nm thick) were cut with a diamond knife, placed on formvar-carbon coated copper grids (200 mesh), and stained with uranyl acetate and lead citrate. β and α cells were identified by the ultrastructural characteristics of the insulin and glucagon granules, respectively (Orci, 1985) and in some cases confirmed by immunogold (see below). Morphometric analyses were performed as previously detailed (Cnop et al., 2014, Marchetti et al., 2007). Briefly, micrographs obtained at × 10,000, were analyzed by overlay with a graticule (11 × 11 cm) composed of 169 points. Volume densities were calculated according to the formula: volume density = Pi/Pt, where Pi is the number of points within the subcellular component and Pt is the total number of points; values are expressed as ml/100 ml tissue (ml%). By electron microscopy analysis, morphological evidence of marked chromatin condensation and/or the presence of blebs were considered as signs of apoptosis (Masini et al., 2009).
2.2. Immunoelectron Microscopy Methods
Immunogold experiments were accomplished according to the procedures detailed by Zuber et al. (Zuber et al., 2005). Ultrathin sections, from glutaraldehyde–osmium tetroxide fixed tissue mounted on nickel grids, were placed on droplets of freshly prepared 1% aqueous periodic acid for 6 min at room temperature. Sections were conditioned with PBS (0.01 M phosphate buffer, pH 7.2, 0.15 M NaCl) containing 1% BSA, 0.01% Triton X-100, and 0.01% Tween 20 and exposed to guinea pig anti-insulin antibody (Sigma-Aldrich, Saint Louis, MO, USA), diluted 1:200, for 2 h at room temperature, or to rabbit anti-glucagon antibody (Zymed-Invitrogen, Carlsbad, CA, USA), diluted 1:100, overnight at 4 °C. Afterwards, samples were rinsed with buffer and grids were incubated with 15 nm of protein A-gold complex (Agar Scientific, Stansted, UK), diluted 1:10, for 1 h at room temperature. Finally, sections were contrasted with uranyl acetate and lead citrate prior to examination with the 902 Zeiss electron microscope. Control incubations were performed by omission of the primary antibody.
2.3. Human Islet Isolation and Exposure to Palmitate
For the in vitro studies, islets were isolated from 3 non-diabetic donors (age, 61 ± 6 years; 2 males/1 female; body mass index, 25.4 ± 0.8 kg/m2; cause of death: 2 cardiovascular diseases, 1 trauma; intensive care unit stay, 2.7 ± 0.6 days; pancreas cold ischemia time: 16.7 ± 2.3 h) by collagenase digestion and density gradient purification, as previously reported (Del Guerra et al., 2005; Cnop et al., 2014). Islets were cultured for 2–3 days in M199 medium (containing 5.5 mM of glucose) supplemented with 10% adult bovine serum. Then, the islets were cultured for 48 h in supplemented M199 medium containing 1% bovine serum albumin (BSA) and 0.5 mM of palmitate (Cnop et al., 2014, Cunha et al., 2008).
2.4. FACS Purification, Culture and Treatment of rat α and β Cells
Male Wistar rats (Charles River) were housed and used according to the guidelines of the Belgian Regulations for Animal Care, with the approval by the local Ethical Committee. Rat islets were isolated by collagenase digestion and handpicked. For β and α cell isolation, islets were dissociated into single cells by mechanical and enzymatic dispersion using trypsin (1 mg/ml) (Sigma) and DNaseI (1 mg/ml) (Roche) for 5 min at 31 °C under agitation. Dissociated cells were re-suspended in HEPES-buffered Earle's medium containing 2.8 mM of glucose. FACS sorting of β and α cells was done using an Aria I cell sorter (BD Biosciences) equipped with violet, blue and red lasers and a 70 μm nozzle. Forward scatter (FSC) and side scatter (SSC) indicated the relative differences in, respectively, size and granularity of the cells. Cells were selected with the blue argon laser at 488 nm while the FAD-like cellular autofluorescence was excited at 488 nm and selected after a 530/30 band-pass filter (525 nm). Cell doublets and cell fragments/death cells were excluded from FACS analysis and collection. Rat β cells have a threefold higher FAD fluorescence than α cells at low glucose concentration (2.8 mM). This property, coupled to the size and granularity difference between β and α cells (β cells are larger and more granulated than α cells), allows the separation of the β and α cell fractions, with a high purity, using an average side scatter-width intensity of 170,000 units for the β cells and 120,000 units for the non-β cells. The non-β cell fraction was gated under 50,000 units of fluorescence to avoid contamination by β cells. Additional used parameters were: voltage FSC: 105, SSC: 205, FITC: 730, laser window extension: 0.5, and FACS area scaling: 0.75. To obtain α cells from the non-β cell population, we narrow the gate on the fluorescence parameter and define a sorting window between ± 20,000 and 40,000 units of fluorescence. This allows us to reach a very high purity in α cells (> 90–95%) and very good viability (> 90%) (protocol modified from (Pipeleers et al., 1985)). After sorting, purified β cells were cultured in Ham's F-10 medium containing 10 mM of glucose, 2 mM of GlutaMAX, 0.5% BSA, 50 μM of isobutylmethylxanthine, 50 units/ml of penicillin and 50 μg/ml of streptomycin and 5% heat-inactivated fetal bovine serum (FBS, Gibco Life Technologies). α cells were cultured in the same medium but with 6.1 mM of glucose and 10% FBS. In some experiments α and β cells were cultured in parallel at 6.1, 10 and 20 mM of glucose.
Palmitate (sodium salt, Sigma) was dissolved in 90% ethanol to a concentration of 50 mM and diluted in medium containing 0.75% BSA (fatty acid-free fraction V, Roche) and 2% FBS to a final concentration of 0.5 mM (modified from (Cnop et al., 2001)).
CPA and tunicamycin (Sigma) were dissolved in DMSO and used at a concentration of 12.5 μM and 5 μg/ml, respectively. BFA (Sigma) was dissolved in ethanol and used at 0.1 μg/ml. The treatments were performed in specific culture medium for β and α cells with 2% FBS.
2.5. RNA Interference
β and α cells were transfected with 30 nM of the previously validated siRNAs for Bcl2l1 (Invitrogen, Carlsbad, CA) (Miani et al., 2013), Bcl2 (Invitrogen, Carlsbad, CA) (Cunha et al., 2012) or Allstars Negative Control siRNA (siCTRL, Qiagen, used as a negative control) using the Lipofectamine RNAiMAX lipid reagent (Invitrogen). siCTRL does not affect β and α cell gene expression, function or viability ((Moore et al., 2012) and data not shown). Cells were cultured for 48 h and then exposed to palmitate.
2.6. Assessment of Cell Viability
The percentage of viable, apoptotic, and necrotic cells was determined after incubation with the DNA-binding dyes propidium iodide (5 μg/ml; Sigma) and Hoechst 33342 (5 μg/ml; Sigma) (Rasschaert et al., 2005). A minimum of 600 cells was counted in each experimental condition. Viability was evaluated by two independent observers, one of them unaware of sample identity. The agreement between observers was > 90%.
2.7. mRNA Extraction and Real-time PCR
Poly(A) + mRNA was isolated from primary rat β and α cells using the Dynabeads mRNA DIRECT kit (Invitrogen), reverse transcribed, amplified by real-time PCR using SYBR Green as described (Rasschaert et al., 2005), and compared with a standard curve (Overbergh et al., 1999). Expression values were corrected for the reference gene glyceraldehyde-3-phosphate dehydrogenase (Gapdh), expression of which is not modified by the experimental conditions. The primers are detailed in Table S2.
2.8. Western Blot Analysis
Cells were washed with cold PBS and lysed in Laemmli buffer. Immunoblot analysis was performed with anti-Bcl2l1 (54H6) (cell signaling) and anti-α-tubulin (Sigma). Membranes were exposed to secondary peroxidase-conjugated antibody for 1 h at room temperature. Immunoreactive bands were revealed using the SuperSignal West Femto chemiluminescent substrate (Thermo Scientific) and detected using a Bio-Rad chemi DocTM XRS + (Bio-Rad laboratories). The densitometry of the bands was evaluated using Image LabTM software (Bio-Rad laboratories).
2.9. Statistical Analysis
Data are presented as means ± SEM or plotted as box plots, indicating lower quartile, median, and higher quartile, with whiskers representing the range of the remaining data points. Comparisons were performed by two-tailed paired Student's t-test or by ANOVA followed by Student's t-test with Bonferroni correction, as indicated. A p value < 0.05 was considered as statistically significant. Sample size was calculated based on the variability observed in preliminary experiments and power analysis using GPower 3.1 software.
2.10. Role of Funding Source
This work was supported by grants from the Fonds National de la Recherche Scientifique (FNRS), Belgium (T.0036.13 (14505023)), the Communauté Française de Belgique-Actions de Recherche Concertées (ARC) (20063), the Spanish Ministry of Economy and Competitiveness (BFU2013-42789-P), the European Union (277713) (project BetaBat in the Framework Programme 7 of the European Community) and the Juvenile Diabetes Foundation International (JDFI) (3-SRA-2014-32-S-B). LM is supported by a FNRS post-doctoral fellowship. None of these funding sources have any role in the writing of the manuscript or decision to submit it for publication.
3. Results
3.1. Human β but not α Cells from T2D Patients Have Increased Apoptosis
To evaluate the impact of the diabetic state on the viability of α and β cells, electron microscopy (EM) studies were performed in pancreas samples from 8 non-diabetic and 9 T2D donors (described in Materials and Methods). β and α cells were identified by the ultrastructural characteristics of the insulin and glucagon granules, respectively (Orci, 1985). Furthermore, immunogold labeling in pancreatic sections from 3 different T2D donors and controls was accomplished as described (Zuber et al., 2005) to confirm cell identification (Fig. S1). Interestingly, immunogold identified insulin also in apoptotic β cells (Fig. S2). Overall, 1638 and 1578 islet cells were analyzed by EM in non-diabetic and T2D samples, respectively. β cells with signs of apoptosis were 0.4 ± 0.2%, 5 of 1114 β cells in control islets and 6.0 ± 1.3%, 50 of 836 T2D β cells (p < 0.01). No apoptotic α cells were seen in 505 T2D α cells and 444 control α cells. Representative pictures are shown in Fig. 1A. Interestingly, both β and α cells from T2D islets had increased ER volume density (Fig. S3), which is a hallmark of the unfolded protein response (UPR; the response to ER stress) (Marchetti et al., 2007). The values (in ml%) were: β cell ER, non-diabetic 1.2 ± 0.1 and T2D 3.1 ± 0.4 (p < 0.05); α cell ER, non-diabetic 1.3 ± 0.6 and T2D 4.5 ± 0.6 (p < 0.05). There was also a nearly 2-fold increase in mitochondrial volume density in both cell types (data not shown).
Fig. 1.

Human α cells are resistant to apoptosis compared to β cells both in T2D patients and following exposure to palmitate.
Representative images of β (left panels) and α cells (right panels) from non-diabetic (A, CTRL) or T2D donors (A, T2D), and islets exposed or not (B, CTRL) to palmitate (B, PALM). N: nucleus; IG: insulin granules; GG: glucagon granules; CC: chromatin condensation (a sign of apoptosis).
3.2. Lipotoxic Stress Induces Apoptosis in Human β but not α Cells
To evaluate whether the increase in apoptosis and ER volume density was caused by metabolic stress, human islets were exposed to the saturated FFA palmitate for 48 h (Cnop et al., 2014, Cunha et al., 2008). Similar to the observations in T2D islets, palmitate induced β cell apoptosis (4.0 ± 0.6% of 279 β cells vs 0.9 ± 0.1% of 439 β cells for respectively palmitate-treated and control, p < 0.01), but not α cell apoptosis (none detected in 156 palmitate-exposed and 189 control α cells). Representative pictures are shown in Fig. 1B. In both cell types palmitate increased ER volume density (in ml%): β cell ER, control 0.6 ± 0.1 and palmitate-treated 3.9 ± 0.6 (p < 0.01); α cell ER, control 1.3 ± 0.2 and palmitate-treated 4.3 ± 0.9 (p < 0.01) (Fig. S3). There was also a 1.5-fold increase in mitochondrial volume density in both cell types (data not shown).
3.3. Rat α Cells Exposed to Palmitate Express Markers of ER Stress but are Resistant to Apoptosis
To clarify the mechanisms of α cell resistance to palmitate-induced apoptosis, we developed a method to FACS-purify and culture rat α cells (Fig. 2 and Fig. S4). This method, based on single step FACS-sorting of α and β cells, has points in common to a recently described method (Kohler et al., 2012), but was developed independently. Because of the high fluorescence of human β cells due to marked lipofuscin accumulation (Cnop et al., 2010), this approach works well in our hands for rat (present data) but not for human islets (unpublished data).
Fig. 2.

Purity and viability of the rat β and α cell fractions after single-step FACS purification. (A) FACS analysis of dispersed pancreatic islet cells based on the FAD fluorescence and SSC-W (side scatter-width) intensity at 2.8 mM of glucose. The subpopulation with high autofluorescence and high SSC-W represents the β cells, whereas the α cells show a lower granularity and FAD content. (B and C) Immunostaining for insulin or glucagon of the rat islet cell preparations used in this study. (B) Representative images of β and α cell fractions immunostained for insulin (red) and glucagon (green). (C) Percentage of insulin- and glucagon-positive cells in the β and α cell preparations. (D) Cell viability was evaluated by staining the β and α cells with the nuclear dyes Hoechst 33342 and propidium iodide after 4 days in culture. Results of B–D are means ± SEM of 20 independent preparations. (E–F) Expression of specific β and α cell markers in the FACS-purified β and α cell fractions. Insulin (Ins2) (E), glucagon (Gcg) (F), Pdx1(G) and Arx (H) mRNA expressions were assayed by real-time PCR and normalized to the reference gene Gapdh. The boxes indicate lower quartile, median, and higher quartile; whiskers represent the range of remaining data points. Results of 5 independent experiments; *p < 0.05, **p < 0.01 and ***p < 0.001 α vs. β cells; Student's t-test.
The β and α cell fractions were > 90% pure (by immunostaining for insulin and glucagon, Fig. 2B and C) and retained 80–90% viability during culture (Figs. 2D and 3A). Cell purity was confirmed by specific gene expression signatures, with highly abundant expression of Ins2 and Pdx1 in β cells and greatly enriched Gcg and Arx expressions in α cells (Fig. 2E–H).
Fig. 3.

Rat α cells are resistant to palmitate-induced apoptosis compared to β cells. (A–D) FACS-purified rat α and β cells (purity ˃90% for both) were left untreated or treated with palmitate for 24 h. (A) Apoptosis was evaluated by staining with Hoechst 33342 and propidium iodide. Hspa5 (BiP) (B), Ddit3 (CHOP) (C) and Xbp1S (D) mRNA expressions were assayed by real-time PCR. Results of 6 (α cells) and 4 (β cells) independent experiments; *p < 0.05 and ***p < 0.001 treated vs. untreated; #p < 0.05, ##p < 0.01 and ###p < 0.001 as indicated; ANOVA followed by Student's t-test with Bonferroni correction.
Exposure of FACS-purified rat β and α cells to palmitate induced a response similar to that of human islets. Palmitate increased β cell apoptosis by 3-fold, but did not augment α cell death (Fig. 3A). In a separate series of experiments, we exposed α cells to palmitate in the presence of different glucose concentrations, namely 6.1 mM (similar to the Fig. 3A), 11 mM and 20 mM of glucose. There was again no palmitate-induced increase in apoptosis for α cells, while values of β cell apoptosis evaluated in parallel showed a similar fold-increase in palmitate-induced apoptosis (Fig. S5) as in Fig. 3A. As previously described (Gremlich et al., 1997), palmitate increased α cell glucagon secretion by 5-fold (μg glucagon/106 cells × 24 h; control, 48 ± 5; palmitate-treated, 261 ± 26, p < 0.001, n = 12). Both β and α cells showed induction of the ER stress markers Ddit3 (Chop) and Xbp1s (Fig. 3C and D), but this increase was more marked in α cells, particularly for the ER chaperone Hspa5 (BIP) (Fig. 3B). Thus, α cells are affected by palmitate and trigger an ER stress response. Differently from β cells, however, they do not undergo apoptosis, in keeping with the observations for α cells from T2D patients.
3.4. FACS-Purified rat α and β Cells are Equally Susceptible to Apoptosis Induced by Chemical ER Stressors
These results could potentially be explained by a broad resistance of α cells to ER stress, as a result of the marked induction of the ER chaperone Hspa5 in stressed cells (Fig. 3B). To test this hypothesis, α and β cells were exposed to three different chemical ER stressors, namely cyclopiazonic acid (CPA, a reversible inhibitor of sarcoplasmic reticulum Ca2 +-ATPase), tunicamycin (an inhibitor of protein glycosylation) or brefeldin A (BFA, an inhibitor of ER-to-Golgi vesicle transport). All three stressors similarly induced apoptosis in α and β cells, in spite of the higher Hspa5 induction in α cells following exposure to CPA and tunicamycin, but not to BFA (Figs. S6, S7 and S8). These findings indicate that α cells have a particular resistance to metabolic stress and the in vivo T2D situation, but no general resistance to chemical ER stress.
3.5. FACS-Purified rat α Cells Have an Increased Expression of the Anti-Apoptotic Protein Bcl2l1
We have previously shown that palmitate triggers β cell apoptosis via activation of the BH3-only proteins Hrk (DP5) and Bbc3 (PUMA) (Cunha et al., 2012). Surprisingly, α cells showed increased expression of both Hrk and Bbc3 as compared to β cells (Fig. 4A and B). The pro-apoptotic effects of BH3-only proteins can be overruled by anti-apoptotic Bcl2 proteins such as Bcl2 and Bcl2l1 (Gurzov and Eizirik, 2011). α Cells showed increased expression of the mRNAs encoding for these proteins as compared to β cells, both basally and following palmitate exposure (Fig. 4C and D). The increased Bcl2l1 expression in α cells was confirmed at the protein level (Fig. 5A). We next evaluated whether Bcl2l1 silencing with a previously validated siRNA (Miani et al., 2013) would abrogate the resistance of α cells to palmitate. The siRNA decreased by > 10-fold Bcl2l1 mRNA and protein expression (Fig. 5B and C). Bcl2l1 knockdown did not increase basal α cell apoptosis (Fig. 5D), but it markedly sensitized the cells to palmitate. Indeed, palmitate induced a similar rate of apoptosis in Bcl2l1-deficient α cells (nearly 30%; Fig. 5D) compared to β cells (Fig. 3A), indicating that the high Bcl2l1 expression in α cells plays a major role in the resistance of these cells to metabolic stress-induced apoptosis. On the other hand, knockdown of Bcl2 did not sensitize α cells to palmitate-induced apoptosis (Fig. S9), suggesting that the protection observed in α cells is mainly due to increased Bcl2l1 expression.
Fig. 4.

Expression of Bcl2 family proteins in α and β cells upon palmitate exposure. (A–D) FACS-purified α and β cells (purity ˃90% for both cell types) were left untreated or treated with palmitate for 24 h. Hrk (DP5) (A), Bbc3 (PUMA) (B), Bcl2 (C) and Bcl2l1 (D) mRNA expressions were assayed by real-time PCR. Results of 6 (α cells) and 4 (β cells) independent experiments; *p < 0.05 treated vs. untreated; #p < 0.05 and ##p < 0.01 as indicated; ANOVA followed by Student's t-test with Bonferroni correction.
Fig. 5.

Bcl2l1 inhibition sensitizes α cells to lipotoxicity. (A) Expression of Bcl2l1 protein in α and β cells upon palmitate exposure. FACS-purified α and β cells (purity ˃90% for both cell types) were left untreated or treated with palmitate for 24 h. The figure shows a representative Western blot of Bcl2l1 and α-tubulin. (B–D) FACS-purified α cells (purity ˃90%) were transfected with siCTRL or siBcl2l1. After 48 h of recovery they were left untreated or treated with palmitate for 24 h. (B and C) Bcl2l1 knockdown was evaluated by real-time PCR (B) or Western blot (C) and normalized to the reference gene Gapdh (B) or the loading control α-tubulin (C). (D) Apoptosis was evaluated by staining with Hoechst 33342 and propidium iodide. Results of 4 independent experiments; ***p < 0.001 treated vs. untreated; #p < 0.05 and ##p < 0.01 as indicated; ANOVA followed by Student's t-test with Bonferroni correction.
4. Discussion
The molecular mechanisms that lead to increased glucagon and decreased insulin levels in T2D remain to be clarified. β Cell failure is, at least in part, related to progressive β cell loss (Butler et al., 2003, Mizukami et al., 2014, Rahier et al., 2008). It is unclear whether α cell viability is affected by the long-term metabolic stress inherent to the disease.
We presently observed increased β but not α cell apoptosis in islets from T2D patients. Both α and β cells from T2D patients presented an increased ER area, a phenomenon previously shown by us (Marchetti et al., 2007) to be part of the UPR (Marciniak and Ron, 2006). These findings indicate that both α and β cells face chronic ER stress, but while α cells adapt and even increase hormone production, β cells fail and eventually undergo apoptosis. This is supported by observations in genetically modified mice. α Cell-specific Xbp1 deletion increases ER stress without affecting α cell survival, but Xbp1-deficient α cells cannot suppress glucagon secretion after glucose stimulation (Akiyama et al., 2013). In contrast, β cell-specific Xbp1 deletion impairs glucose-stimulated insulin secretion and leads to β cell loss (Lee et al., 2011).
The α cell resistance to apoptosis was reproduced when human islets or FACS-purified rat α and β cells were exposed in vitro to palmitate, the most common circulating saturated FFA that is thought to contribute to β cell failure and T2D (Forouhi et al., 2014, Paolisso et al., 1995): in both cases, palmitate activated the UPR, but only β cells underwent apoptosis, indicating that α cells are well equipped to survive metabolic ER stress. These differences in palmitate-induced apoptosis between α and β cells were confirmed at three different glucose concentrations, i.e. 6.1 mM, 10 mM and 20 mM. Marked eIF2α phosphorylation was shown in α cells of high fat diet-induced or genetically obese mice (Engin et al., 2014); in β cells, hyperactivation of this branch of the UPR is particularly cytotoxic (Cnop et al., 2007). This phenomenon is not part of a broad and non-specific resistance of α cells to apoptosis, since these cells showed similar susceptibility as β cells to apoptosis triggered by chemical ER stressors.
Our findings fit with the report of detectable β cell apoptosis but absence of α cell apoptosis in baboons with different degrees of hyperglycemia and islet amyloidosis (Guardado-Mendoza et al., 2009). In a large human study, pancreatic α cell mass was shown to be similar in non-diabetic and T2D subjects, while β cell mass was decreased in T2D (Henquin and Rahier, 2011), resulting in a 1.7-fold increased α/β cell ratio in diabetic subjects.
Palmitate triggers β cell death via induction of ER and oxidative stress (Cunha et al., 2008, Carlsson et al., 1999, Karaskov et al., 2006, Kharroubi et al., 2004). This culminates in activation of the intrinsic pathway of apoptosis, which is regulated by a delicate balance between pro- and anti-apoptotic Bcl2 family members (Gurzov and Eizirik, 2011). Compared to β cells, α cells express higher levels of the two anti-apoptotic proteins Bcl2 and Bcl2l1. Bcl2l1 is a key anti-apoptotic protein in β cells (Miani et al., 2013), and we presently demonstrate that Bcl2l1, and not Bcl2, silencing sensitizes α cells to palmitate-induced apoptosis, which reaches levels similar to that in β cells, suggesting a key role for Bcl2l1. We cannot exclude, however, that other mechanisms behind Bcl2l1 contribute to the observed α cell resistance.
In conclusion, the present findings show that human and rat pancreatic α cells are specifically resistant to metabolic stress-induced apoptosis. This resistance is due, at least in part, to the enhanced expression of anti-apoptotic proteins, which render α cells resistant to palmitate- and T2D-related ER stress. These observations suggest the intriguing hypothesis that the recently described β to α cell transdifferentiation in T2D (Gao et al., 2014, Talchai et al., 2012, White et al., 2013) is a defense mechanism to avoid metabolic stress-induced apoptosis.
Author Contributions
DLE, LM, MC, PM and IQ contributed to the original idea, the design and interpretation of the experiments. LM, MM, BM, FAG, IM, and CD researched data and contributed to their interpretation. DLE wrote the manuscript. MC and LM contributed to the writing, and all co-authors revised, edited and approved the manuscript. DLE is the guarantor of this work and, as such, had full access to all the data in the study and takes responsibility for the integrity of the data and the accuracy of the data analysis.
Acknowledgments
The authors thank Anyishai Musuaya, Stephanie Mertens and Michael Pangerl from the ULB Center for Diabetes Research, Université Libre de Bruxelles, for excellent technical support. We are grateful to the flow cytometry facility of the Erasmus Campus of the ULB.
No potential conflicts of interest relevant to this article were reported.
Footnotes
Supplementary data to this article can be found online at http://dx.doi.org/10.1016/j.ebiom.2015.03.012.
Appendix A. Supplementary Data
Supplementary material.
References
- Akiyama M., Liew C.W., Lu S., Hu J., Martinez R., Hambro B., Kennedy R.T., Kulkarni R.N. X-box binding protein 1 is essential for insulin regulation of pancreatic α cell function. Diabetes. 2013;62:2439–2449. doi: 10.2337/db12-1747. [DOI] [PMC free article] [PubMed] [Google Scholar]
- Butler A.E., Janson J., Bonner-Weir S., Ritzel R., Rizza R.A., Butler P.C. β cell deficit and increased β cell apoptosis in humans with type 2 diabetes. Diabetes. 2003;52:102–110. doi: 10.2337/diabetes.52.1.102. [DOI] [PubMed] [Google Scholar]
- Carlsson C., Borg L.A., Welsh N. Sodium palmitate induces partial mitochondrial uncoupling and reactive oxygen species in rat pancreatic islets in vitro. Endocrinology. 1999;140:3422–3428. doi: 10.1210/endo.140.8.6908. [DOI] [PubMed] [Google Scholar]
- Cnop M., Hannaert J.C., Hoorens A., Eizirik D.L., Pipeleers D.G. Inverse relationship between cytotoxicity of free fatty acids in pancreatic islet cells and cellular triglyceride accumulation. Diabetes. 2001;50:1771–1777. doi: 10.2337/diabetes.50.8.1771. [DOI] [PubMed] [Google Scholar]
- Cnop M., Ladriere L., Hekerman P., Ortis F., Cardozo A.K., Dogusan Z., Flamez D., Boyce M., Yuan J., Eizirik D.L. Selective inhibition of eukaryotic translation initiation factor 2 α dephosphorylation potentiates fatty acid-induced endoplasmic reticulum stress and causes pancreatic β cell dysfunction and apoptosis. J. Biol. Chem. 2007;282:3989–3997. doi: 10.1074/jbc.M607627200. [DOI] [PubMed] [Google Scholar]
- Cnop M., Hughes S.J., Igoillo-Esteve M., Hoppa M.B., Sayyed F., van de Laar L., Gunter J.H., de Koning E.J., Walls G.V., Gray D.W., Johnson P.R., Hansen B.C., Morris J.F., Pipeleers-Marichal M., Cnop I., Clark A. The long lifespan and low turnover of human islet β cells estimated by mathematical modelling of lipofuscin accumulation. Diabetologia. 2010;53:321–330. doi: 10.1007/s00125-009-1562-x. [DOI] [PubMed] [Google Scholar]
- Cnop M., Abdulkarim B., Bottu G., Cunha D.A., Igoillo-Esteve M., Masini M., Turatsinze J.V., Griebel T., Villate O., Santin I., Bugliani M., Ladriere L., Marselli L., McCarthy M.I., Marchetti P., Sammeth M., Eizirik D.L. RNA sequencing identifies dysregulation of the human pancreatic islet transcriptome by the saturated fatty acid palmitate. Diabetes. 2014;63:1978–1993. doi: 10.2337/db13-1383. [DOI] [PubMed] [Google Scholar]
- Cunha D.A., Hekerman P., Ladriere L., Bazarra-Castro A., Ortis F., Wakeham M.C., Moore F., Rasschaert J., Cardozo A.K., Bellomo E., Overbergh L., Mathieu C., Lupi R., Hai T., Herchuelz A., Marchetti P., Rutter G.A., Eizirik D.L., Cnop M. Initiation and execution of lipotoxic ER stress in pancreatic β cells. J. Cell Sci. 2008;121:2308–2318. doi: 10.1242/jcs.026062. [DOI] [PMC free article] [PubMed] [Google Scholar]
- Cunha D.A., Igoillo-Esteve M., Gurzov E.N., Germano C.M., Naamane N., Marhfour I., Fukaya M., Vanderwinden J.M., Gysemans C., Mathieu C., Marselli L., Marchetti P., Harding H.P., Ron D., Eizirik D.L., Cnop M. Death protein 5 and p53-upregulated modulator of apoptosis mediate the endoplasmic reticulum stress-mitochondrial dialog triggering lipotoxic rodent and human β cell apoptosis. Diabetes. 2012;61:2763–2775. doi: 10.2337/db12-0123. [DOI] [PMC free article] [PubMed] [Google Scholar]
- D'Alessio D. The role of dysregulated glucagon secretion in type 2 diabetes. Diabetes Obes. Metab. 2011;13(Suppl. 1):126–132. doi: 10.1111/j.1463-1326.2011.01449.x. [DOI] [PubMed] [Google Scholar]
- Engin F., Nguyen T., Yermalovich A., Hotamisligil G.S. Aberrant islet unfolded protein response in type 2 diabetes. Sci. Rep. 2014;4:4054. doi: 10.1038/srep04054. [DOI] [PMC free article] [PubMed] [Google Scholar]
- Fiori J.L., Shin Y.K., Kim W., Krzysik-Walker S.M., Gonzalez-Mariscal I., Carlson O.D., Sanghvi M., Moaddel R., Farhang K., Gadkaree S.K., Doyle M.E., Pearson K.J., Mattison J.A., de C.R., Egan J.M. Resveratrol prevents β cell dedifferentiation in nonhuman primates given a high-fat/high-sugar diet. Diabetes. 2013;62:3500–3513. doi: 10.2337/db13-0266. [DOI] [PMC free article] [PubMed] [Google Scholar]
- Forouhi N.G., Koulman A., Sharp S.J., Imamura F., Kroger J., Schulze M.B., Crowe F.L., Huerta J.M., Guevara M., Beulens J.W., van Woudenbergh G.J., Wang L., Summerhill K., Griffin J.L., Feskens E.J., Amiano P., Boeing H., Clavel-Chapelon F., Dartois L., Fagherazzi G., Franks P.W., Gonzalez C., Jakobsen M.U., Kaaks R., Key T.J., Khaw K.T., Kuhn T., Mattiello A., Nilsson P.M., Overvad K., Pala V., Palli D., Quiros J.R., Rolandsson O., Roswall N., Sacerdote C., Sanchez M.J., Slimani N., Spijkerman A.M., Tjonneland A., Tormo M.J., Tumino R., van der A.D., van der Schouw Y.T., Langenberg C., Riboli E., Wareham N.J. Differences in the prospective association between individual plasma phospholipid saturated fatty acids and incident type 2 diabetes: the EPIC-InterAct case-cohort study. Lancet Diabetes Endocrinol. 2014;2:810–818. doi: 10.1016/S2213-8587(14)70146-9. [DOI] [PMC free article] [PubMed] [Google Scholar]
- Gao T., McKenna B., Li C., Reichert M., Nguyen J., Singh T., Yang C., Pannikar A., Doliba N., Zhang T., Stoffers D.A., Edlund H., Matschinsky F., Stein R., Stanger B.Z. Pdx1 maintains β cell identity and function by repressing an α cell program. Cell Metab. 2014;19:259–271. doi: 10.1016/j.cmet.2013.12.002. [DOI] [PMC free article] [PubMed] [Google Scholar]
- Gremlich S., Bonny C., Waeber G., Thorens B. Fatty acids decrease IDX-1 expression in rat pancreatic islets and reduce GLUT2, glucokinase, insulin, and somatostatin levels. J. Biol. Chem. 1997;272:30261–30269. doi: 10.1074/jbc.272.48.30261. [DOI] [PubMed] [Google Scholar]
- Guardado-Mendoza R., Davalli A.M., Chavez A.O., Hubbard G.B., Dick E.J., Majluf-Cruz A., Tene-Perez C.E., Goldschmidt L., Hart J., Perego C., Comuzzie A.G., Tejero M.E., Finzi G., Placidi C., La R.S., Capella C., Halff G., Gastaldelli A., DeFronzo R.A., Folli F. Pancreatic islet amyloidosis, β cell apoptosis, and α cell proliferation are determinants of islet remodeling in type-2 diabetic baboons. Proc. Natl. Acad. Sci. U. S. A. 2009;106:13992–13997. doi: 10.1073/pnas.0906471106. [DOI] [PMC free article] [PubMed] [Google Scholar]
- Gurzov E.N., Eizirik D.L. Bcl-2 proteins in diabetes: mitochondrial pathways of β cell death and dysfunction. Trends Cell Biol. 2011;21:424–431. doi: 10.1016/j.tcb.2011.03.001. [DOI] [PubMed] [Google Scholar]
- Henquin J.C., Rahier J. Pancreatic α cell mass in European subjects with type 2 diabetes. Diabetologia. 2011;54:1720–1725. doi: 10.1007/s00125-011-2118-4. [DOI] [PMC free article] [PubMed] [Google Scholar]
- IDF Diabetes Atlas International Diabetes Federation. 2013. http://www.idf.org/sites/default/files/EN_6E_Atlas_Full_0.pdf (Ref Type: Online Source)
- Karaskov E., Scott C., Zhang L., Teodoro T., Ravazzola M., Volchuk A. Chronic palmitate but not oleate exposure induces endoplasmic reticulum stress, which may contribute to INS-1 pancreatic β cell apoptosis. Endocrinology. 2006;147:3398–3407. doi: 10.1210/en.2005-1494. [DOI] [PubMed] [Google Scholar]
- Kharroubi I., Ladriere L., Cardozo A.K., Dogusan Z., Cnop M., Eizirik D.L. Free fatty acids and cytokines induce pancreatic β cell apoptosis by different mechanisms: role of NFκB and endoplasmic reticulum stress. Endocrinology. 2004;145:5087–5096. doi: 10.1210/en.2004-0478. [DOI] [PubMed] [Google Scholar]
- Kohler M., Dare E., Ali M.Y., Rajasekaran S.S., Moede T., Leibiger B., Leibiger I.B., Tibell A., Juntti-Berggren L., Berggren P.O. One-step purification of functional human and rat pancreatic α cells. Integr. Biol. (Camb.) 2012;4:209–219. doi: 10.1039/c2ib00125j. [DOI] [PubMed] [Google Scholar]
- Lee A.H., Heidtman K., Hotamisligil G.S., Glimcher L.H. Dual and opposing roles of the unfolded protein response regulated by IRE1α and Xbp1 in proinsulin processing and insulin secretion. Proc. Natl. Acad. Sci. U. S. A. 2011;108:8885–8890. doi: 10.1073/pnas.1105564108. [DOI] [PMC free article] [PubMed] [Google Scholar]
- Marchetti P., Bugliani M., Lupi R., Marselli L., Masini M., Boggi U., Filipponi F., Weir G.C., Eizirik D.L., Cnop M. The endoplasmic reticulum in pancreatic β cells of type 2 diabetes patients. Diabetologia. 2007;50:2486–2494. doi: 10.1007/s00125-007-0816-8. [DOI] [PubMed] [Google Scholar]
- Marciniak S.J., Ron D. Endoplasmic reticulum stress signaling in disease. Physiol. Rev. 2006;86:1133–1149. doi: 10.1152/physrev.00015.2006. [DOI] [PubMed] [Google Scholar]
- Masini M., Bugliani M., Lupi R., Del G.S., Boggi U., Filipponi F., Marselli L., Masiello P., Marchetti P. Autophagy in human type 2 diabetes pancreatic β cells. Diabetologia. 2009;52:1083–1086. doi: 10.1007/s00125-009-1347-2. [DOI] [PubMed] [Google Scholar]
- Miani M., Barthson J., Colli M.L., Brozzi F., Cnop M., Eizirik D.L. Endoplasmic reticulum stress sensitizes pancreatic β cells to IL1β-induced apoptosis via Bim/A1 imbalance. Cell Death Dis. 2013;4:e701. doi: 10.1038/cddis.2013.236. [DOI] [PMC free article] [PubMed] [Google Scholar]
- Mizukami H., Takahashi K., Inaba W., Tsuboi K., Osonoi S., Yoshida T., Yagihashi S. Involvement of oxidative stress-induced DNA damage, endoplasmic reticulum stress, and autophagy deficits in the decline of β cell mass in Japanese type 2 diabetic patients. Diabetes Care. 2014;37:1966–1974. doi: 10.2337/dc13-2018. [DOI] [PubMed] [Google Scholar]
- Moore F., Cunha D.A., Mulder H., Eizirik D.L. Use of RNA interference to investigate cytokine signal transduction in pancreatic β cells. Methods Mol. Biol. 2012;820:179–194. doi: 10.1007/978-1-61779-439-1_11. [DOI] [PubMed] [Google Scholar]
- Niederwanger A., Ciardi C., Tatarczyk T., Khan M.I., Hermann M., Mittermair C., Al-Zoairy R., Salzmann K., Pedrini M.T. Postprandial lipemia induces pancreatic α cell dysfunction characteristic of type 2 diabetes: studies in healthy subjects, mouse pancreatic islets, and cultured pancreatic α cells. Am. J. Clin. Nutr. 2014;100:1222–1231. doi: 10.3945/ajcn.114.092023. [DOI] [PubMed] [Google Scholar]
- Orci L. The insulin factory: a tour of the plant surroundings and a visit to the assembly line. The Minkowski lecture 1973 revisited. Diabetologia. 1985;28:528–546. doi: 10.1007/BF00281987. [DOI] [PubMed] [Google Scholar]
- Overbergh L., Valckx D., Waer M., Mathieu C. Quantification of murine cytokine mRNAs using real time quantitative reverse transcriptase PCR. Cytokine. 1999;11:305–312. doi: 10.1006/cyto.1998.0426. [DOI] [PubMed] [Google Scholar]
- Paolisso G., Tataranni P.A., Foley J.E., Bogardus C., Howard B.V., Ravussin E. A high concentration of fasting plasma non-esterified fatty acids is a risk factor for the development of NIDDM. Diabetologia. 1995;38:1213–1217. doi: 10.1007/BF00422371. [DOI] [PubMed] [Google Scholar]
- Pipeleers D.G., in't Veld P.A., Van de Winkel M., Maes E., Schuit F.C., Gepts W. A new in vitro model for the study of pancreatic A and B cells. Endocrinology. 1985;117:806–816. doi: 10.1210/endo-117-3-806. [DOI] [PubMed] [Google Scholar]
- Poitout V., Robertson R.P. Glucolipotoxicity: fuel excess and β cell dysfunction. Endocr. Rev. 2008;29:351–366. doi: 10.1210/er.2007-0023. [DOI] [PMC free article] [PubMed] [Google Scholar]
- Rahier J., Guiot Y., Goebbels R.M., Sempoux C., Henquin J.C. Pancreatic β cell mass in European subjects with type 2 diabetes. Diabetes Obes. Metab. 2008;10(Suppl. 4):32–42. doi: 10.1111/j.1463-1326.2008.00969.x. [DOI] [PubMed] [Google Scholar]
- Rasschaert J., Ladriere L., Urbain M., Dogusan Z., Katabua B., Sato S., Akira S., Gysemans C., Mathieu C., Eizirik D.L. Toll-like receptor 3 and STAT-1 contribute to double-stranded RNA + IFNγ-induced apoptosis in primary pancreatic β cells. J. Biol. Chem. 2005;280:33984–33991. doi: 10.1074/jbc.M502213200. [DOI] [PubMed] [Google Scholar]
- Shimabukuro M., Higa M., Zhou Y.T., Wang M.Y., Newgard C.B., Unger R.H. Lipoapoptosis in β cells of obese prediabetic fa/fa rats. Role of serine palmitoyltransferase overexpression. J. Biol. Chem. 1998;273:32487–32490. doi: 10.1074/jbc.273.49.32487. [DOI] [PubMed] [Google Scholar]
- Talchai C., Xuan S., Lin H.V., Sussel L., Accili D. Pancreatic β cell dedifferentiation as a mechanism of diabetic β cell failure. Cell. 2012;150:1223–1234. doi: 10.1016/j.cell.2012.07.029. [DOI] [PMC free article] [PubMed] [Google Scholar]
- Teitelman G., Alpert S., Polak J.M., Martinez A., Hanahan D. Precursor cells of mouse endocrine pancreas coexpress insulin, glucagon and the neuronal proteins tyrosine hydroxylase and neuropeptide Y, but not pancreatic polypeptide. Development. 1993;118:1031–1039. doi: 10.1242/dev.118.4.1031. [DOI] [PubMed] [Google Scholar]
- White M.G., Marshall H.L., Rigby R., Huang G.C., Amer A., Booth T., White S., Shaw J.A. Expression of mesenchymal and α cell phenotypic markers in islet β cells in recently diagnosed diabetes. Diabetes Care. 2013;36:3818–3820. doi: 10.2337/dc13-0705. [DOI] [PMC free article] [PubMed] [Google Scholar]
- Zuber C., Fan J., Guhl B., Roth J. Applications of immunogold labeling in ultrastructural pathology. Ultrastruct. Pathol. 2005;29:319–330. doi: 10.1080/01913120590951310. [DOI] [PubMed] [Google Scholar]
Associated Data
This section collects any data citations, data availability statements, or supplementary materials included in this article.
Supplementary Materials
Supplementary material.