

Abstract
Grade IV glioblastoma is characterized by increased kinase activity of epidermal growth factor receptor (EGFR); however, EGFR kinase inhibitors have failed to improve survival in individuals with this cancer because resistance to these drugs often develops. We showed that tumor necrosis factor–α (TNFα) produced in the glioblastoma microenvironment activated atypical protein kinase C (aPKC), thereby producing resistance to EGFR kinase inhibitors. Additionally, we identified that aPKC was required both for paracrine TNFα-dependent activation of the transcription factor nuclear factor κB (NF-κB) and for tumor cell–intrinsic receptor tyrosine kinase signaling. Targeting aPKC decreased tumor growth in mouse models of glioblastoma, including models of EGFR kinase inhibitor–resistant glioblastoma. Furthermore, aPKC abundance and activity were increased in human glioblastoma tumor cells, and high aPKC abundance correlated with poor prognosis. Thus, targeting aPKC might provide an improved molecular approach for glioblastoma therapy.
INTRODUCTION
World Health Organization (WHO)–designated grade IV glioma or glioblastoma is a frequently occurring brain tumor with poor prognosis (1). The relative survival estimate for glioblastoma indicates that only 4.46% of patients diagnosed between 1995 and 2006 survived 5 years after the initial diagnosis (2, 3). Although strategies to improve the currently dismal survival of glioblastoma patients primarily involve identifying and targeting oncogenic signaling pathways (1, 4–6), the therapeutic success of such approaches, including inhibition of the kinase activity of epidermal growth factor receptor (EGFR), has been limited (7). The activation of additional receptor tyrosine kinases (RTKs) and/or downstream tumor-intrinsic mutations can provide oncogenic stimuli to glioblastoma tumor cells and accounts for EGFR kinase inhibitor resistance (7, 8). Identifying and targeting such pathways can improve therapeutic efficacy, although such efforts may require simultaneously disabling multiple, parallel oncogenic signals. The serine-threonine kinase atypical protein kinase C (aPKC) is activated downstream of multiple RTKs (9–11). aPKC regulates neural progenitor cell proliferation and migration during the embryonic development of the spinal cord (12). Abnormal activation and altered intracellular localization of aPKC in avian neuroepithelia results in increased proliferation, abnormal migration, and rosette-like structures reminiscent of brain tumors (12). Therefore, we hypothesized that the abnormal or unscheduled activation of the developmentally important aPKC signaling pathway may be associated with glioblastoma progression and that aPKC inhibition may be a potential therapeutic strategy in glioblastoma.
RESULTS
aPKC abundance inversely correlates with glioblastoma survival and targeting aPKC reduces tumor progression in a mouse model of glioblastoma that is resistant to EGFR kinase inhibitors
We examined the abundance of aPKC in human nontumor brain and glioblastoma tissue. Immunohistochemical staining of nontumor brain tissue sections revealed low aPKC staining in the brain parenchyma (Fig. 1A). Neurons showed some cytoplasmic staining (fig. S1A), and oligodendrocytes occasionally showed trace staining. In contrast, glioblastoma tumor cells showed strong aPKC staining (Fig. 1, B and C). The distribution of staining was consistent across variable histologic patterns that define glioblastoma, such as pseudopalisading necrosis (Fig. 1C and fig. S1B), areas of microvascular proliferation (fig. S1C), infiltrative single cells, clusters, and confluent cell sheets. Next, we stained tissue microarrays consisting of 330 glioblastoma cases. The aPKC staining was validated using both negative and positive staining on control cores of nonneoplastic cortical gray matter, white matter, cerebellum, placenta, testis, lung, liver, kidney, and tonsil within each tissue microarray. Within most but not all glioblastoma cores, tumor cells showed increased aPKC staining relative to nontumor cells. We compared aPKC staining in tumor cells to that of adjacent nontumor cells within each core and assigned a numerical score of 0, 1, 2, or 3 representing negative, weak positive, intermediate positive, or bright staining, respectively. Most glioblastomas were aPKC-positive, with approximately equal fractions being aPKC bright, intermediate positive, or weak positive. These findings suggest that aPKC abundance tends to be high in glioblastomas, although the abundance of aPKC between individual glioblastomas varied and glioblastomas could be stratified on the basis of aPKC intensity (Fig. 1D). Furthermore, staining a smaller set of glioblastoma samples (44 cases) with the aPKC activation–specific, phosphoThr410/403 antibody suggested that not only total protein abundance but also aPKC activity was high in glioblastomas (Fig. 1, E and F). The range of staining intensity for phosphorylated aPKC compared to that for total aPKC was somewhat reduced, which could be because the phosphorylation-specific antibodies have a lower affinity than the total aPKC antibody for their substrates.
Fig. 1. Clinical association and therapeutic efficacy of targeting aPKC in mouse models of glioblastoma.

(A to C) Representative immunohistochemistry showing that nontumor brain parenchyma shows low-intensity aPKC staining (A), whereas glioblastoma shows increased aPKC staining (B and C). Scale bar, 500 μm. (D) Stratification of 330 glioblastoma cases according to the immunohistochemical scores for aPKC staining. (E) Representative examples of aPKC phosphoThr410/403 staining in the glioblastoma tissue microarray. Scale bar, 500 μm. (F) Stratification of 44 glioblastoma cases according to immunohistochemical scores of aPKC phosphoThr410/403 staining. (G) Kaplan-Meier survival curve of 44 glioblastoma cases showing correlation of bright aPKC staining with poor survival in human patients (P = 0.0145). (H) Kaplan-Meier survival curves of mice bearing intracranial xenografts derived from U87/EGFRvIII cells stably transfected with control or aPKC shRNA (P = 0.0005). (I) Representative images (left) and tumor volume (right) of tumors derived from U87/EGFRvIII cells and U87/EGFRvIII cells with aPKC knockdown. Dashed lines circumscribe the tumor areas. Scale bar, 1 mm. (J and K) Tumor volume of intracranial xenografts derived from U87/EGFRvIII cells (J) or EGFR kinase inhibitor–insensitive GBM6 cells (K) in mice infused with PZ09 for 7 and 14 days, respectively. Data from (A) to (K) are presented as representative individual samples or as means ± SEM of at least three independent samples per group. *P < 0.05, **P < 0.01.
To further examine the clinical relevance of the intensity of aPKC staining in glioblastoma, we compared the association between aPKC immunoreactivity and survival. In a tissue microarray annotated with the survival data of the patients, 7 cases had no detectable aPKC staining, 17 cases had weak positive staining, and 20 cases showed bright aPKC staining. Statistical analyses demonstrated that the bright aPKC staining cases (median survival of 176.5 days) had a significantly shorter median survival than the aPKC-negative or weak positive cases (median survival of 413 and 532 days, respectively) (Fig. 1G). Statistically significant differences were not detected between the survival rates of the lower categories of aPKC intensity. Survival did not correlate with gender and age in the sampled population. Together, these results demonstrate that aPKC abundance is increased in glioblastoma and that there is a strong negative correlation between aPKC protein abundance and survival.
To assess the role of aPKC in glioblastoma progression in vivo, we performed orthotopic xenograft experiments in non-obese diabetic/severe combined immunodeficient (NOD/SCID) mice using U87 glioblastoma cells that express the constitutively active EGFRvIII mutation (U87/EGFRvIII cells) and U87/EGFRvIII cells in which both aPKC genes (PRKCZ and PRKCI) were silenced by a virally delivered short hairpin RNA (shRNA) (fig. S2A, table S2). Mice with orthotopic xenografts derived from U87/EGFRvIII cells with aPKC silencing had a longer median survival of 35 days, compared to the median survival of 11 days in mice with xenografts derived from control U87/EGFRvIII cells (Fig. 1H). Histopathological examination revealed that the tumors derived from U87/EGFRvIII cells expressing aPKC shRNA were significantly smaller than those derived from control U87/EGFRvIII cells (Fig. 1I). Subsequently, we tested the efficacy of a small-molecule, benzimidazole adenosine triphosphate–competitive aPKC inhibitor PZ09 (13) in inhibiting tumor growth in vivo. These experiments revealed that inhibition of aPKC reduced tumor volume by 64.68 ± 9.23% after 7 days of treatment (Fig. 1J).
Next, we tested the efficacy of aPKC inhibition in patient-derived, EGFR kinase inhibitor–resistant, orthotopic xenografts. Patient-derived GBM6 xenograft cells retain the clinically relevant biochemical characteristics of human glioblastoma, including EGFR amplification and the EGFRvIII mutation (14, 15), and are insensitive to the EGFR kinase inhibitor erlotinib (16). PZ09 effectively decreased aPKC activity in GBM6 cells in culture (fig. S2E), and the acute inhibition of aPKC by PZ09 significantly reduced tumor volume in orthotopic xenografts by 84.06 ± 6.27% (Fig. 1K). In summary, intracranial glioblastoma growth, including that of glioblastoma resistant to EGFR inhibition, was effectively suppressed by aPKC inhibition.
aPKC functions downstream of RTKs in glioblastoma
Both wild-type EGFR and EGFRvIII are frequently present in glioblastoma (17) and both EGFR subtypes were detected in GBM6 cells, although EGFRvIII appeared to be the predominant subtype according to reverse transcription polymerase chain reaction (RT-PCR) (fig. S3A). EGF stimulation activated aPKC in serum-starved GBM6 cells (Fig. 2A). Moreover, PZ09 treatment of GBM6 cells reduced EGF-induced expression of CD44, MMP9, and VCAM (Fig. 2B). Similarly, aPKC was phosphorylated when U251 cells stably expressing EGFR (U251/EGFR cells) were stimulated with EGF (Fig. 2C). aPKC silencing by short interfering RNA (siRNA) in U251/EGFR cells (fig. S2B, table S2) also reduced the expression of EGF-induced genes (Fig. 2D). EGFR was phosphorylated with faster kinetics than aPKC in both GBM6 and U251/EGFR cells (fig. S3, B and C), suggesting the possibility that aPKC is an indirect downstream target of EGFR. These results indicate that aPKC mediates EGFR signaling in glioblastoma. Our findings are consistent with the reported function of this kinase downstream of EGFR family in tumor progression in breast cancer and squamous cell carcinomas of head and neck (10, 18). aPKC was also activated downstream of activated Ras, phosphatidylinositol 3-kinase (PI3K), and Src (Fig. 2E). EGFR kinase inhibitor resistance is often associated with PTEN mutations (7). Furthermore, EGFR kinase inhibitors can be rendered ineffective by the simultaneous activation of multiple RTKs in glioblastoma (19) or the activation of compensatory pathways, such as the transcriptional activation of Met in mouse models of EGFR kinase inhibitor–resistant glioblastoma (20). Because aPKC functions further downstream of PTEN (21–23) and participates in signaling downstream of Ras and Src (24–26), aPKC may function downstream of multiple RTKs and therefore may be a more attractive target than EGFR in glioblastoma.
Fig. 2. aPKC is activated downstream of tumor-intrinsic oncogenic RTK signaling pathways.

(A) Activation of aPKC in GBM6 cells after EGF treatment for the indicated times. Active aPKC was detected after aPKC immunoprecipitation followed by aPKC phosphoThr410/403 immunoblotting. The blot was stripped and reprobed with aPKC. Representative (left) and quantified data from all experiments (right) are presented. (B) Expression of the indicated genes in GBM6 cells upon treatment with EGF alone or in the presence of PZ09 or erlotinib, as detected by RT-qPCR and normalized to GBM6 control cells. (C) Activation of aPKC in U251/EGFR cells after EGF treatment for the indicated times. (D) Expression of the indicated genes in U251/EGFR cells, U251/EGFR cells treated with erlotinib, or U251/EGFR cells transfected with aPKC siRNA and treated with EGF, as detected by RT-qPCR and normalized to U251/EGFR control cells. (E) Activation of aPKC in U251/EGFR cells after transfection with vector alone or active Ras (H-RasV12), active PI3K (CAAXp110), or active Src (v-Src). Data for (A) to (E) are presented as representative images or as means ± SEM of at least three independent experiments. *P < 0.05, **P < 0.01, ***P < 0.001.
Tumor necrosis factor–α functions as a paracrine oncogenic signal in glioblastoma
Paracrine factors and the induction of EGFR-independent, parallel oncogenic signals through non–cell-autonomous mechanisms could also explain why EGFR kinase inhibitor fails in vivo and why aPKC inhibition is effective. For example, the tumor microenvironment plays a substantial role in influencing tumor progression (27–31). CD68+ macrophage or microglia cell infiltration was greater in the tumor area in glioblastoma tissue than in normal brain tissue in 37 of the 44 (~84%) cases examined (Fig. 3A). Mice with GBM6 cell–derived glioblastomas also showed increased staining for Iba1+ macrophage or microglia cells in the tumor (fig. S4A) compared to contralateral control regions (fig. S4B). Both classically activated (M1) macrophages and alternatively activated (M2) macrophages have been identified in the tumor microenvironment (32). Fluorescence-activated cell sorting (FACS) analysis of glioblastomainfiltrating macrophages or microglia in three independent glioblastoma cases showed that although the predominant population was of the M2 macrophage subtype (CD23+), a smaller population was of the M1 subtype (CD64+) (Fig. 3B). Proinflammatory cytokines such as tumor necrosis factor–α (TNFα) are produced by tumor-associated myeloid cells and promote tumor initiation and progression (33, 34). When activated, in vitro differentiated M1 and M2 macrophages secreted TNFα (fig. S4C), and TNFα was detectable in all glioblastoma tissues examined, but not in normal brain (44 cases) (Fig. 3C).
Fig. 3. Myeloid cells, TNFα, and NF-κB–dependent gene expression are detected in glioblastoma and favor progression.

(A) Representative images showing increased CD68+ staining in glioblastoma tissue in comparison to nontumor brain. Thirty-seven of 44 glioblastomas examined showed more intense CD68+ staining. Scale bar, 500 μm. (B) Representative FACS analysis and percentage of CD11b+CD64+ and CD11b+CD23+ tumor-infiltrating myeloid cells in three human glioblastomas. (C) Representative images showing increased TNFα staining in glioblastoma tissue in comparison to nontumor brain (n = 44). Scale bar, 500 μm. (D) NF-κB target gene profiling of primary human glioblastoma from two different patients and normal human astrocytes, as detected by RT-qPCR. Gene expression in glioblastoma cells was normalized to the gene expression in astrocytes. (E) Expression of NF-κB target genes in acutely isolated tissue from the side of NOD/SCID mouse brain bearing GBM6 cell–derived tumors in comparison to the contralateral, non–tumor-bearing brain as detected by RT-qPCR. n = 3 mice. (F) Kaplan-Meier survival curves for wild-type (WT) and TNFα−/− mice bearing GL261 cell–derived intracranial xenografts (P = < 0.0001). (G) Expression of NF-κB target genes in acutely isolated GL261 cell–derived tumor tissue from TNFα−/− and WT mice. n = 3 mice per genotype. **P < 0.01; ***P < 0.001; ns, nonsignificant.
Activation of the nuclear factor κB (NF-κB) pathway is a strong oncogenic signal in many tumors, including glioblastoma (35–42). The deletion of NFKBIA, which encodes the NF-κB inhibitor IκBα, occurs in about 20% of glioblastoma cases (43), and the activation of NF-κB, similar to EGFR gain of function, predicts poor prognosis in glioblastoma (43). However, the loss of IκBα overlaps with EGFR amplification in only 5% of glioblastoma cases, suggesting that these two independent tumor-intrinsic mutations do not occur simultaneously (43). Inflammatory signals in the tumor microenvironment such as TNFα commonly drives NF-κB activation in cancers such as colon cancer (36, 44, 45). Therefore, we tested whether NF-κB signaling was more active in glioblastomas with EGFR gain of mutation but without IκBα loss of function. Comparison of NFKBIA expression in two EGFR+ glioblastoma specimens revealed that NFKBIA expression was not reduced in comparison to normal human astrocytes. Furthermore, sequencing the exons identified that the loci contained synonymous substitutions, but no nonsynonymous mutations were detected in these samples (fig. S5). Quantitative RT-PCR (RT-qPCR) indicated that NF-κB target gene expression was higher in glioblastoma tumors than in normal human astrocytes (Fig. 3D). We also analyzed NOD/SCID mice bearing tumors derived from GBM6 cells and found that NF-κB–dependent gene activation was higher in the tumor side of the brain than in the contralateral, non–tumor-bearing side (Fig. 3E). Similarly, C57BL6 mice with tumors derived from GL261 mouse glioma cells showed increased NF-κB target gene expression in comparison to contralateral, non–tumor-bearing brain (fig. S4D). To validate the function of microenvironment-derived TNFα in glioblastoma tumor progression in vivo, we stereotactically injected C57BL6-derived GL261 mouse glioma cells into the caudate nucleus of either wild-type mice or mice lacking the TNFα gene (TNFα−/−). Mice with genetic ablation of TNFα survived significantly longer (median survival of 23 days) compared to wild-type mice (median survival of 16.5 days) (Fig. 3F). As anticipated, NF-κB target gene expression in tumor cells was significantly reduced in TNFα−/− mice (Fig. 3G). These results demonstrate that NF-κB signaling is active in glioblastoma, and suggest that it is likely driven by paracrine TNFα. This TNFα–NF-κB axis promotes glioblastoma progression and acts as an EGFR-independent oncogenic signal.
To test the role of myeloid cells and myeloid cell–derived factors, such as TNFα, on glioblastoma proliferation and invasion, we cocultured myeloid cells with GBM6 cells in vitro. Primary human monocytes or in vitro differentiated, but not undifferentiated, monocytic THP1 cells (46) that had been cocultured with GBM6 cells produced TNFα (Fig. 4A and fig. S6, A to D). 5-Ethynyl-2′-deoxyuridine (EdU) incorporation assays indicated that the proliferation of GBM6 cells increased when they were cocultured with monocytes, an increase that was reduced by the inclusion of an anti-human TNFα antibody in the culture medium (Fig. 4B and fig. S6E).
Fig. 4. Myeloid cell–derived TNFα promotes glioblastoma proliferation and invasion and EGFR kinase inhibitor resistance and correlates with aPKC activation.

(A) Concentration of TNFα in conditioned media from monocytes, GBM6 cells, or GBM6 cells cocultured with monocytes, as detected by enzyme-linked immunosorbent assay (ELISA). (B) Representative FACS analysis (left) and percentage (%) of EdU incorporation (right) in GBM6 cells cultured alone or cocultured with monocytes in the presence of monoclonal anti-human TNFα antibody or an isotype control. (C) Invasion indices of GBM6 cells cocultured with monocytes in the presence of monoclonal anti-human TNFα antibody or isotype control. (D) Representative FACS histograms (left) and mean fluorescence intensity (MFI; right) of phosphorylation of Thr560 in aPKC in GBM6 cells cultured alone or cocultured with monocytes in the presence of monoclonal anti-human TNFα antibody or an isotype control antibody. (E) Representative FACS analysis (left) and percentage (%) of EdU incorporation (right) in GBM6 cells left untreated or treated with erlotinib ± TNFα. (F) Invasion indices of GBM6 cells left untreated or treated with erlotinib ± TNFα. (G) Representative FACS histograms (left) and MFI (right) of phosphorylation of Tyr1086 in EGFR in GBM6 cells left untreated or treated with erlotinib ± TNFα. (H) Representative FACS histograms (left) and MFI (right) of phosphorylation of Thr560 in aPKC in GBM6 cells left untreated or treated with erlotinib ± TNFα. Data for (A) to (H) are presented as representative individual samples or as means ± SEM of at least three independent samples per group. *P < 0.05; **P < 0.01; ***P < 0.001; ns, nonsignificant.
Rapid invasion of glioblastoma cells into the surrounding parenchyma is a defining characteristic of this disease and is believed to contribute to the failure of surgery and directed radiotherapy. Therefore, we tested the ability of green fluorescent protein (GFP)–expressing GBM6 cells to invade rat brain slices (47) after they had been cultured in the absence or presence of primary human monocytes (fig. S7). GBM6 cells retained the ability to invade into the brain parenchyma when implanted onto rat brain slices ex vivo. The invasion of GBM6 cells was significantly enhanced when the cells were cocultured with monocytes, and the anti-human TNFα antibody blocked this enhanced invasion (Fig. 4C). Similarly, coculture of GBM6 cells with differentiated THP1 cells increased GBM6 cell proliferation and invasion, effects that were inhibited by anti-human TNFα antibody (fig. S8, A and B). The effect of myeloid cells on glioblastoma proliferation and invasion was independent of the PTEN status of the glioblastoma cells because coculture of differentiated THP1 cells also increased the proliferation and invasion of PTEN-deficient U87/EGFRvIII cells (fig. S8, C and D). Similarly, in an independent model of glioblastoma–myeloid cell interaction, coculture of GL261 mouse glioma cells derived from B6 mice with mouse bone marrow–derived macrophages resulted in the production of TNFα by mouse primary macrophages (fig. S9A) and increased tumor cell proliferation (fig. S9B) and invasion (fig. S9C). Our results are consistent with the facilitation of inflammation in cancers such as breast and colon cancer by tumor-associated macrophages (32, 48–50).
Paracrine TNFα induces aPKC activation and EGFR kinase inhibitor resistance in glioblastoma
Because aPKC promotes TNFα–NF-κB signaling (51–53), we hypothesized that aPKC activates TNFα-driven NF-κB activation in glioblastoma, and therefore, targeting aPKC would inhibit both the RTK and NF-κB pathways. We first determined that aPKC phosphorylation status indeed correlated with monocyte-stimulated glioblastoma proliferation and invasion. aPKC phosphorylation was enhanced in GBM6 cells by coculture with monocytes, an effect that was reduced when TNFα was neutralized (Fig. 4D).
Next, we examined whether paracrine TNFα could reduce the efficacy of EGFR kinase inhibitors in glioblastoma. Proliferation and invasion of GBM6 cells was significantly inhibited by the EGFR inhibitor erlotinib in vitro, effects that were negated by the addition of TNFα (Fig. 4, E and F). Erlotinib reduced both aPKC and EGFR phosphorylation in GBM6 cells, but the addition of TNFα correlated with enhanced phosphorylation of aPKC but not of EGFR (Fig. 4, G and H). Thus, myeloid cells increase glioblastoma cell proliferation and invasion and contribute to the reduced efficacy of EGFR kinase inhibitors through the production of TNFα in the tumor microenvironment and the stimulation of aPKC activity in glioblastoma cells.
Next, we directly tested whether aPKC activity was increased in GBM6 cells in response to TNFα. The phosphorylation of both aPKC and the p65 subunit of NF-κB (NF-κB p65) was significantly increased in GBM6 cells after the addition of TNFα (Fig. 5, A and B). Additionally, PZ09 treatment of GBM6 cells resulted in significantly reduced expression of TNFα-induced NF-κB targets (Fig. 5C). FACS analysis indicated that PZ09 treatment inhibited the TNFα-dependent increase in the phosphorylation of Ser536 in NF-κB p65 in GBM6 cells (Fig. 5D). Similarly, aPKC (figs. S10A and S11A) and NF-κB p65 (fig. S11A) were activated upon TNFα stimulation in U251 glioma cells. Silencing aPKC in U251 cells with siRNA sequences targeting both PRKCI and PRKCZ decreased the expression of TNFα-induced NF-κB target genes (fig. S10B). Silencing aPKC in U251 cells prevented the TNFα-dependent phosphorylation of Ser311 in NF-κB p65 (fig. S10C) but only partially prevented the TNFα-induced degradation of IκBα (fig. S10D). Finally, PZ09 treatment or aPKC siRNA transfection of U251 cells reduced the TNFα-stimulated activity of a NF-κB:GFP reporter to values comparable to those obtained with neutralization of TNFα with an anti-human TNFα antibody (fig. S10E).
Fig. 5. TNFα-induced NF-κB signaling in glioblastoma depends on aPKC.

(A) Representative FACS histograms (left) and MFI (right) of the phosphorylation of Thr560 in aPKC at the indicated times in GBM6 cells left untreated or treated with TNFα. (B) Representative FACS histograms (left) and percentage (%, right) of the phosphorylation of Ser536 in NF-κB p65 at the indicated times in GBM6 cells left untreated or treated with TNFα. (C) Expression of NF-κB target genes in GBM6 cells upon treatment with TNFα alone or with PZ09, as detected by RT-qPCR. mRNA abundance was normalized to GBM6 cell control. (D) Representative FACS histograms (left) and percentage (right) of the phosphorylation of Ser536 in NF-κB p65 in GBM6 cells left untreated or treated with TNFα and with or without PZ09. (E) Expression of NF-κB target genes in GBM6 cells exposed to monocyte coculture media, in the presence or absence of PZ09, as detected by RT-qPCR and normalized to untreated GBM6 cell samples alone. (F) Representative FACS analysis (left) and percentage (right) of EdU incorporation in GBM6 cells cultured alone or cells cocultured with monocytes, with or without PZ09. (G) Invasion indices of GBM6 cells cultured alone or after coculture with monocytes in the presence or absence of PZ09. (H) Representative FACS histograms (left) and MFI (right) of the phosphorylation of Thr560 in aPKC in GBM6 cells cultured alone or when cocultured with monocytes in the presence or absence of PZ09. (I) Representative FACS histograms (left) and percentage (right) of the phosphorylation of Ser536 NF-κB p65 in GBM6 cells cultured alone or when cocultured with monocytes in the presence or absence of PZ09. (J) Gene expression in acutely isolated U87/EGFRvIII cell–derived intracranial tumors after mice were treated with saline, erlotinib, or PZ09. Data for (A) to (J) are presented as representative images or as means ± SEM of at least three independent samples per group. *P < 0.05; **P < 0.01; ***P < 0.001; ns, nonsignificant.
We also tested the effects of inhibiting aPKC under GBM6–myeloid cell coculture conditions. Coculture of GBM6 cells and monocytes resulted in the enhanced phosphorylation of both aPKC and NF-κB p65 in GBM6 cells (fig. S11B). To assay monocyte-induced NF-κB target gene expression in GBM6 cells, we performed RT-qPCR on GBM6 cells exposed to the media of cocultured GBM6 cells and monocytes through a transwell system. In comparison to GBM6 cells grown in monoculture, GBM6 cells exposed to the coculture media showed increased expression of NF-κB target genes, such as COX2, IL1β, IL8, MCP1, MMP9, and TNFα (Fig. 5E). Similarly, in GBM6 cells cocultured with differentiated THP1 cells (46), aPKC phosphorylation peaked in GBM6 cells about 1 hour after plating (fig. S12A). NF-κB target gene expression in GBM6 (fig. S12B) or U87/EGFRvIII cells (fig. S12C) was enhanced under coculture conditions with differentiated THP1 cells. Treatment with PZ09 reduced the induction of NF-κB target genes in GBM6 cells exposed to GBM6 cell monocyte coculture media (Fig. 5E). These results demonstrate that tumor-associated myeloid cells activated aPKC-dependent NF-κB signaling.
Consistent with our hypothesis that aPKC-dependent NF-κB signaling induced by myeloid cells contributes to glioblastoma cell proliferation, PZ09 was also effective in inhibiting the monocyte-induced increase in GBM6 cell proliferation (Fig. 5F) and invasion (Fig. 5G), which correlated with inhibition of aPKC and NF-κB p65 phosphorylation (Fig. 5, H and I). Similarly, PZ09 treatment of cocultured GBM6 and differentiated THP1 cells reduced tumor cell proliferation (fig. S13A) and invasion (fig. S13B). aPKC knockdown in U87/EGFRvIII cells cocultured with THP1 cells resulted in reduced proliferation (fig. S13C) and invasion (fig. S13D). Because U87/EGFRvIII cells are deficient in PTEN, these results indicate that aPKC functions downstream of PTEN. PZ09 treatment or aPKC siRNA effectively inhibited the phosphorylation or reduced the abundance of aPKC, respectively, without affecting the total abundance or phosphorylation of EGFR in GBM6 or U251/EGFR cells (figs. S2, D and E, and S14, A to D). We also compared the efficacy of in vivo inhibition with erlotinib compared with PZ09 in a model of glioblastoma with the EGFRvIII mutation. In mice bearing orthotopic xenografts derived from U87/EGFRvIII cells, both erlotinib and PZ09 were effective in decreasing EGFR signaling in the xenografts (as assessed by the abundance of CD44 and uPAR in tumors), but only PZ09 treatment significantly inhibited the expression of NF-κB target genes in xenografts (IL1β and TNFα) (Fig. 5J).
Distinct aPKC-containing signaling complexes mediate oncogenic TNFα and RTK signaling
Do glioblastoma cell–autonomous EGFR and paracrine TNFα signals converge on an aPKC-containing signal module in glioblastoma cells? Whereas both EGF and TNFα signaling in glioblastoma resulted in aPKC activation and required aPKC, these pathways resulted in largely distinct transcriptional outputs at early time points. For example, EGF induced CD44, MMP9, VCAM, and uPAR (fig. S15A), whereas TNFα induced the expression of a different set of genes including IL1β, IL8, MCP1, and TNFα in U251/EGFR cells (fig. S15B). Furthermore, treatment with the extracellular signal–regulated kinase (ERK) inhibitor U0126 suggested that mitogen-activated protein kinase (MAPK) signaling downstream of aPKC promoted EGF-specific gene expression and not TNFα-dependent gene expression (fig. S15, C and D). In contrast, IκBαM, a dominant-negative inhibitor of NF-κB signaling, inhibited only TNFα-dependent gene expression, and not EGF-dependent gene expression, except for MMP9, indicating that aPKC-dependent NF-κB signaling was specifically required for the expression of the TNFα-dependent genes (fig. S15, E and F). These results suggest that although aPKC participates in both signaling pathways, these pathways do not merely converge on aPKC.
Two PB1 domain–containing scaffolds, Par6 and p62, can direct aPKC signaling to specific subsets of upstream activators and/or downstream substrates, thereby determining the functional specificity of aPKC activity (54). We investigated the requirement of the PB1 domain–containing scaffolds necessary for aPKC activation in the context of TNFα and EGF signaling in glioblastoma cells. EGF induced or stabilized an aPKC-Par6 complex (Fig. 6A). Application of EGFR kinase, PI3K, or Src inhibitors, all of which suppressed the activity of their targets (fig. S16), reduced aPKC activation and also reduced aPKC-Par6 coimmunoprecipitation in U87/EGFRvIII cells (Fig. 6B). For EGF-induced genes, the effect of aPKC silencing was generally phenocopied by Par6 silencing (fig. S2, C and D), but not by p62 silencing (fig. S2D and Fig. 6C). In contrast, silencing p62 generally phenocopied aPKC silencing in inhibiting NF-κB signaling (Fig. 6D). Furthermore, immunofluorescence imaging demonstrated that the majority of cellular Par6 localized with actin at the leading edge of EGF-treated U251/EGFR cells, whereas p62 localized to an intracellular compartment in TNFα-treated U251/EGFR cells (Fig. 6E). Therefore, TNFα and EGF signaling pathways, despite sharing the downstream kinase aPKC, may use alternative PB1 domain scaffold proteins—p62 or Par6—that localize to distinct intracellular regions. Expression of the constitutively active myr-aPKCζ in U251 cells resulted in indiscriminate induction of CD44, MMP9, VCAM, uPAR, IL1β, IL8, MCP1, and TNFα expression (Fig. 6F). Together, our results suggest that activation of aPKC is not only indispensable but also sufficient for the induction of both EGF- and TNFα-dependent genes, and that the specificity of these pathways is determined by the differential use of adaptors Par6 and p62.
Fig. 6. aPKC functions in both EGF- and TNFα-induced signaling in glioblastoma cells.

(A) Coimmunoprecipitation of Par6 with aPKC in serum-starved U251/EGFR cells after EGF treatment. aPKC immunoprecipitates were sequentially probed with Par6 and aPKC antibodies. Lysates were immunoblotted for Par6. (B) Coimmunoprecipitation of Par6 and activation of aPKC in U87/EGFRvIII cells grown in serum after incubation with AG1478, wortmannin, LY294002, or SU6656. aPKC immunoprecipitates were sequentially probed with Par6, phospho-aPKC Thr410/403, and aPKC antibodies. (C) Expression of the indicated genes in EGF-treated U251/EGFR cells transfected with aPKC, Par6, or p62 siRNAs, as determined by RT-qPCR. Expression was normalized to control U251/EGFR cells. (D) Expression of the indicated genes in TNFα-treated U251/EGFR cells transfected with aPKC, Par6, or p62 siRNAs, as determined by RT-qPCR. Expression was normalized to control U251/EGFR cells. (E) Representative images showing the colocalization of aPKC and Par6 with phalloidin at lamellipodia in EGF-stimulated U251/EGFR cells (white arrows, left and middle panels) and the colocalization of aPKC and p62 in the intracellular compartment in TNFα-treated U251/EGFR cells (gray arrow, right panel). Some aPKC was detectable at the lamellipodia of the cells (white arrow). Scale bar, 10 μm. (F) Expression of the indicated genes in U251 cells transfected with myr-aPKCζ, as determined by RT-qPCR. Expression was normalized to the mRNA abundance in untransfected U251 cells. Data for (A) to (F) are presented as representative images or as means ± SEM of at least three independent experiments. *P < 0.05; **P < 0.01; ***P < 0.001; ns, nonsignificant.
In conclusion, aPKC functions in parallel oncogenic signals in glioblastoma (Fig. 7). Altered abundance of this kinase has been previously reported to be associated with cancers, including glioblastoma (55). Two genes code for aPKCs in the mammalian genome. PRKCZ encodes aPKCζ, whereas PRKCI codes for aPKCΙ. The identity of the aPKCs involved in glioblastoma as well as their distribution pattern has heretofore remained unclear with frequently contrasting reports. For example, aPKCζ has been reported to be both increased and decreased in abundance in cancer, including glioblastoma (55, 56). aPKCΙ, and not aPKCζ, is the aPKC detected in most brain regions, except for cerebellum (57). Our analyses revealed that most glioblastoma tumor cell lines, as well as patient-derived xenografts, express more PRKCI than PRKCZ (fig. S17, A to C). aPKCΙ protein but not mRNA abundance was increased in glioblastoma cell lines and patient-derived xenografts in comparison to normal human astrocytes (fig. S17, D and E), suggesting that aPKC protein amount in glioblastoma was increased through posttranslational mechanisms.
Fig. 7. Schematic illustrating aPKC-containing signaling complexes in cell-autonomous RTK and non–cell-autonomous TNFα–NF-κB oncogenic signaling in glioblastoma.
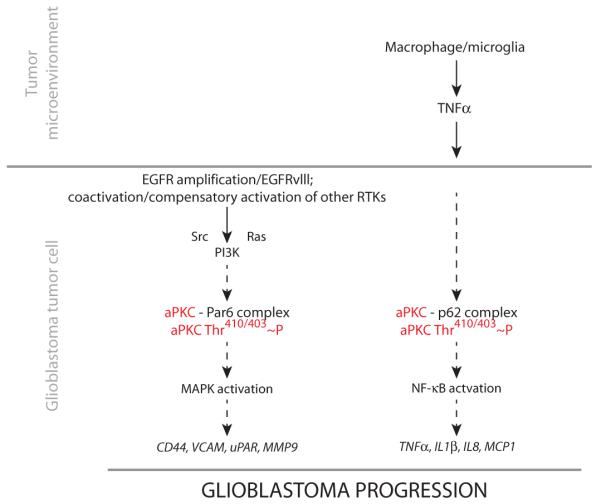
EGFR and/or other oncogenic RTK signaling pathways within the glioblastoma cell activate aPKC in a Par6-dependent fashion and lead to the expression of oncogenic genes. In parallel, TNFα produced by macrophages in the tumor microenvironment activates aPKC in a p62-dependent manner. This activation leads to the expression of NF-κB–dependent genes, which function as EGFR-independent oncogenic signals in glioblastoma.
DISCUSSION
The success of single-agent antitumor therapy can be limited by downstream mutations or the induction of parallel oncogenic pathways in tumor cells. EGFR gain of function occurs in ~45% of glioblastoma cases; the homozygous deletion of PTEN leading to downstream PI3K activation is seen in ~36% cases; and overall PI3K activation (due to activation of other RTK pathways) is seen in ~88% of glioblastoma cases (58). Cancer cells with mutant EGFR are particularly sensitive to inhibition of NF-κB, and NF-κB activation through overexpression of c-FLIP or silencing of IκBα rescues EGFR-mutant cancer cells from the cytotoxic effects of erlotinib (59). Our results indicate that a proinflammatory microenvironment provides parallel oncogenic signals that increase the therapeutic challenge of targeting glioblastoma tumor–intrinsic mutations (Fig. 7). Infiltration of innate immune cells within the glioblastoma tumor mass has been described previously (60–64). However, glioblastoma is not traditionally considered an inflammation-driven tumor, and macrophages or activated microglia in glioblastoma have often been described as antitumorigenic (65, 66). Here, we demonstrate that the interaction of glioblastoma tumor cells with tumor-infiltrating myeloid cells leads to paracrine production of TNFα, which contributes to tumor growth and spread and renders EGFR kinase inhibitors less effective. These results are consistent with previous reports that macrophages and microglia enhance glioma invasion and growth. Microglia, but not oligodendroglia or endothelial cells, can increase GL261 glioma cell migration in vitro (67, 68). Depletion of macrophages and microglia by treatment with clodronate liposomes also reduces invasion of GL261 cells in organotypic brain slices (69), and in vivo deletion of macrophages or microglia in the brain or the inhibition of colony-stimulating factor 1 (CSF-1) receptor reduces glioma growth (70–72). Additionally, high-grade gliomas, such as glioblastoma and WHO grade III anaplastic astrocytomas, show the largest increase in macrophage infiltration, in contrast to low-grade gliomas (62). Radioresistance in glioblastoma and a conversion to a more aggressive, mesenchymal subtype have been ascribed to TNFα/NF-κB signaling (73). Thus, targeting the tumor microenvironment can provide therapeutic opportunities (74, 75).
In summary, aPKC has critical roles in distinct but concurrent oncogenic signaling pathways. It functions downstream of EGFR and RTK signaling in glioblastoma cells. It is also essential for tumor microenvironment–induced TNFα–NF-κB oncogenic signaling in glioblastoma. Targeting the activity of aPKC in tumor cell–autonomous and non–tumor cell–autonomous signaling may be a strategy that affords simultaneous disabling of tumor-intrinsic as well as microenvironment-induced oncogenic signals in glioblastoma.
MATERIALS AND METHODS
Animals
Six- to 8-week-old female NOD-SCID mice were acquired from Charles River. TNFα−/− (B6.129S6-Tnftm1Gkl/J, stock 5540) and control C57BL/6J (stock 664) were acquired from The Jackson Laboratory. All animal procedures conformed to protocols approved by the University of Arizona Institutional Animal Care and Use Committee (IACUC).
Antibodies and reagents
Rabbit anti-aPKC (sc-216) and rabbit anti–NF-κB p65 phosphoSer311 (sc-101748) were purchased from Santa Cruz Biotechnology. Rabbit anti–aPKC phosphoThr410/403 (#9378), rabbit anti–NF-κB p65 phosphoSer536 (#3033), rabbit anti–Akt phosphoSer473 (#9271), mouse anti-Akt (#2920), rabbit anti–Src phosphoTyr516 (#6943), rabbit anti-Src (#2123), rabbit anti–MAPK p44/42 (#4695), rabbit anti–NF-κB p65 (#4764), and rabbit anti-IκBα (#9242) were obtained from Cell Signaling. Rabbit anti-PAR6 (ab49776), rabbit anti–aPKC phosphoThr560 (ab62372), rabbit anti–aPKC phosphoT560 (ab62372), and mouse anti-p62 (ab56416) were purchased from Abcam. Rabbit anti–EGFR phosphoTyr1086 (44790) and mouse anti-EGFR (44796) were purchased from Invitrogen. Mouse anti–EGFR phosphoTyr1086 (04-286) was purchased from Millipore. Mouse anti–β-tubulin (T-2046) and mouse anti–MAPK p44/42 phosphoThr183-phosphoTyr185 (M-8159) were purchased from Sigma. Mouse anti-human CD68 antibody (#M0814) was purchased from Dako. Mouse anti-human TNFα neutralizing antibodies from Novus Biologicals (#NB120-10204) or from R&D Systems (MAB2101) were used at a concentration of 100 ng/ml. Mouse immunoglobulin G1 (IgG1) isotype controls (MAB002 or NBP1-97005) were purchased from Novus Biologicals and R&D Systems and used at identical concentrations as the TNFα neutralizing antibodies. Rat anti-mouse Cd11b–phycoerythrin (PE) (#12-0112-85), mouse anti-human TNFα-allophycocyanin (APC) (#17-7349-82), and mouse IgG1 isotype control (#17-4714-81) antibodies were acquired from eBioscience. PE–mouse anti-human TNFα (#502908), PE–mouse IgG1k isotype control (#400139), anti-human CD11b–Pacific blue (#101235), anti-human CD64–Alexa Fluor 647 (#305012), anti-human CD23–APC–cyanine 7 (Cy7) (#338520), anti-human CD14-PECy7 (#325617), anti-human CD80–fluorescein isothiocyanate (#305205), and anti-human CD163 (#333608) antibodies used for FACS were obtained from BioLegend. Species-specific secondary antibodies for immunohistochemistry or immunofluorescence conjugated to Alexa 488 or 594 were obtained from Life Technologies. Secondary antibodies for Western [anti-mouse–horseradish peroxidase (HRP) and anti-rabbit–HRP] were obtained from Promega. Erlotinib was purchased from Selleck Chemicals (S1023) and was used at a concentration of 10 μM. All other inhibitors were purchased from Calbiochem. AG1478 (#658548) was used at 10 μM; PI3K inhibitors LY294002 (#44024) and wortmannin (#681675) at 20 μM and 100 nM, respectively; MAPK kinase inhibitor U0126 (#662005) at 10 μM; and Src kinase inhibitor SU6656 (#572636) at 10 μM. NF-κB-Reporter:GFP lentivirus was obtained from SA Biosciences (CLS-013G). The IκBαM adenovirus was purchased from Imgenex (IMG-2500). Lentiviruses expressing GFP or aPKC shRNA constructs were produced at Viral Vector Core, The Salk Institute, according to previously described methods (76). VSVg (vesicular stomatitis virus G glycoprotein) pseudotyped constitutively active IκB kinase (IKK) (S177,181E) retrovirus was generated as previously described (77) with minor modifications. pCLXSN-IKK S177,181E was transiently transfected into human embryonic kidney (HEK) 293T cells using linear 25-kD polyethylenimine (Polysciences Inc.) with an N/P ratio (ratio of moles of amine groups of cationic polymers to phosphates of DNA) of 10 [1 mg/ml in Dulbecco-PBS (phosphate-buffered saline), pH 4.5]. Cells were cotransfected with pCL-CMV-GAG-POL and pMD2.G. Virus-containing medium was harvested at 48 and 72 hours after transfection, treated with deoxyribonuclease 1 (1 μg/ml; Sigma), and filtered through a 0.22-μm filter (Durapore, Millipore) before aliquoting and storage at −80°C. Infectious viral titers were determined by RT-qPCR of genomic DNA extracted from HEK293T cells 48 hours after infection with a 10-fold dilution series of retroviral vector. PZ09 was synthesized in-house following a previously described procedure (13) with some modifications, and the inhibitor was validated by mass spectrometry and in vitro kinase assays. PZ09 was used at 10 μM.
Cell lines and cell culture
U87/EGFRvIII and U251/EGFR human glioblastoma cell lines were a gift from Z. Lu (MD Anderson). The murine GL261 glioma cell line was acquired from the National Cancer Institute. The primary glioblastoma line 6 (GBM6) cell line was established directly from a patient surgical sample and maintained as a subcutaneous flank xenograft through serial passaging in immunodeficient mice. GBM6 flank tumor xenografts were harvested, mechanically disaggregated, and grown in short-term culture (5 to 7 days) in Dulbecco’s modified Eagle’s medium (DMEM) containing 2.5% fetal bovine serum (FBS), 1% nonessential amino acids, 2 mM glutamine, penicillin (100 U/ml), and streptomycin (10 μg/ml) for lentiviral transduction (15). Primary glioma cells were dissociated from fresh patient tumors using the Miltenyi Biotec Brain Tumor Dissociation Kit (#130-095-939) and the Miltenyi gentleMACS dissociator. Glioma cells were isolated according to a previously published protocol (78). Samples were taken from patients diagnosed with glioblastoma, and the use of the patient tissues received prior Barrow Neurological Institute/St. Joseph’s Hospital Institutional Review Board authorization. Unless indicated otherwise, all cell types were grown in DMEM supplemented with 10% FBS and 1% penicillin/streptomycin (p/s) (Invitrogen) at 37°C, 5% CO2. THP1 cells were maintained in DMEM supplemented with 10% FBS, 1% p/s, and 0.05 mM 2-mercaptoethanol. THP1 cells were differentiated with phorbol 12-myristate 13-acetate (PMA; 50 ng/ml) (Cell Signaling) overnight and were subsequently washed three times with PBS. Medium was then replaced, and the cells were cultured for an additional 24 hours before experiments. siRNA and shRNA were transfected using Lipofectamine (Life Technologies) or Effectene (Qiagen), respectively. siRNAs were purchased from Life Technologies. Transfection was performed according to established protocols from the manufacturers. Cells were analyzed 48 hours after transfection. Average knockdown efficiency for PRKCZ, PRKCI, PAR6A, PAR6B, and P62 relative to control (luciferase) siRNA is shown in fig. S1. U87/EGFRvIII cells were transduced with lentiviral vector alone or with lentivirus aPKC-shRNA to generate stable lines (U87VIII control cells and U87VIII-aPKC-shRNA cells). Glioblastoma cells were incubated with 1:5000 dilution of virus in serum-free medium overnight. Subsequently, the cells were washed three times with PBS and cultured according to standard protocols. The cells were cultured for an additional 48 hours after infection before conducting experiments. For EGF and TNFα treatments, cells were serum-starved for 24 hours and then treated with EGF (100 ng/ml; Millipore) or TNFα (10 ng/ml; Calbiochem) for various time points. PZ09 was used at 10 μM. For other inhibitors, cells were serum-starved overnight and preincubated with inhibitor for 30 min.
Immunoblotting and immunoprecipitation
Ice-cold 1% NP-40 buffer (20 mM tris-HCl at pH 8, 137 mM NaCl, 10% glycerol, 1% NP-40) supplemented with phosphatase and protease inhibitor (Halt Protease and Phosphatase Inhibitor Cocktail, Thermo Scientific) was used for protein isolation and immunoprecipitation. Briefly, cells were washed three times with ice-cold PBS and scraped in NP-40 buffer. Lysates were kept cold and sonicated 10 times, 1 s each, and then centrifuged at 12,000g for 5 min at 4°C. For immunoprecipitation, the supernatant was precleared using protein-A beads for 30 min at room temperature (RT). The supernatant was subsequently added to protein-A beads prebound to aPKC antibody (Santa Cruz Biotechnology, sc-216), and the mixture was incubated overnight on a shaker at 4°C. Immunoprecipitates were then washed two times with ice-cold NP-40 buffer and finally washed with PBS. Sample loading buffer with dithiothreitol was added, and the immunoprecipitates were boiled for 5 min before loading onto precast SDS–polyacrylamide gel electrophoresis gels (Life Technologies). Gels were transferred onto methanol-presoaked polyvinylidene difluoride membranes and subsequently blocked with 5% bovine serum albumin (BSA) in PBS for 2 hours. Primary antibodies were incubated overnight at 4°C, after which blots were washed three times with TBST [tris-buffered saline (TBS) + 0.1% Tween] for 15 min each, followed by incubation with secondary antibodies (1: 2000) for 2 hours at RT. Blots were then washed three times for 30 min each in TBST, with a final wash in TBS alone. Blots were developed using SuperSignal West Dura (Thermo Scientific) on a UVP Imager.
Immunohistochemistry for tissue microarrays
Tissue microarrays were prepared from archival blocks of formalin-fixed paraffin-embedded specimens of WHO grade IV glioblastoma. All tumor cases were histologically reviewed, and representative tumor areas were marked on the corresponding donor paraffin blocks. Blocks were cut at 4-μm thickness for routine hematoxylin and eosin (H&E) staining and immunohistochemistry. Sources for tissue microarrays include TGen, Armed Forces Institute of Pathology, and Barrow Neurological Institute. Immunohistochemistry was performed using Ventana automated Discovery XT or Benchmark XT system (VMSI, Ventana Medical Systems, a member of the Roche Group). All steps were performed on this instrument using VMSI validated reagents, including deparaffinization, cell conditioning (mild CC1 for CD68 and standard CC1 for aPKC, phospho-aPKC, and TNFα), primary antibody staining, detection, and amplification using a biotinylated streptavidin-HRP and ultraVIEW Universal DAB (diaminobenzidine) detection system and hematoxylin counterstaining. Primary antibodies were incubated for 30 min (CD68 and TNFα) or 1 hour (aPKC and phospho-aPKC) at 37°C. Appropriate positive and negative (secondary antibody only) controls were stained in parallel for each round of immunohistochemistry. After staining on the instrument, slides were dehydrated through graded alcohols to xylene and coverslipped with mounting medium.
Orthotopic xenografts
Six- to 8-week-old female NOD-SCID, TNFα−/−, and control mice were anesthetized by intraperitoneal injection of 1.25% avertin (200 mg/kg). Cells (U87EGFRvIII control, U87/EGFRvIII-aPKC-shRNA, or GL261) were resuspended in standard medium (DMEM with 10% FBS, 1% p/s) at a concentration of 1.25 × 10⁵ cells/μl and kept on ice until injection. Intracranial injections were performed using a Hamilton syringe (Hamilton Company). Briefly, the animal was secured onto the small animal stereotaxic apparatus (Kopf Instruments), and a midline incision was made to expose the skull. Subsequently, a burr hole was drilled 1 mm lateral and 2 mm anterior to bregma. Cells were injected at a rate of 1 μl/min (total 4 μl, 5 × 10⁵ cells) to a depth of 3 mm below the skull, which corresponds to the area of the caudate nucleus. For GBM6 cell intracranial tumor model, 2 × 10⁶ GBM6 cells were injected. For PZ09 treatment, 10 μM PZ09 was delivered by ALZET minipumps directly to the tumor site, 3 days after implantation, for a treatment period of 7 days in mice bearing U87/EGFRvIII cell–derived tumors and for 14 days in mice bearing GBM6 cell–derived tumors. After intracranial injection, mice were observed daily for changes in weight, gait, and appearance and neurological symptoms and were euthanized according to IACUC recommendations. Brains were then removed and processed for histopathology.
RNA isolation and RT-PCR
For gene expression analysis from short-term cultures of GBM6 and other glioblastoma cell lines, total cellular RNA was isolated with RNeasy kit (Qiagen). mRNA was reverse-transcribed into complementary DNA (cDNA) using the Superscript III Kit (Life Technologies). Real-time PCR was performed on a 7900HT cycler with SYBR Green Master Mix (Applied Biosystems). For NF-κB target gene profiling from primary human glioblastoma cells, cDNA was obtained as described and plated onto a Custom TaqMan 96-well Gene Expression Signature Plate according to the manufacturer’s instructions. Real-time PCR was performed on a 7900HT cycler with TaqMan Universal PCR Master Mix (Life Technologies). For acutely isolated in vivo mouse brain mRNA analyses, whole mouse brain was homogenized in Trizol using a glass homogenizer. Samples were centrifuged, and 0.2 ml of chloroform per 1 ml of Trizol was added to the supernatant. Samples were vigorously shaken for 15 s, incubated at RT for 3 min, and centrifuged for 15 min at 10,000g at 4°C. Addition of chloroform and centrifugation was repeated. After second centrifugation, the aqueous phase containing RNAwas precipitated by mixing with isopropyl alcohol for 20 min at −20°C. RNA precipitants were washed three times with 75% ethanol and spun at 7500g for 5 min at 4°C. RNA was air-dried, resuspended in ribonuclease-free water, and stored at −80°C. For wild-type EGFR and EGFRvIII, cDNA was amplified by standard PCR using primers as previously described (7) and resolved on agarose gel. Primers were purchased from IDT, and sequences are provided in table S1.
Human monocyte isolation and monocyte-derived macrophages
Peripheral blood mononuclear cells (PBMCs) were obtained from 50 ml of buffy coats (New York Blood Center) by Ficoll gradient centrifugation. Human monocytes were isolated by CD14-positive selection (STEM-CELL) from PBMCs. CD14+ monocytes were cocultured with GBM6 cells at 1:1 ratio for in vitro proliferation or invasion assays. CD14+ monocytes (300,000 to 500,000/ml) were plated in RPMI 1640 plus 10% of FBS and in vitro differentiated to macrophages by adding macrophage-CSF (25 ng/ml). Interferon-γ (50 ng/ml), IL-4 (40 ng/ml), or IL-10 (50 ng/ml) polarizing cytokines were added on day 3, and M0, M1, M2a, and M2c monocyte-derived macrophages were harvested on day 7. Macrophage polarized phenotype was confirmed using anti-human CD11b, CD64, CD23, CD80, CD163, and CD14 (BioLegend). Recombinant cytokines were purchased from R&D Systems.
Coculture and ELISA
For transwell coculture experiments, 1 × 10⁶ glioma cells were plated into a six-well plate. Cell culture inserts (Millicell, 0.4-μm micropore polycarbonate filter) were placed in the wells. GBM6 or U87/EGFRvIII cells were serum-starved for 24 hours before adding 1 × 10⁵ glioblastoma cells alone, glioblastoma plus 1 × 10⁵ THP1 cells, or glioblastoma cells plus primary monocytes (CD14+) to the insert. At specified time points, cell culture inserts were removed, and RNA was isolated from the glioblastoma cells alone. In addition, medium supernatants were collected, snap-frozen with liquid nitrogen, and stored at −80°C. The media from cocultures of macrophages and tumor cell lines were collected after 24 and 48 hours, and TNFα in the supernatants was detected using an anti-TNFα ELISA kit (eBioscience). For proliferation assays, starved 1 × 10⁵ glioblastoma cells were cocultured with 1 × 10⁵ CD14+ monocytes or differentiated THP1 cells in a six-well plate, and EdU incorporation was assessed following the manufacturer’s instructions (Click-iT EdU Flow Cytometry Assay Kit, Life Technologies). CD11b staining was included to identify monocytes and distinguish them from glioblastoma cells in coculture.
Flow cytometric analysis
Glioma cell lines, undifferentiated or PMA-differentiated THP1 cells, and CD14+ primary monocytes were cultured alone and together in complete DMEM at a 1:1 ratio. Six hours before harvesting, brefeldin A was added to cells at a final concentration of 3 μg/ml. CD11b surface staining was included to discriminate primary monocytes from glioma cells. Cells were fixed with 1% paraformaldehyde (PFA) and permeabilized with 0.5% saponin. Anti-TNFα antibody or isotype control was added to cells, and cells were incubated on ice for at least 30 min. Cells were then washed with Dulbecco-PBS and suspended in 1% BSA solution. For NF-κB p65 phosphoSer536 (Cell Signaling Technology), EGFR phosphoTyr1086 (Millipore), and aPKC phosphoThr560 (Abcam) staining, GBM6 cells were treated with TNFα (100 ng/ml; Calbiochem) or serum or cocultured with monocytes for different times. After harvesting, cells were immediately fixed with 1% PFA for 15 min, washed two times with PBS, and then permeabilized with cold methanol for 30 min on ice. Cells were washed three times, blocked with PBS + 5% human AB serum for 15 min, and then incubated with specific antibodies for 30 min at 4°C. For non–fluorochrome-conjugated primary antibodies, anti-rabbit APC (BioLegend) and anti-mouse Alexa Fluor 488 (eBioscience) were used as secondary antibodies. CD11b antibody was always added when GBM6 cells were cocultured with monocytes. Cells were finally washed and resuspended in PBS for FACS analysis. For bromodeoxyuridine (BrdU) incorporation experiments, 1 × 10⁶ U87/EGFRvIII or GBM6 cells were plated in a six-well plate. Cell culture inserts (Millicell, 0.4-μm micropore polycarbonate filter) were placed in the wells. Glioma cells were serum-starved for 24 hours before adding 1 × 10⁵ U87/EGFRvIII or GBM6 cells and 1 × 10⁵ THP1 to the insert. BrdU (10 μM; BD Pharmingen, 552598) was added to the media for 24 hours. Cell culture inserts were removed, and glioma cells were fixed, permeabilized, and stained for BrdU using an APC BrdU Flow Kit (BD Pharmingen, 552598) according to the manufacturer’s instructions. For EdU incorporation, starved 1 × 10⁵ GBM6 cells were cocultured with 1 × 10⁵ CD14+ monocytes isolated from PBMC in a six-well plate for 24 hours. EdU was added into the culture at the last 2 hours. After harvesting, cells were immediately fixed with the fixative buffer, supplied with the kit (Click-iT EdU Flow Cytometry Assay Kit, Life Technologies). Staining was performed following the manufacturer’s instruction. CD11b staining was included to identify monocytes and distinguish them from glioblastoma cells in coculture. For in vivo phenotypic analyses of tumor-infiltrating macrophages within human glioblastoma tumors, three patient samples were dissociated using the Miltenyi Biotec Brain Tumor Dissociation Kit and gentleMACS dissociator. Dissociated cells were blocked using 3% FBS in PBS for 30 min on ice and subsequently stained with a cocktail of anti-human CD23, anti-human CD64, and anti-human CD11b in 3% FBS/PBS for 30 min on ice. Cells were washed three times with PBS and fixed in 1% PFA for 30 min on ice. FACSCalibur, FACSAria, or LSRII (BD) was used to analyze the samples, and WinMiDi software (freeware from The Scripps institute) or FlowJo was used to analyze and plot the data.
Ex vivo invasion assay
Ex vivo orthotopic invasion assays were performed as previously described (47) with some modifications. Brains were obtained from 4-week-old rats and placed in ice-cold artificial CSF (aCSF) (126 mM NaCl, 3 mM KCl, 1.5 mM MgCl2, 24 mM CaCl2, 1.2 mM NaH2PO4, 11 mM glucose, and 26 mM NaHCO3). Brains were sectioned into 400-μm slices on a vibratome in ice-cold aCSF. Slices were placed on a cell culture insert (Millicell, 0.4-μm micropore polycarbonate filter) in a six-well plate with 1.5 ml of DMEM with 10% FBS and 1% p/s; 500 μl of medium was added to the insert that was placed inside the wells of a six-well plate. The brain slices were kept in an incubator under standard culture conditions (37°C, 5% CO2). GFP+ GBM6 and/or U87/EGFRvIII cells were resuspended in serum-free DMEM at 2 × 10⁸ cells/ml. Before cells were added, medium was removed from the upper chamber of the six-well plate so that the slice was semidry before implantation. GFP+ GBM6 and/or U87/EGFRvIII cells (1 × 10⁵) were placed on the putamen in 0.5-μl volumes, and after 45 min, 500 μl of serum-free medium was added back to the upper chamber. The plates were kept in the incubator for 4 to 5 days and subsequently fixed overnight in 4% PFA at 4°C. The polycarbonate membrane was carefully removed, and the brains were placed on a slide for imaging on a confocal microscope. Imaging and quantification were performed as previously described (47). Fluorescence at various depths into the tissue was calculated after confocal imaging. Intensity at each layer was normalized to total intensity across all depths, and linear regression analysis was performed to determine the slope of invasion for each replicate. R2 (coefficient of determination) for each slope was calculated and was greater than 0.88 with an average value of 0.96. The average inverse slope was used to calculate the invasion index.
NF-κB reporter assay
U251/EGFR or U251/EGFR-aPKC-siRNA cells were incubated with 1:1000 dilution of Lenti NF-κB-Reporter:GFP in serum-free medium overnight. Subsequently, the cells were washed three times with PBS and cultured for 72 hours before overnight serum starvation. After serum starvation, cells were treated for 30 min with TNFα (10 ng/ml) in serum-free medium in the presence or absence of 10 μM PZ09 or monoclonal anti-human TNFα antibody. Changes in GFP fluorescence were detected and quantified using a Tecan Infinite F500 microplate reader. Results were normalized to NF-κB reporter–transduced cells, which were serum-starved and not treated with TNFα.
Immunofluorescence
Glioblastoma cells were seeded onto acid-etched coverslips (70% ethanol, 1% HCl in PBS, 5 min) in a 24-well plate overnight. Upon confluency, medium was removed and the cells were washed three times with PBS. The cells were fixed with 4% PFA for 15 min at RT, then washed three times with PBS, and permeabilized with 0.1% Triton-X–PBS for 15 min at RT. Cells were blocked for 2 hours with 2% normal horse serum (Life Technologies) in PBS at RT. Primary antibodies were diluted in 2% normal horse serum, and cells were incubated overnight at 4°C. Subsequently, coverslips were washed three times with PBS, and secondary antibodies (Alexa Fluor 488 and 594) diluted in 2% normal horse serum were added for 2 hours at RT. After the secondary antibody incubation, cells were stained with 4′,6-diamidino-2-phenylindole (diluted at 1:5000 in PBS) for 10 min at RT. Finally, coverslips were washed three times with PBS and mounted onto slides using ProLong Gold antifade reagent (Life Technologies) and sealed with nail polish. Images were obtained using a Zeiss 710 confocal microscope with a 63× objective lens.
Statistical analysis
Data are represented as means ± SEM. Differences between the means of experimental groups were analyzed with either one-tailed or two-tailed Student’s t test or analysis of variance (ANOVA) (GraphPad Software Inc.) as appropriate. Bonferroni multiple comparison test was used following ANOVA. Survival was calculated using Kaplan-Meier plot, and survival curves were compared by the Mantel-Cox log-rank test (GraphPad Software Inc.). P values ≤0.05 were considered significant.
Supplementary Material
Acknowledgments
We thank J. Olsen (Lifetech Inc.) and Z. Mirzadeh for technical expertise and advice, V. Tergaonkar and T. Hunter for reagents, and J. Georges for technical assistance. Funding: NIH R01 CA149258, NIH P30CA023074 subaward, and ABRC 8-101 to S.G.; NIH R01 AI089824 to C.V.R. and S.G.; NIH R01 NS082745 and NIH R01 CA175391 to N.S.; NIH T32CA009213 to E.K.M.; CONICET Postdoctoral Fellowship to A.E.E.; and an Achievement Rewards for College Scientists Foundation Scholar Award (Y.K.).
Footnotes
Author contributions: Y.K., E.A.C.-S., A.S.P., E.J.R., E.K.M., A.E.E., and W.Y. performed the experiments and analyzed the data; K.A., C.V.R., and S.G. analyzed the data; A.S.P., E.J.R., J.D.D., D.G., M.E.B., J.C.L., C.H., Z.L., K.A., and N.S. procured and provided key specimens and reagents for the study; C.V.R. and S.G. designed the study, wrote the manuscript, and directed the project. All authors contributed to manuscript revisions.
Competing interests: The authors declare that they have no competing interests.
REFERENCES AND NOTES
- 1.Furnari FB, Fenton T, Bachoo RM, Mukasa A, Stommel JM, Stegh A, Hahn WC, Ligon KL, Louis DN, Brennan C, Chin L, DePinho RA, Cavenee WK. Malignant astrocytic glioma: Genetics, biology, and paths to treatment. Genes Dev. 2007;21:2683–2710. doi: 10.1101/gad.1596707. [DOI] [PubMed] [Google Scholar]
- 2.SEER http://seer.cancer.gov/
- 3.CBTRUS http://www.cbtrus.org/
- 4.Mellinghoff IK, Schultz N, Mischel PS, Cloughesy TF. Will kinase inhibitors make it as glioblastoma drugs? Curr. Top. Microbiol. Immunol. 2012;355:135–169. doi: 10.1007/82_2011_178. [DOI] [PMC free article] [PubMed] [Google Scholar]
- 5.Gilbert MR. Recurrent glioblastoma: A fresh look at current therapies and emerging novel approaches. Semin. Oncol. 2011;38(Suppl. 4):S21–S33. doi: 10.1053/j.seminoncol.2011.09.008. [DOI] [PubMed] [Google Scholar]
- 6.Kesari S. Understanding glioblastoma tumor biology: The potential to improve current diagnosis and treatments. Semin. Oncol. 2011;38(Suppl. 4):S2–S10. doi: 10.1053/j.seminoncol.2011.09.005. [DOI] [PubMed] [Google Scholar]
- 7.Mellinghoff IK, Wang MY, Vivanco I, Haas-Kogan DA, Zhu S, Dia EQ, Lu KV, Yoshimoto K, Huang JH, Chute DJ, Riggs BL, Horvath S, Liau LM, Cavenee WK, Rao PN, Beroukhim R, Peck TC, Lee JC, Sellers WR, Stokoe D, Prados M, Cloughesy TF, Sawyers CL, Mischel PS. Molecular determinants of the response of glioblastomas to EGFR kinase inhibitors. N. Engl. J. Med. 2005;353:2012–2024. doi: 10.1056/NEJMoa051918. [DOI] [PubMed] [Google Scholar]
- 8.Mellinghoff IK, Cloughesy TF, Mischel PS. PTEN-mediated resistance to epidermal growth factor receptor kinase inhibitors. Clin. Cancer Res. 2007;13:378–381. doi: 10.1158/1078-0432.CCR-06-1992. [DOI] [PubMed] [Google Scholar]
- 9.Berra E, Diaz-Meco MT, Dominguez I, Municio MM, Sanz L, Lozano J, Chapkin RS, Moscat J. Protein kinase C ζ isoform is critical for mitogenic signal transduction. Cell. 1993;74:555–563. doi: 10.1016/0092-8674(93)80056-k. [DOI] [PubMed] [Google Scholar]
- 10.Aranda V, Haire T, Nolan ME, Calarco JP, Rosenberg AZ, Fawcett JP, Pawson T, Muthuswamy SK. Par6–aPKC uncouples ErbB2 induced disruption of polarized epithelial organization from proliferation control. Nat. Cell Biol. 2006;8:1235–1245. doi: 10.1038/ncb1485. [DOI] [PubMed] [Google Scholar]
- 11.Akimoto K, Takahashi R, Moriya S, Nishioka N, Takayanagi J, Kimura K, Fukui Y, Osada S, Mizuno K, Hirai S, Kazlauskas A, Ohno S. EGF or PDGF receptors activate atypical PKCλ through phosphatidylinositol 3-kinase. EMBO J. 1996;15:788–798. [PMC free article] [PubMed] [Google Scholar]
- 12.Ghosh S, Marquardt T, Thaler JP, Carter N, Andrews SE, Pfaff SL, Hunter T. Instructive role of aPKCζ subcellular localization in the assembly of adherens junctions in neural progenitors. Proc. Natl. Acad. Sci. U.S.A. 2008;105:335–340. doi: 10.1073/pnas.0705713105. [DOI] [PMC free article] [PubMed] [Google Scholar]
- 13.Trujillo JI, Kiefer JR, Huang W, Thorarensen A, Xing L, Caspers NL, Day JE, Mathis KJ, Kretzmer KK, Reitz BA, Weinberg RA, Stegeman RA, Wrightstone A, Christine L, Compton R, Li X. 2-(6-Phenyl-1H-indazol-3-yl)-1H-benzo[d]imidazoles: Design and synthesis of a potent and isoform selective PKC-ζ inhibitor. Bioorg. Med. Chem. Lett. 2009;19:908–911. doi: 10.1016/j.bmcl.2008.11.105. [DOI] [PubMed] [Google Scholar]
- 14.Pandita A, Aldape KD, Zadeh G, Guha A, James CD. Contrasting in vivo and in vitro fates of glioblastoma cell subpopulations with amplified EGFR. Genes Chromosomes Cancer. 2004;39:29–36. doi: 10.1002/gcc.10300. [DOI] [PubMed] [Google Scholar]
- 15.Giannini C, Sarkaria JN, Saito A, Uhm JH, Galanis E, Carlson BL, Schroeder MA, James CD. Patient tumor EGFR and PDGFRA gene amplifications retained in an invasive intracranial xenograft model of glioblastoma multiforme. Neuro Oncol. 2005;7:164–176. doi: 10.1215/S1152851704000821. [DOI] [PMC free article] [PubMed] [Google Scholar]
- 16.Sarkaria JN, Yang L, Grogan PT, Kitange GJ, Carlson BL, Schroeder MA, Galanis E, Giannini C, Wu W, Dinca EB, James CD. Identification of molecular characteristics correlated with glioblastoma sensitivity to EGFR kinase inhibition through use of an intracranial xenograft test panel. Mol. Cancer Ther. 2007;6:1167–1174. doi: 10.1158/1535-7163.MCT-06-0691. [DOI] [PubMed] [Google Scholar]
- 17.Fan QW, Cheng CK, Gustafson WC, Charron E, Zipper P, Wong RA, Chen J, Lau J, Knobbe-Thomsen C, Weller M, Jura N, Reifenberger G, Shokat KM, Weiss WA. EGFR phosphorylates tumor-derived EGFRvIII driving STAT3/5 and progression in glioblastoma. Cancer Cell. 2013;24:438–449. doi: 10.1016/j.ccr.2013.09.004. [DOI] [PMC free article] [PubMed] [Google Scholar]
- 18.Cohen EE, Lingen MW, Zhu B, Zhu H, Straza MW, Pierce C, Martin LE, Rosner MR. Protein kinase C ζ mediates epidermal growth factor–induced growth of head and neck tumor cells by regulating mitogen-activated protein kinase. Cancer Res. 2006;66:6296–6303. doi: 10.1158/0008-5472.CAN-05-3139. [DOI] [PubMed] [Google Scholar]
- 19.Stommel JM, Kimmelman AC, Ying H, Nabioullin R, Ponugoti AH, Wiedemeyer R, Stegh AH, Bradner JE, Ligon KL, Brennan C, Chin L, DePinho RA. Coactivation of receptor tyrosine kinases affects the response of tumor cells to targeted therapies. Science. 2007;318:287–290. doi: 10.1126/science.1142946. [DOI] [PubMed] [Google Scholar]
- 20.Jun HJ, Acquaviva J, Chi D, Lessard J, Zhu H, Woolfenden S, Bronson RT, Pfannl R, White F, Housman DE, Iyer L, Whittaker CA, Boskovitz A, Raval A, Charest A. Acquired MET expression confers resistance to EGFR inhibition in a mouse model of glioblastoma multiforme. Oncogene. 2012;31:3039–3050. doi: 10.1038/onc.2011.474. [DOI] [PMC free article] [PubMed] [Google Scholar]
- 21.Standaert ML, Bandyopadhyay G, Kanoh Y, Sajan MP, Farese RV. Insulin and PIP3 activate PKC-ζ by mechanisms that are both dependent and independent of phosphorylation of activation loop (T410) and autophosphorylation (T560) sites. Biochemistry. 2001;40:249–255. doi: 10.1021/bi0018234. [DOI] [PubMed] [Google Scholar]
- 22.Le Good JA, Ziegler WH, Parekh DB, Alessi DR, Cohen P, Parker PJ. Protein kinase C isotypes controlled by phosphoinositide 3-kinase through the protein kinase PDK1. Science. 1998;281:2042–2045. doi: 10.1126/science.281.5385.2042. [DOI] [PubMed] [Google Scholar]
- 23.Chou MM, Hou W, Johnson J, Graham LK, Lee MH, Chen CS, Newton AC, Schaffhausen BS, Toker A. Regulation of protein kinase C ζ by PI 3-kinase and PDK-1. Curr. Biol. 1998;8:1069–1077. doi: 10.1016/s0960-9822(98)70444-0. [DOI] [PubMed] [Google Scholar]
- 24.Uberall F, Hellbert K, Kampfer S, Maly K, Villunger A, Spitaler M, Mwanjewe J, Baier-Bitterlich G, Baier G, Grunicke HH. Evidence that atypical protein kinase C-l and atypical protein kinase C-ζ participate in Ras-mediated reorganization of the F-actin cytoskeleton. J. Cell Biol. 1999;144:413–425. doi: 10.1083/jcb.144.3.413. [DOI] [PMC free article] [PubMed] [Google Scholar]
- 25.Wooten MW, Vandenplas ML, Seibenhener ML, Geetha T, Diaz-Meco MT. Nerve growth factor stimulates multisite tyrosine phosphorylation and activation of the atypical protein kinase C’s via a src kinase pathway. Mol. Cell. Biol. 2001;21:8414–8427. doi: 10.1128/MCB.21.24.8414-8427.2001. [DOI] [PMC free article] [PubMed] [Google Scholar]
- 26.Rodriguez EM, Dunham EE, Martin GS. Atypical protein kinase C activity is required for extracellular matrix degradation and invasion by Src-transformed cells. J. Cell. Physiol. 2009;221:171–182. doi: 10.1002/jcp.21841. [DOI] [PMC free article] [PubMed] [Google Scholar]
- 27.Bissell MJ, Hines WC. Why don’t we get more cancer? A proposed role of the microenvironment in restraining cancer progression. Nat. Med. 2011;17:320–329. doi: 10.1038/nm.2328. [DOI] [PMC free article] [PubMed] [Google Scholar]
- 28.Coussens LM, Werb Z. Inflammation and cancer. Nature. 2002;420:860–867. doi: 10.1038/nature01322. [DOI] [PMC free article] [PubMed] [Google Scholar]
- 29.Lukashev ME, Werb Z. ECM signalling: Orchestrating cell behaviour and misbehaviour. Trends Cell Biol. 1998;8:437–441. doi: 10.1016/s0962-8924(98)01362-2. [DOI] [PubMed] [Google Scholar]
- 30.Liotta LA, Kohn EC. The microenvironment of the tumour–host interface. Nature. 2001;411:375–379. doi: 10.1038/35077241. [DOI] [PubMed] [Google Scholar]
- 31.Bissell MJ, Labarge MA. Context, tissue plasticity, and cancer: Are tumor stem cells also regulated by the microenvironment? Cancer Cell. 2005;7:17–23. doi: 10.1016/j.ccr.2004.12.013. [DOI] [PMC free article] [PubMed] [Google Scholar]
- 32.Ruffell B, Affara NI, Coussens LM. Differential macrophage programming in the tumor microenvironment. Trends Immunol. 2012;33:119–126. doi: 10.1016/j.it.2011.12.001. [DOI] [PMC free article] [PubMed] [Google Scholar]
- 33.Wynn TA, Chawla A, Pollard JW. Macrophage biology in development, homeostasis and disease. Nature. 2013;496:445–455. doi: 10.1038/nature12034. [DOI] [PMC free article] [PubMed] [Google Scholar]
- 34.Balkwill FR, Mantovani A. Cancer-related inflammation: Common themes and therapeutic opportunities. Semin. Cancer Biol. 2012;22:33–40. doi: 10.1016/j.semcancer.2011.12.005. [DOI] [PubMed] [Google Scholar]
- 35.Atkinson GP, Nozell SE, Benveniste ET. NF-κB and STAT3 signaling in glioma: Targets for future therapies. Expert Rev. Neurother. 2010;10:575–586. doi: 10.1586/ern.10.21. [DOI] [PMC free article] [PubMed] [Google Scholar]
- 36.Karin M. NF-κB as a critical link between inflammation and cancer. Cold Spring Harb. Perspect. Biol. 2009;1:a000141. doi: 10.1101/cshperspect.a000141. [DOI] [PMC free article] [PubMed] [Google Scholar]
- 37.Ben-Neriah Y, Karin M. Inflammation meets cancer, with NF-κB as the matchmaker. Nat. Immunol. 2011;12:715–723. doi: 10.1038/ni.2060. [DOI] [PubMed] [Google Scholar]
- 38.Chaturvedi MM, Sung B, Yadav VR, Kannappan R, Aggarwal BB. NF-κB addiction and its role in cancer: “One size does not fit all”. Oncogene. 2011;30:1615–1630. doi: 10.1038/onc.2010.566. [DOI] [PMC free article] [PubMed] [Google Scholar]
- 39.Naugler WE, Karin M. NF-κB and cancer—Identifying targets and mechanisms. Curr. Opin. Genet. Dev. 2008;18:19–26. doi: 10.1016/j.gde.2008.01.020. [DOI] [PMC free article] [PubMed] [Google Scholar]
- 40.Laver T, Nozell S, Benveniste EN. The NF-κB signaling pathway in GBMs: Implications for apoptotic and inflammatory responses and exploitation for therapy. In: Van Meir EG, editor. CNS Cancer Models, Markers, Prognostic Factors, Targets, and Therapeutic Approaches. Humana Press; New York: 2009. pp. 1011–1036. [Google Scholar]
- 41.Staudt LM. Oncogenic activation of NF-κB. Cold Spring Harb. Perspect. Biol. 2010;2:a000109. doi: 10.1101/cshperspect.a000109. [DOI] [PMC free article] [PubMed] [Google Scholar]
- 42.Wang H, Zhang W, Huang HJ, Liao WS, Fuller GN. Analysis of the activation status of Akt, NFκB, and Stat3 in human diffuse gliomas. Lab. Invest. 2004;84:941–951. doi: 10.1038/labinvest.3700123. [DOI] [PubMed] [Google Scholar]
- 43.Bredel M, Scholtens DM, Yadav AK, Alvarez AA, Renfrow JJ, Chandler JP, Yu IL, Carro MS, Dai F, Tagge MJ, Ferrarese R, Bredel C, Phillips HS, Lukac PJ, Robe PA, Weyerbrock A, Vogel H, Dubner S, Mobley B, He X, Scheck AC, Sikic BI, Aldape KD, Chakravarti A, Harsh GRT. NFKBIA deletion in glioblastomas. N. Engl. J. Med. 2011;364:627–637. doi: 10.1056/NEJMoa1006312. [DOI] [PMC free article] [PubMed] [Google Scholar]
- 44.Grivennikov SI, Karin M. Inflammation and oncogenesis: A vicious connection. Curr. Opin. Genet. Dev. 2010;20:65–71. doi: 10.1016/j.gde.2009.11.004. [DOI] [PMC free article] [PubMed] [Google Scholar]
- 45.Mantovani A, Allavena P, Sica A, Balkwill F. Cancer-related inflammation. Nature. 2008;454:436–444. doi: 10.1038/nature07205. [DOI] [PubMed] [Google Scholar]
- 46.Tsuchiya S, Kobayashi Y, Goto Y, Okumura H, Nakae S, Konno T, Tada K. Induction of maturation in cultured human monocytic leukemia cells by a phorbol diester. Cancer Res. 1982;42:1530–1536. [PubMed] [Google Scholar]
- 47.Valster A, Tran NL, Nakada M, Berens ME, Chan AY, Symons M. Cell migration and invasion assays. Methods. 2005;37:208–215. doi: 10.1016/j.ymeth.2005.08.001. [DOI] [PubMed] [Google Scholar]
- 48.Mantovani A, Sica A. Macrophages, innate immunity and cancer: Balance, tolerance, and diversity. Curr. Opin. Immunol. 2010;22:231–237. doi: 10.1016/j.coi.2010.01.009. [DOI] [PubMed] [Google Scholar]
- 49.Grivennikov SI, Karin M. Inflammatory cytokines in cancer: Tumour necrosis factor and interleukin 6 take the stage. Ann. Rheum. Dis. 2011;70(Suppl.1):i104–i108. doi: 10.1136/ard.2010.140145. [DOI] [PubMed] [Google Scholar]
- 50.Terzić J, Grivennikov S, Karin E, Karin M. Inflammation and colon cancer. Gastroenterology. 2010;138:2101–2114.e5. doi: 10.1053/j.gastro.2010.01.058. [DOI] [PubMed] [Google Scholar]
- 51.Diaz-Meco MT, Dominguez I, Sanz L, Dent P, Lozano J, Municio MM, Berra E, Hay RT, Sturgill TW, Moscat J. ζPKC induces phosphorylation and inactivation of IκB-α in vitro. EMBO J. 1994;13:2842–2848. doi: 10.1002/j.1460-2075.1994.tb06578.x. [DOI] [PMC free article] [PubMed] [Google Scholar]
- 52.Duran A, Diaz-Meco MT, Moscat J. Essential role of RelA Ser311 phosphorylation by ζPKC in NF-κB transcriptional activation. EMBO J. 2003;22:3910–3918. doi: 10.1093/emboj/cdg370. [DOI] [PMC free article] [PubMed] [Google Scholar]
- 53.Leitges M, Sanz L, Martin P, Duran A, Braun U, Garcia JF, Camacho F, Diaz-Meco MT, Rennert PD, Moscat J. Targeted disruption of the ζPKC gene results in the impairment of the NF-κB pathway. Mol. Cell. 2001;8:771–780. doi: 10.1016/s1097-2765(01)00361-6. [DOI] [PubMed] [Google Scholar]
- 54.Moscat J, Diaz-Meco MT. The atypical protein kinase Cs. Functional specificity mediated by specific protein adapters. EMBO Rep. 2000;1:399–403. doi: 10.1093/embo-reports/kvd098. [DOI] [PMC free article] [PubMed] [Google Scholar]
- 55.do Carmo A, Balça-Silva J, Matias D, Lopes MC. PKC signaling in glioblastoma. Cancer Biol. Ther. 2013;14:287–294. doi: 10.4161/cbt.23615. [DOI] [PMC free article] [PubMed] [Google Scholar]
- 56.Moscat J, Diaz-Meco MT, Wooten MW. Of the atypical PKCs, Par-4 and p62: Recent understandings of the biology and pathology of a PB1-dominated complex. Cell Death Differ. 2009;16:1426–1437. doi: 10.1038/cdd.2009.119. [DOI] [PMC free article] [PubMed] [Google Scholar]
- 57.Parker SS, Mandell EK, Hapak SM, Maskaykina IY, Kusne Y, Kim JY, Moy JK, St John PA, Wilson JM, Gothard KM, Price TJ, Ghosh S. Competing molecular interactions of aPKC isoforms regulate neuronal polarity. Proc. Natl. Acad. Sci. U.S.A. 2013;110:14450–14455. doi: 10.1073/pnas.1301588110. [DOI] [PMC free article] [PubMed] [Google Scholar]
- 58.The Cancer Genome Atlas Research Network. McLendon R, Friedman A, Bigner D, Van Meir EG, Brat DJ, Mastrogianakis M, Olson JJ, Mikkelsen T, Lehman N, Aldape K, Alfred Yung WK, Bogler O, Vandenberg S, Berger M, Prados M, Muzny D, Morgan M, Scherer S, Sabo A, Nazareth L, Lewis L, Hall O, Zhu Y, Ren Y, Alvi O, Yao J, Hawes A, Jhangiani S, Fowler G, San Lucas A, Kovar C, Cree A, Dinh H, Santibanez J, Joshi V, Gonzalez-Garay ML, Miller CA, Milosavljevic A, Donehower L, Wheeler DA, Gibbs RA, Cibulskis K, Sougnez C, Fennell T, Mahan S, Wilkinson J, Ziaugra L, Onofrio R, Bloom T, Nicol R, Ardlie K, Baldwin J, Gabriel S, Lander ES, Ding L, Fulton RS, McLellan MD, Wallis J, Larson DE, Shi X, Abbott R, Fulton L, Chen K, Koboldt DC, Wendl MC, Meyer R, Tang Y, Lin L, Osborne JR, Dunford-Shore BH, Miner TL, Delehaunty K, Markovic C, Swift G, Courtney W, Pohl C, Abbott S, Hawkins A, Leong S, Haipek C, Schmidt H, Wiechert M, Vickery T, Scott S, Dooling DJ, Chinwalla A, Weinstock GM, Mardis ER, Wilson RK, Getz G, Winckler W, Verhaak RG, Lawrence MS, O’Kelly M, Robinson J, Alexe G, Beroukhim R, Carter S, Chiang D, Gould J, Gupta S, Korn J, Mermel C, Mesirov J, Monti S, Nguyen H, Parkin M, Reich M, Stransky N, Weir BA, Garraway L, Golub T, Meyerson M, Chin L, Protopopov A, Zhang J, Perna I, Aronson S, Sathiamoorthy N, Ren G, Wiedemeyer WR, Kim H, Won Kong S, Xiao Y, Kohane IS, Seidman J, Park PJ, Kucherlapati R, Laird PW, Cope L, Herman JG, Weisenberger DJ, Pan F, Van Den Berg D, Van Neste L, Mi Yi J, Schuebel KE, Baylin SB, Absher DM, Li JZ, Southwick A, Brady S, Aggarwal A, Chung T, Sherlock G, Brooks JD, Myers RM, Spellman PT, Purdom E, Jakkula LR, Lapuk AV, Marr H, Dorton S, Gi Choi Y, Han J, Ray A, Wang V, Durinck S, Robinson M, Wang NJ, Vranizan K, Peng V, Van Name E, Fontenay GV, Ngai J, Conboy JG, Parvin B, Feiler HS, Speed TP, Gray JW, Brennan C, Socci ND, Olshen A, Taylor BS, Lash A, Schultz N, Reva B, Antipin Y, Stukalov A, Gross B, Cerami E, Qing Wang W, Qin LX, Seshan VE, Villafania L, Cavatore M, Borsu L, Viale A, Gerald W, Sander C, Ladanyi M, Perou CM, Neil Hayes D, Topal MD, Hoadley KA, Qi Y, Balu S, Shi Y, Wu J, Penny R, Bittner M, Shelton T, Lenkiewicz E, Morris S, Beasley D, Sanders S, Kahn A, Sfeir R, Chen J, Nassau D, Feng L, Hickey E, Weinstein JN, Barker A, Gerhard DS, Vockley J, Compton C, Vaught J, Fielding P, Ferguson ML, Schaefer C, Madhavan S, Buetow KH, Collins F, Good P, Guyer M, Ozenberger B, Peterson J, Thomson E. Comprehensive genomic characterization defines human glioblastoma genes and core pathways. Nature. 2008;455:1061–1068. doi: 10.1038/nature07385. [DOI] [PMC free article] [PubMed] [Google Scholar]
- 59.Bivona TG, Hieronymus H, Parker J, Chang K, Taron M, Rosell R, Moonsamy P, Dahlman K, Miller VA, Costa C, Hannon G, Sawyers CL. FAS and NF-κB signalling modulate dependence of lung cancers on mutant EGFR. Nature. 2011;471:523–526. doi: 10.1038/nature09870. [DOI] [PMC free article] [PubMed] [Google Scholar]
- 60.Badie B, Schartner JM. Flow cytometric characterization of tumor-associated macrophages in experimental gliomas. Neurosurgery. 2000;46:957–961. doi: 10.1097/00006123-200004000-00035. discussion 961–952. [DOI] [PubMed] [Google Scholar]
- 61.Charles NA, Holland EC, Gilbertson R, Glass R, Kettenmann H. The brain tumor microenvironment. Glia. 2011;59:1169–1180. doi: 10.1002/glia.21136. [DOI] [PubMed] [Google Scholar]
- 62.Roggendorf W, Strupp S, Paulus W. Distribution and characterization of microglia/macrophages in human brain tumors. Acta Neuropathol. 1996;92:288–293. doi: 10.1007/s004010050520. [DOI] [PubMed] [Google Scholar]
- 63.Hussain SF, Yang D, Suki D, Aldape K, Grimm E, Heimberger AB. The role of human glioma-infiltrating microglia/macrophages in mediating antitumor immune responses. Neuro Oncol. 2006;8:261–279. doi: 10.1215/15228517-2006-008. [DOI] [PMC free article] [PubMed] [Google Scholar]
- 64.Parney IF, Waldron JS, Parsa AT. Flow cytometry and in vitro analysis of human glioma-associated macrophages. Laboratory investigation. J. Neurosurg. 2009;110:572–582. doi: 10.3171/2008.7.JNS08475. [DOI] [PMC free article] [PubMed] [Google Scholar]
- 65.Galarneau H, Villeneuve J, Gowing G, Julien JP, Vallières L. Increased glioma growth in mice depleted of macrophages. Cancer Res. 2007;67:8874–8881. doi: 10.1158/0008-5472.CAN-07-0177. [DOI] [PubMed] [Google Scholar]
- 66.Zhang L, Alizadeh D, Van Handel M, Kortylewski M, Yu H, Badie B. Stat3 inhibition activates tumor macrophages and abrogates glioma growth in mice. Glia. 2009;57:1458–1467. doi: 10.1002/glia.20863. [DOI] [PubMed] [Google Scholar]
- 67.Bettinger I, Thanos S, Paulus W. Microglia promote glioma migration. Acta Neuropathol. 2002;103:351–355. doi: 10.1007/s00401-001-0472-x. [DOI] [PubMed] [Google Scholar]
- 68.Zhai H, Heppner FL, Tsirka SE. Microglia/macrophages promote glioma progression. Glia. 2011;59:472–485. doi: 10.1002/glia.21117. [DOI] [PMC free article] [PubMed] [Google Scholar]
- 69.Markovic DS, Glass R, Synowitz M, Rooijen N, Kettenmann H. Microglia stimulate the invasiveness of glioma cells by increasing the activity of metalloprotease-2. J. Neuropathol. Exp. Neurol. 2005;64:754–762. doi: 10.1097/01.jnen.0000178445.33972.a9. [DOI] [PubMed] [Google Scholar]
- 70.Markovic DS, Vinnakota K, Chirasani S, Synowitz M, Raguet H, Stock K, Sliwa M, Lehmann S, Kälin R, van Rooijen N, Holmbeck K, Heppner FL, Kiwit J, Matyash V, Lehnardt S, Kaminska B, Glass R, Kettenmann H. Gliomas induce and exploit microglial MT1-MMP expression for tumor expansion. Proc. Natl. Acad. Sci. U.S.A. 2009;106:12530–12535. doi: 10.1073/pnas.0804273106. [DOI] [PMC free article] [PubMed] [Google Scholar]
- 71.Coniglio SJ, Eugenin E, Dobrenis K, Stanley ER, West BL, Symons MH, Segall JE. Microglial stimulation of glioblastoma invasion involves epidermal growth factor receptor (EGFR) and colony stimulating factor 1 receptor (CSF-1R) signaling. Mol. Med. 2012;18:519–527. doi: 10.2119/molmed.2011.00217. [DOI] [PMC free article] [PubMed] [Google Scholar]
- 72.Pyonteck SM, Akkari L, Schuhmacher AJ, Bowman RL, Sevenich L, Quail DF, Olson OC, Quick ML, Huse JT, Teijeiro V, Setty M, Leslie CS, Oei Y, Pedraza A, Zhang J, Brennan CW, Sutton JC, Holland EC, Daniel D, Joyce JA. CSF-1R inhibition alters macrophage polarization and blocks glioma progression. Nat. Med. 2013;19:1264–1272. doi: 10.1038/nm.3337. [DOI] [PMC free article] [PubMed] [Google Scholar]
- 73.Bhat KP, Balasubramaniyan V, Vaillant B, Ezhilarasan R, Hummelink K, Hollingsworth F, Wani K, Heathcock L, James JD, Goodman LD, Conroy S, Long L, Lelic N, Wang S, Gumin J, Raj D, Kodama Y, Raghunathan A, Olar A, Joshi K, Pelloski CE, Heimberger A, Kim SH, Cahill DP, Rao G, Den Dunnen WF, Boddeke HW, Phillips HS, Nakano I, Lang FF, Colman H, Sulman EP, Aldape K. Mesenchymal differentiation mediated by NF-κB promotes radiation resistance in glioblastoma. Cancer Cell. 2013;24:331–346. doi: 10.1016/j.ccr.2013.08.001. [DOI] [PMC free article] [PubMed] [Google Scholar]
- 74.Shiao SL, Ganesan AP, Rugo HS, Coussens LM. Immune microenvironments in solid tumors: New targets for therapy. Genes Dev. 2011;25:2559–2572. doi: 10.1101/gad.169029.111. [DOI] [PMC free article] [PubMed] [Google Scholar]
- 75.Coussens LM, Zitvogel L, Palucka AK. Neutralizing tumor-promoting chronic inflammation: A magic bullet? Science. 2013;339:286–291. doi: 10.1126/science.1232227. [DOI] [PMC free article] [PubMed] [Google Scholar]
- 76.Tiscornia G, Singer O, Verma IM. Production and purification of lentiviral vectors. Nat. Protoc. 2006;1:241–245. doi: 10.1038/nprot.2006.37. [DOI] [PubMed] [Google Scholar]
- 77.Ghosh S, Tergaonkar V, Rothlin CV, Correa RG, Bottero V, Bist P, Verma IM, Hunter T. Essential role of tuberous sclerosis genes TSC1 and TSC2 in NF-κB activation and cell survival. Cancer Cell. 2006;10:215–226. doi: 10.1016/j.ccr.2006.08.007. [DOI] [PubMed] [Google Scholar]
- 78.Pistollato F, Persano L, Puppa AD, Rampazzo E, Basso G. Isolation and expansion of regionally defined human glioblastoma cells in vitro. Curr. Protoc. Stem Cell Biol. 2011 doi: 10.1002/9780470151808.sc0304s17. Chap. 3, Unit 3.4. [DOI] [PubMed] [Google Scholar]
Associated Data
This section collects any data citations, data availability statements, or supplementary materials included in this article.