Abstract
Latent tuberculosis infection affects one third of the world’s population and can reactivate (relapse) decades later. However, current technologies, dependent on postmortem analyses, cannot follow the temporal evolution of disease.
Methods
C3HeB/FeJ mice, which develop necrotic and hypoxic tuberculosis lesions, were aerosol-infected with Mycobacterium tuberculosis. PET and CT were used to serially image the same cohort of infected mice through pretreatment, tuberculosis treatment, and subsequent development of relapse.
Results
A novel diffeomorphic registration was successfully used to monitor the spatial evolution of individual pulmonary lesions. Although most lesions during relapse developed in the same regions as those noted during pretreatment, several lesions also arose de novo within regions with no prior lesions.
Conclusion
This study presents a novel model that simulates infection and reactivation disease as seen in humans and could prove valuable to study tuberculosis pathogenesis and evaluate novel therapeutics.
Keywords: tuberculosis, reactivation, latent, mouse, diffeomorphic registration
Mycobacterium tuberculosis is the one of the deadliest infectious diseases in the world and was responsible for an estimated 8.6 million new cases of active tuberculosis and 1.3 million deaths in 2012 alone (1). Additionally, one third of the world’s population is estimated to have latent tuberculosis infection. Those with latent tuberculosis are asymptomatic but harbor dormant M. tuberculosis, which can reactivate and lead to active disease decades after the initial infection. Hallmark features of human tuberculosis include the development of discrete necrotic and hypoxic lesions.
Currently, standard methodologies for studying tuberculosis cannot reliably monitor and identify the spatial location of tuberculosis lesions and reactivation within the same animal because monitoring disease requires sacrificing animals at various time points during the study. However, 18F-FDG is known to accumulate in neutrophils and activated macrophages (2), and 18F-FDG PET combined with CT has been used to monitor lesions in M. tuberculosis–infected animals as well as in tuberculosis patients (3–5). In this study, we used noninvasive 18F-FDG PET/CT and a novel diffeomorphic registration methodology to image a mouse strain that develops necrotic and hypoxic lesions akin to humans (6,7) and study the temporal evolution of reactivation pulmonary tuberculosis (relapse).
MATERIALS AND METHODS
All protocols were approved by the Johns Hopkins Biosafety, Radiation Safety, and Animal Care and Use Committees.
Four- to 6-wk-old female C3HeB/FeJ (Jackson Laboratory) mice were aerosol-infected with M. tuberculosis H37Rv using the Middlebrook Inhalation Exposure System (Glas-Col) with frozen titrated bacterial stocks. After 6 wk, mice were administered the standard first-line tuberculosis regimen consisting of rifampin (10 mg/kg/d), isoniazid (25 mg/kg/d), and pyrazinamide (150 mg/kg/d) by gavage 5 d per week for 10 wk (8). Mice developed relapse over the subsequent 12 wk. One cohort of animals was serially imaged, whereas a separate cohort of similarly infected and treated mice (n = 4 for each time point) was sacrificed to determine the pulmonary bacillary burden as colony-forming units (CFU) (3,6).
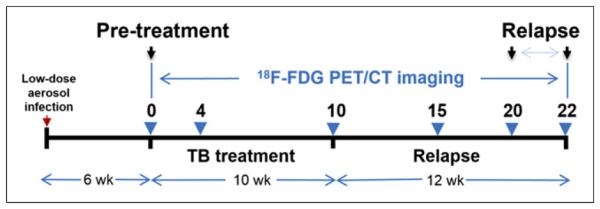
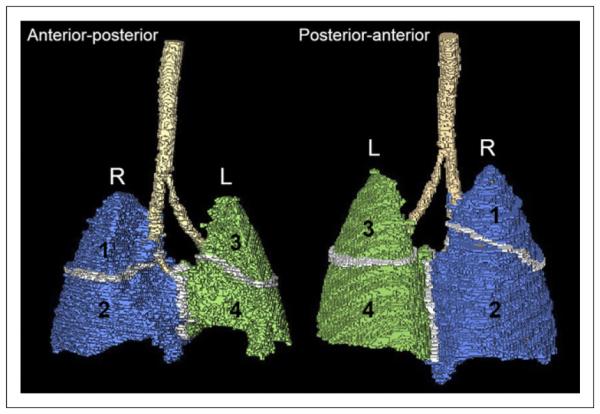
The same group of live M. tuberculosis–infected mice were serially imaged with 18F-FDG PET/CT within sealed biocontainment devices (9) using methods described previously (Fig. 1) (3). Briefly, the night before imaging, mice were fasted for 12 h. Water was provided ad libitum. Each mouse was weighed, injected with 7.4 MBq of 18F-FDG via the tail vein, and imaged 45 min after injection using the Mosaic HP (Philips) small-animal PET scanner with 15-min static acquisition. ACT scan was also obtained at the same time using the NanoSPECT/CT (Bioscan) animal imager. PET images were reconstructed (3-dimensional row-action maximum-likelihood algorithm) and coregistered with CT images using Amira 5.4.2 (Visualization Science Group). At the end of the study, all mice were sacrificed. Lungs were harvested aseptically from each mouse and carefully sectioned into 4 regions (Fig. 2). Each region was plated to determine the presence of bacteria.
FIGURE 1.

Timeline showing tuberculosis (TB) infection, incubation, treatment, and 12-wk relapse period. Infected mice were imaged with 18F-FDG PET/CT at specific time points (blue arrows).
FIGURE 2.

Three-dimensional template with lung regions defined for this study corresponding to lobes: right upper (region 1), right middle and lower (region 2), left upper (region 3), and left lower (region 4). L = left; R = right.
To accurately follow the evolution of tuberculosis granulomas across time points, all imaging sets were coregistered, such that voxels from each image set matched the imaging sets from all other time points using the large deformation diffeomorphic metric matching algorithm (10,11). This algorithm allowed for accurate monitoring of the temporal evolution of each tuberculosis lesion in the same mouse by accounting for any morphometric differences due to positioning or other anatomic changes, such as aging (12). Four PET images from 4 uninfected animals, imaged at the same time points as the infected mice, were used to estimate the background signal. To eliminate detection of spurious voxels, tuberculosis lesions were defined by identifying voxels using a highly stringent PET threshold (≥14.645 SDs above the mean of uninfected controls; top 0.0001%) with MATLAB (The MathWorks) and were manually verified on the corresponding CT image sets. Statistical comparisons between groups were performed using a χ2 or a Wilcoxon paired test using MATLAB.
RESULTS
To simulate human disease, we used a low-dose aerosol infection of C3HeB/FeJ mice and allowed for 6 wk of incubation, when pulmonary lesions evolve into discrete necrotic, hypoxic lesions (6). Pulmonary implantation 1 d after infection was 1.69 ± 0.09 log10 CFU. Six weeks after the infection and at the time of initiation of tuberculosis treatment, the pulmonary bacterial burden was 7.92 ± 0.82 log10 CFU. Consistent with previously published data (3), standard 10-wk tuberculosis treatment reduced the bacterial burden in the lungs to 1.49 ± 1.06 log10 CFU, which represents the dormant pool and is responsible for reactivation tuberculosis. This model of using tuberculosis treatment to enrich for dormant bacteria is referred to as the Cornell model and has been extensively used to model latent tuberculosis infection (13).
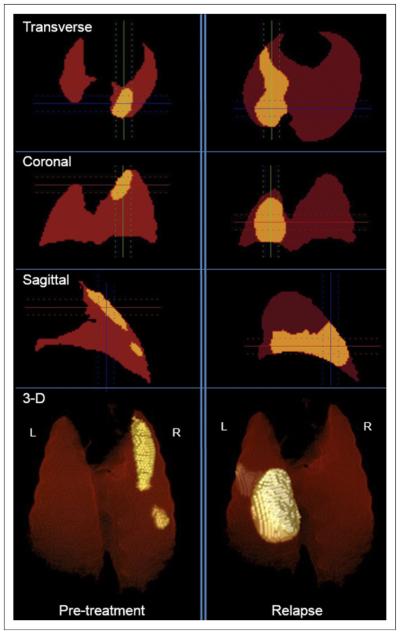
Twenty-four M. tuberculosis–infected mice were imaged during the study and generated a total of 133 sets of PET and CT images. Large deformation diffeomorphic metric matching successfully coregistered all PET and CT image sets. One mouse was euthanized before the relapse imaging because of sickness and was not included in the study. Relapse developed in 17 mice at the 20- or 22- wk time points. Fifteen of the 17 mice that relapsed had at least 1 discrete lesion at both the pretreatment and the relapse time points; these 15 mice were included in the analysis. Images from the lungs of a representative mouse showing tuberculosis lesions during pretreatment and relapse are shown in Figure 3. As indicated, although the tuberculosis lesion during pretreatment is in the right upper region (region 1), relapse develops in a different region (left lower; region 4).
FIGURE 3.
Transverse, sagittal, coronal, and 3-dimensional PET images of a representative M. tuberculosis–infected mouse corrected for spatial orientation during pretreatment and relapse. Lesion (above defined PET threshold) is shown in yellow. L = left; R = right.
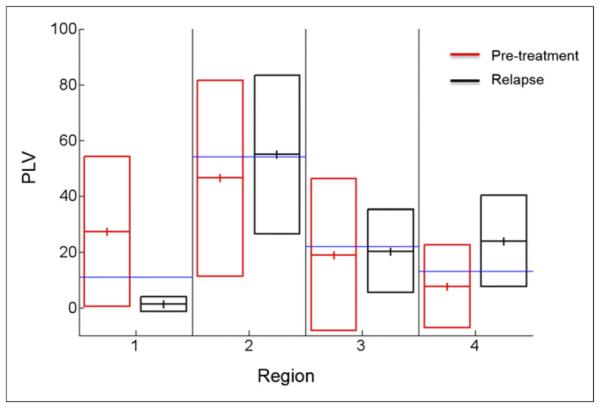
Tuberculosis lesion distribution was initially assumed to be random, and the number of lesions in each region was therefore expected to be proportional to the volume of the region (Table 1). Thus, the observed proportional lesion volume (PLV) was defined and calculated as the actual volume of the lesions in a given region divided by the total volume of all lesions in every region. For each mouse, the sum of the PLVs of the 4 regions equaled 1. Voxels were assigned to a region by applying a mask filter using a template image for the regions. Box plots showing the PLV for each lung region during pretreatment and relapse are shown in Figure 4. We assessed whether the distribution of lesions was proportional to the regional volume and found that there was preferential location for lesions during both pretreatment and relapse: comparing the distribution of tuberculosis lesions for the entire lung volume (all 4 regions combined) during pretreatment and relapse revealed that there may be some difference in the location in which relapse occurs (χ2, P = 0.10). Statistical analysis of the difference in PLV from relapse to pretreatment in individual regions showed significant difference (Wilcoxon test, P < 0.01) in regions 1 and 4 but not in regions 2 and 3. Postmortem analyses after the completion of imaging demonstrated live bacteria from the sites of relapse.
TABLE 1.
Expected PLV per Region
| Region | Lobe | Volume (mm3) |
Expected PLV (%) |
|---|---|---|---|
| 1 | Right upper | 63 | 11 |
|
| |||
| 2 | Right middle/ lower |
309 | 54 |
|
| |||
| 3 | Left upper | 125 | 22 |
|
| |||
| 4 | Left lower | 74 | 13 |
FIGURE 4.

Box plots showing PLV for each lung region during pretreatment and relapse. Although observed PLVs are similar to expected PLV during pretreatment and relapse in regions 2 and 3, PLVs are significantly higher in regions 1 (pretreatment) and 4 (relapse) (Wilcoxon test, P < 0.01). Data from 15 M. tuberculosis–infected mice are shown. Blue line indicates expected PLV for each region. Solid lines represent mean ± SD.
DISCUSSION
Development of necrotic tuberculosis granulomas is the hallmark of human disease, and dormant M. tuberculosis bacilli are commonly believed to inhabit these lesions. When the immune system is weakened, dormant M. tuberculosis are thought to reactivate, leading to reactivation tuberculosis within the same granulomatous compartments. However, the spatial location of dormant bacteria has never been demonstrated experimentally in live hosts, and their precise location still remains elusive. Furthermore, Hernandez-Pando et al. have shown that M. tuberculosis can be detected in lung tissues of humans with latent tuberculosis infection outside of the granuloma and without histologic evidence of tuberculosis lesions (14). We hypothesized that dormant mycobacteria may reside both inside and outside the macroscopically visible tuberculosis lesions and that we could identify these compartments by serial noninvasive monitoring. Studying the spatial location of dormant bacteria allows for better understanding of tuberculosis disease and for developing more effective control measures.
PET imaging was used because it can provide a 3-dimensional view of the disease process, irrespective of the signal depth. Although the location of tuberculosis lesions in regions 2 and 3 was similar during pretreatment and relapse, regions 1 and 4 did not follow this pattern. Tuberculosis lesions were preferentially located in region 1 pretreatment and reappeared preferentially in region 4 during relapse. In humans, original lesions tend to form in the lower lobes, with more than 90% of relapse lesions forming in the upper lobes (15). Because mice are quadruped (vs. bipedal humans), the left lower lobe (region 4) is located higher than the upper lobes (regions 1 and 3) and therefore these data may be comparable to what is observed in humans. Anatomic differences, including airway branching patterns (16) and respiration mechanics or lymphatics, which could transport the bacteria to various lobes of the lungs, could also account for preferential location of lesions. 18F-FDG PET monitors host metabolic activity and not bacteria themselves. Because M. tuberculosis–specific PET tracers are not available, live bacteria were cultured from the sites of relapse in this study, confirming the 18F-FDG PET data.
A novel diffeomorphic registration method enabled accurate spatial monitoring of each individual tuberculosis lesion temporally in this study. Bagci et al. have also developed a similar automated computer-aided platform for the detection and quantification of pulmonary infections in small animals. Furthermore, they have demonstrated that their method has excellent agreement with the clinical standard of manual or semiautomated interpretations (17). Therefore, these methodologies could become important tools for monitoring infections, and could also be applied to other pulmonary diseases.
CONCLUSION
This study presents a model that simulates infection and reactivation disease in humans and could provide a valuable means to study disease pathogenesis and for evaluating therapeutics. Contrary to the commonly held belief, our findings suggest that dormant bacteria may also reside outside tuberculosis lesions and cause relapse in regions where no apparent lesions were present initially.
Acknowledgments
The costs of publication of this article were defrayed in part by the payment of page charges. Therefore, and solely to indicate this fact, this article is hereby marked “advertisement” in accordance with 18 USC section 1734. This study was funded by the NIH Director’s New Innovator DP2-OD006492-01 and R01-HL116316-01. The funders had no role in study design, data collection and analysis, decision to publish, or preparation of the manuscript.
Footnotes
DISCLOSURE
No other potential conflict of interest relevant to this article was reported.
REFERENCES
- 1.World Health Organization . Global tuberculosis report 2013. World Health Organization; Geneva, Switzerland: 2013. [Google Scholar]
- 2.Kubota R, Yamada S, Kubota K, Ishiwata K, Tamahashi N, Ido T. Intratumoral distribution of fluorine-18-fluorodeoxyglucose in vivo: high accumulation in macrophages and granulation tissues studied by microautoradiography. J Nucl Med. 1992;33:1972–1980. [PubMed] [Google Scholar]
- 3.Davis SL, Nuermberger EL, Um PK, et al. Noninvasive pulmonary [18F]-2-fluoro-deoxy-D-glucose positron emission tomography correlates with bactericidal activity of tuberculosis drug treatment. Antimicrob Agents Chemother. 2009;53:4879–4884. doi: 10.1128/AAC.00789-09. [DOI] [PMC free article] [PubMed] [Google Scholar]
- 4.Coleman MT, Maiello P, Tomko J, et al. Early changes by 18Fluorodeoxyglucose positron emission tomography coregistered with computed tomography predict outcome after Mycobacterium tuberculosis infection in cynomolgus macaques. Infect Immun. 2014;82:2400–2404. doi: 10.1128/IAI.01599-13. [DOI] [PMC free article] [PubMed] [Google Scholar]
- 5.Sathekge M, Maes A, Kgomo M, Stoltz A, Van de Wiele C. Use of 18F-FDG PET to predict response to first-line tuberculostatics in HIV-associated tuberculosis. J Nucl Med. 2011;52:880–885. doi: 10.2967/jnumed.110.083709. [DOI] [PubMed] [Google Scholar]
- 6.Harper J, Skerry C, Davis SL, et al. Mouse model of necrotic tuberculosis granulomas develops hypoxic lesions. J Infect Dis. 2012;205:595–602. doi: 10.1093/infdis/jir786. [DOI] [PMC free article] [PubMed] [Google Scholar]
- 7.Pan H, Yan BS, Rojas M, et al. Ipr1 gene mediates innate immunity to tuberculosis. Nature. 2005;434:767–772. doi: 10.1038/nature03419. [DOI] [PMC free article] [PubMed] [Google Scholar]
- 8.Rosenthal IM, Zhang M, Williams KN, et al. Daily dosing of rifapentine cures tuberculosis in three months or less in the murine model. PLoS Med. 2007;4:e344. doi: 10.1371/journal.pmed.0040344. [DOI] [PMC free article] [PubMed] [Google Scholar]
- 9.Davis SL, Be NA, Lamichhane G, et al. Bacterial thymidine kinase as a non-invasive imaging reporter for Mycobacterium tuberculosis in live animals. PLoS ONE. 2009;4:e6297. doi: 10.1371/journal.pone.0006297. [DOI] [PMC free article] [PubMed] [Google Scholar]
- 10.Vidal C, Hewitt J, Davis S, Younes L, Jain S, Jedynak B. Template registration with missing parts: application to the segmentation of M. tuberculosis infected lungs. Paper presented at: IEEE International Symposium on Biomedical Imaging: From Nano to Macro, 2009; Boston, MA. 2009. ISBI ’09; June 28, 2009–July 1. [DOI] [PMC free article] [PubMed] [Google Scholar]
- 11.Vidal C, Beggs D, Younes L, Jain SK, Jedynak B. Incorporating user input in template-based segmentation. Paper presented at: IEEE International Symposium on Biomedical Imaging: From Nano to Macro; Chicago, IL. 2011. 2011; March 30, 2011–April 2. [DOI] [PMC free article] [PubMed] [Google Scholar]
- 12.Beg MF, Miller MI, Trouve A, Younes L. Computing large deformation metric mappings via geodesic flows of diffeomorphisms. Int J Comput Vis. 2005;61:139–157. [Google Scholar]
- 13.McCune RM, Feldmann FM, McDermott W. Microbial persistence. II. Characteristics of the sterile state of tubercle bacilli. J Exp Med. 1966;123:469–486. doi: 10.1084/jem.123.3.469. [DOI] [PMC free article] [PubMed] [Google Scholar]
- 14.Hernández-Pando R, Jeyanathan M, Mengistu G, et al. Persistence of DNA from Mycobacterium tuberculosis in superficially normal lung tissue during latent infection. Lancet. 2000;356:2133–2138. doi: 10.1016/s0140-6736(00)03493-0. [DOI] [PubMed] [Google Scholar]
- 15.Balasubramanian V, Wiegeshaus EH, Taylor BT, Smith DW. Pathogenesis of tuberculosis: pathway to apical localization. Tuber Lung Dis. 1994;75:168–178. doi: 10.1016/0962-8479(94)90002-7. [DOI] [PubMed] [Google Scholar]
- 16.Ware LB. Modeling human lung disease in animals. Am J Physiol Lung Cell Mol Physiol. 2008;294:L149–L150. doi: 10.1152/ajplung.00472.2007. [DOI] [PubMed] [Google Scholar]
- 17.Bagci U, Foster B, Miller-Jaster K, et al. A computational pipeline for quantification of pulmonary infections in small animal models using serial PET-CT imaging. EJNMMI Res. 2013;3:55. doi: 10.1186/2191-219X-3-55. [DOI] [PMC free article] [PubMed] [Google Scholar]


