

Abstract
Background
A number of studies have provided information regarding the risks and benefits of mammalian target of rapamycin inhibitors (mTOR-I) combined with calcineurin inhibitors (CNI) versus mycophenolic acid (MPA).
Methods
Medline, Embase and the Cochrane Central Register of Controlled Trials were searched. Randomized controlled trials comparing mTOR-I to MPA as the primary immunosuppressive regimen in combination with CNI were selected and meta-analyzed.
Results
Eleven randomized controlled trials consisting of 4930 patients in total were included. No significant difference was observed in the risk of biopsy-proven acute rejection and patient death between the two groups. However, an increased risk of graft loss (relative risk (RR) = 1.20) and inferior graft function (creatinine clearance, weighted mean difference (WMD) = −2.41 μmol/L) were demonstrated in mTOR-I-treated patients. Patients treated with mTOR-I had a higher risk of new-onset diabetes mellitus (RR = 1.32), dyslipidemia, proteinuria (RR = 1.79), peripheral edema (RR = 1.34), thrombocytopenia (RR = 1.97) and lymphocoele (RR = 1.80), but a lower risk of cytomegalovirus infection (RR = 0.40), malignancy (RR = 0.64) and leucopenia (RR = 0.43). There was no difference in diarrhea, anemia, urinary tract infection, polyoma virus infection and impaired wound healing when mTOR-I was compared with MPA.
Conclusions
mTOR-I showed no particular superiority to MPA. Notably, mTOR-I had an increased risk of graft loss when combined with CNI, even when combined with a reduced dose of CNI. Therefore, the optimal dosage strategies for mTOR-I and CNI need to be further explored.
Electronic supplementary material
The online version of this article (doi:10.1186/s12882-015-0078-5) contains supplementary material, which is available to authorized users.
Keywords: mTOR inhibitor, Mycophenolic acid, Kidney transplantation, Meta-analysis
Background
Kidney transplantation is the best treatment available for most patients with end-stage renal disease; therefore optimal immunosuppression regimens are critical for long-term graft and patient survival. The aim of the introduction of every new immunosuppressive drug is to reduce the incidence of acute rejection, minimize adverse effects and improve long-term patient and graft survival [1, 2]. Since mycophenolic acid (MPA) was introduced into solid organ transplantation, it has largely replaced azathioprine (AZA) as the antimetabolite immunosuppressive of choice in kidney transplantation [3–7]. The current preferred immunosuppressive regimen in most transplant centers is based on the combination of mycophenolic acid (mycophenolate mofetil (MMF) or enteric-coated mycophenolate sodium (EC-MPS)) with a calcineurin inhibitor (CNI: tacrolimus or ciclosporin A) and corticosteroid. Recently, mammalian target of rapamycin inhibitors (mTOR-I; sirolimus and everolimus) with novel mechanisms of action have been used in organ transplantation, providing additional options for new strategies that produce potent immunosuppression to prevent acute rejection, while simultaneously reducing the adverse effects associated with CNI therapies [8, 9].
In 2006, Webster et al. published the first systematic review and meta-analysis on mTOR-I use as the primary immunosuppression in kidney transplantation patients [10]. In that meta-analysis, the authors evaluated mTOR-I versus antimetabolites (MMF and AZA) in de novo kidney recipients. The data of this review were limited beyond 2 years post-transplantation, thus the long-term effects of mTOR-I are unclear. Furthermore, in recent years, azathioprine has not routinely been used in most transplant centers. Therefore we have evaluated the latest evidence on the efficacy and safety of mTOR-I versus MPA, in combination with CNI, in kidney transplantation.
Materials and methods
Search strategy and selection criteria
A systematic literature search was performed from study inception to June 30, 2014 in the following databases: the Cochrane Central Register of Controlled Trials, Medline and Embase, combined with the following MeSH terms: mammalian target of rapamycin inhibitor, mTOR inhibitor, mTOR-I, rapamycin, Rapamune, everolimus, sirolimus, MPA, mycophenolic acid, MMF, mycophenolate mofetil, CellCept (Roche, Basel, Switzerland), EC-MPS, enteric-coated mycophenolate sodium, calcineurin inhibitor, CNI, ciclosporin/cyclosporine, Neoral, Sandimmune, CsA, tacrolimus, Prograf, FK506 and kidney/renal transplantation. The reference lists from the included studies were examined for further potentially relevant references. Reference lists of the identified papers were also searched for additional relevant studies.
Only the randomized controlled trials in which kidney transplant recipients (with no additional organ transplantation, such as pancreas) receiving CNI-based immunosuppression containing mTOR-I (everolimus or sirolimus) were compared with MPA (MMF or EC-MPS) in the immediate post-transplant period were included. There was no restriction on the language of trial report, type of donor, age of recipients, or dosage of immunosuppressive drugs.
All titles, abstracts and, where required, the full text of identified reports were independently screened by X.X. and Y.J. to determine which studies satisfied the inclusion criteria, with disagreement resolved by discussion. Data on demographic information, study design, interventions and outcomes were extracted independently by the same two authors using a predesigned data extraction form before meta-analysis. Considering duplicated reports of the same trial or patient group, the latest complete publication was identified. However, any other reports that including additional outcome data also contributed to the meta-analysis.
Outcome measures
The primary outcome measures investigated were biopsy-proven acute rejection (BPAR), graft loss (censored for death and including death with a functioning graft) and patient death. The secondary outcomes were graft function (including serum creatinine, creatinine clearance or calculated glomerular filtration rate [GFR]), infection rates (total infections, urinary tract infection (UTI), cytomegalovirus (CMV) and polyma virus), malignancy, and a range of treatment-related adverse reactions (including hematological, gastrointestinal and biochemical indices, surgical, and cosmetic).
Assessment of risk of bias
The quality of trials was independently assessed by X.X. and Y.J. using the Cochrane risk of bias assessment tool [11]. The checklist assessed risk of bias in sequence generation, allocation concealment, blinding, attrition, reporting and other areas. Disagreement was resolved by discussion. As for the study quality, all reports from the same trial were assessed and the information pooled.
Statistical analysis
The Review Manager 5.2 program (Cochrane Collaboration, London, UK) and Stata version 11 (Stata Corp., College Station, TX, USA) were used for meta-analysis. A P-value of P < 0.05 was considered to be statistically significant. Dichotomous data are expressed as therelative risk (RR), and continuous data are expressed as the weighted mean difference (WMD). All summary effects are presented with 95 % confidence intervals (CI). Analysis used both random and fixed models (depending on the absence or presence of heterogeneity) to estimate the effect size for each outcome measure. If heterogeneity was observed, a random effect model was used. Statistical heterogeneity between trials was assessed using the I2 and Cochran Q test. An I2 value greater than 40 % or a Cochran Q P-value less than 0.1 indicated significant levels of heterogeneity. Publication bias was assessed by funnel plots and the Egger test.
Subgroup analysis and univariate meta-regression were used where possible to explore the potential sources of heterogeneity based on the specific mTOR-I and MPA used, the induction agents used, the combination of immunosuppressive co-interventions, the different doses of immunosuppressive treatment and the length of follow-up. A P-value of P < 0.05 was considered statistically significant.
Results
Literature search and included trials
The results of the literature search are illustrated in Fig. 1. Twenty-one reports from 11 trials were identified [12–22], with a total of 4930 randomized participants.
Fig. 1.
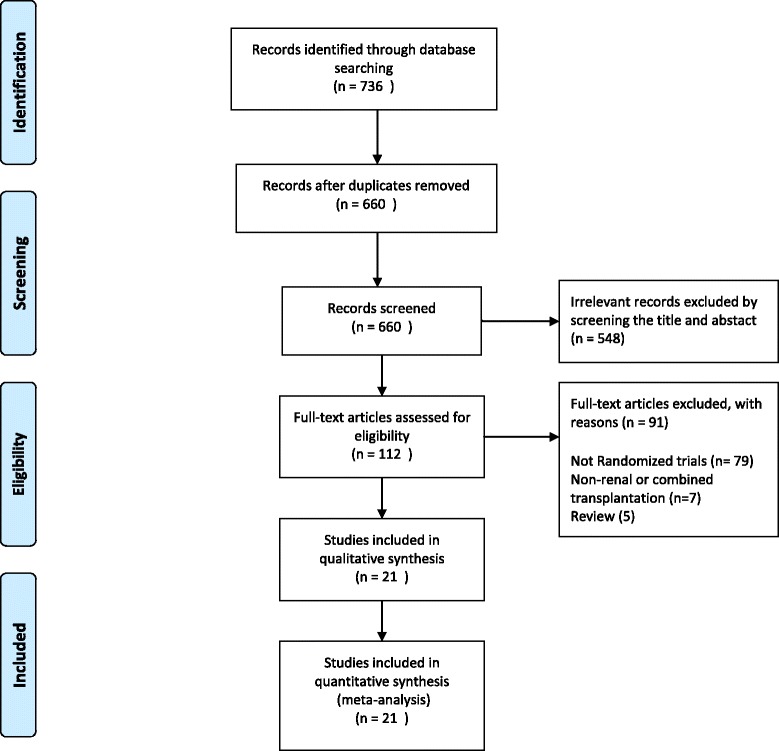
Flowchart showing the process of identification of randomized controlled trials for inclusion in the meta-analysis
All of the included reports were published in English. Seven randomized controlled trials were multicenter trials [12–15, 17, 21, 22]. Seven trials compared sirolimus to MMF [13, 15–20], while 3 trials compared everolimus to MMF [12, 14, 22], and 1 trial compared everolimus to EC-MPS [21]. Five trials had two arms [12, 17, 18, 20, 22], and 5 trials had three arms [13–15, 19, 21]: four of these examined the effects of two different doses of mTOR-I compared with MPA, and the other one compared mTOR-I combined with different CNI to MMF combined with CsA. One trial had four arms that investigated sirolimus versus MMF when combined with different CNI [16]. Two trials used a rapid steroid withdrawal immunosuppression protocol, all recipients received no more than 3 doses of methylprednisolone, then steroid therapy was discontinued [16, 20]. Five trials used basiliximab induction [12, 16, 20–22], while 1 trial used daclizumab induction [19], and 5 trials received no induction therapy [13–15, 17, 18]. The basic characteristics of the included trials are summarized in Table 1.
Table 1.
Characteristics of the included trials
| Trials | Multicentre trial | Induction | mTOR-I group | MPA group | Follow-up (years) | ||||
|---|---|---|---|---|---|---|---|---|---|
| Country | No.(male) | Maintenance | Dose/target level | Maintenance | Dose/target level | ||||
| Vitko et al. 2005 | Multiple | Yes | 588 (380) | None | EVE + CsA + ST | 1.5 mg/d | MMF + CsA + ST | 2 g/d | 3 |
| 3 mg/d | |||||||||
| Lorber et al. 2005 | Multiple | Yes | 583 (365) | Bas | EVE + RD-CsA + ST | 1.5 mg/d | MMF + CsA + ST | 2 g/d | 3 |
| 3 mg/d | |||||||||
| Mendez et al. 2005 | America | Yes | 361 (246) | None | SRL + TAC + ST | 2 mg/d | MMF + TAC + ST | 2 g/d | 1 |
| Vitko et al. 2006 | Multiple | Yes | 977 (624) | None | SRL + TAC + ST | 0.5 mg/d | MMF + TAC + ST | 1 g/d | 0.5 |
| 2 mg/d | |||||||||
| Kumar et al. 2008 | America | No | 200 (140) | Bas | SRL + TAC | 5-10 ng/ml | MMF + TAC | 1-3 u/ml | 5 |
| SRL + CsA | 5-10 ng/ml | MMF + CsA | 1-3 u/ml | ||||||
| Sampaio et al. 2008 | Brazil | Yes | 100 (69) | None | SRL + TAC + ST | 2 mg/d | MMF + TAC + ST | 2 g/d | 1 |
| Gurp et al. 2010 | Multiple | Yes | 634 (408) | None | SRL + RD-TAC + ST | 1 mg/d | MMF + TAC + ST | 1 mg/d | 0.5 |
| Guerra et al. 2011 | America | No | 150 (99) | Dac | SRL + TAC + ST | 6-10 ng/ml | MMF + TAC + ST | 2 g/d | 8 |
| SRL + CsA + ST | 6-10 ng/ml | ||||||||
| Chhabra et al. 2012 | America | No | 82 (50) | Bas | SRL + TAC | 7-10 ng/ml | MMF + TAC | 2 g/d | 8.5 |
| Crbrik et al. 2013 | Multiple | Yes | 833 (557) | Bas | EVE + RD-CsA ± ST | 1.5 mg/d | Ec-MPS + CsA ± ST | 1.44 g/d | 2 |
| 3 mg/d | |||||||||
| Takahashi 2013 | Japan | Yes | 122 (83) | Bas | EVE + RD-CsA + ST | 3-8 ng/ml | MMF + CsA + ST | 2 g/d | 1 |
Bas basiliximab; Dac daclizumab; EVE everolimus; SRL sriolimus; TAC tacrolimus; CsA ciclosporin; ST steroid; MMF mycophenloate mofetil; Ec-MPS enteric-coated mycophenolate sodium
RD-CNI, patients in mTOR-I group received a reduced dose of ciclosporin/tacrolimus compared with the MPA group
Risk of bias
Overall, the quality of the included trials was moderate. The overall assessment of the risk of included trials is displayed in Fig. 2. Ten trials reported adequate sequence generation and for 1 trial this was unclear [13]. Nine trials had low risk of allocation concealment. Only one trial reported blinding of participants and personnel [14]. Eight trials had low risk of bias for reporting incomplete outcome data and for the remaining three trials this was unclear [16–18]. All trials were funded or partially sponsored by a pharmaceutical industry company. Withdraw rates for all studies were < 20 %. All the studies used appropriate statistical tests within their analysis.
Fig. 2.
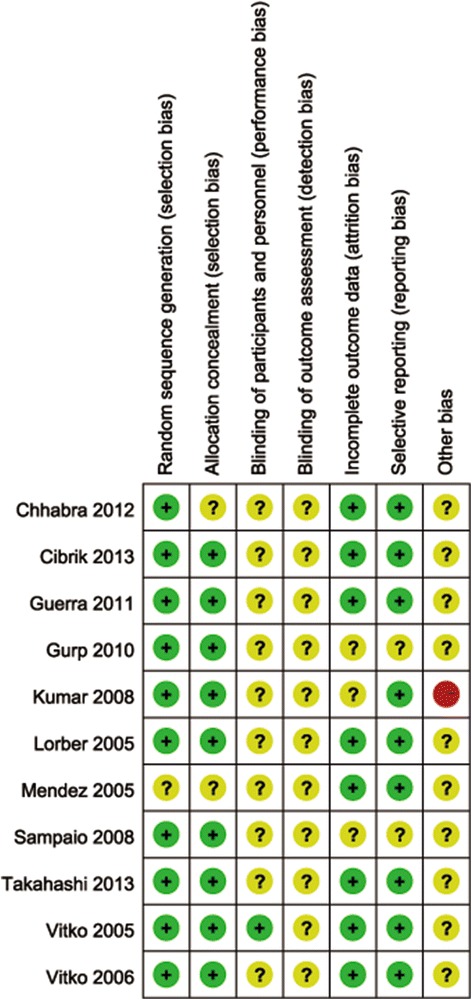
Risk of bias summary: review authors’ judgements about each risk of bias item for each included study
Biopsy-proven acute rejection (BPAR)
Eight trials reported the incidence of BPAR [12–16, 19–21], 3 trials reported both clinically defined AR and BPAR [17, 18, 22]. However, only the BPAR was included in the meta-analysis. There was no significant difference in the risk of BPAR when mTOR-I was compared with MPA at 6 months, 1 year, 2 years, and at the end of the follow-up period (6 months: 5 studies, 2710 patients, RR = 0.98, 95 % CI 0.83–1.16, P = 0.81; 1 year: 8 studies, 3210 patients, RR = 0.91, 95 % CI 0.78–1.07, P = 0.25; 2 years: 4 studies, 1977 patients, RR = 0.86, 95 % CI 0.66–1.11, P = 0.24; overall: 11 studies; 4630 patients, RR = 0.99, 95 % CI 0.83–1.19, P = 0.94; Fig. 3). Significant heterogeneity was found in the overall risk of BPAR outcome (P = 0.06, I2 = 43 %) without evidence of publication bias (P = 0.39). Subgroup analysis and meta-regression were performed to explore the sources of heterogeneity and to examine whether key trial design features modified the overall BPAR results. The results are summarized in Table 2. There was no evidence that the effects of BPAR differed among subgroups defined according to the key trial design features examined (P > 0.05 for all comparisons).
Fig. 3.
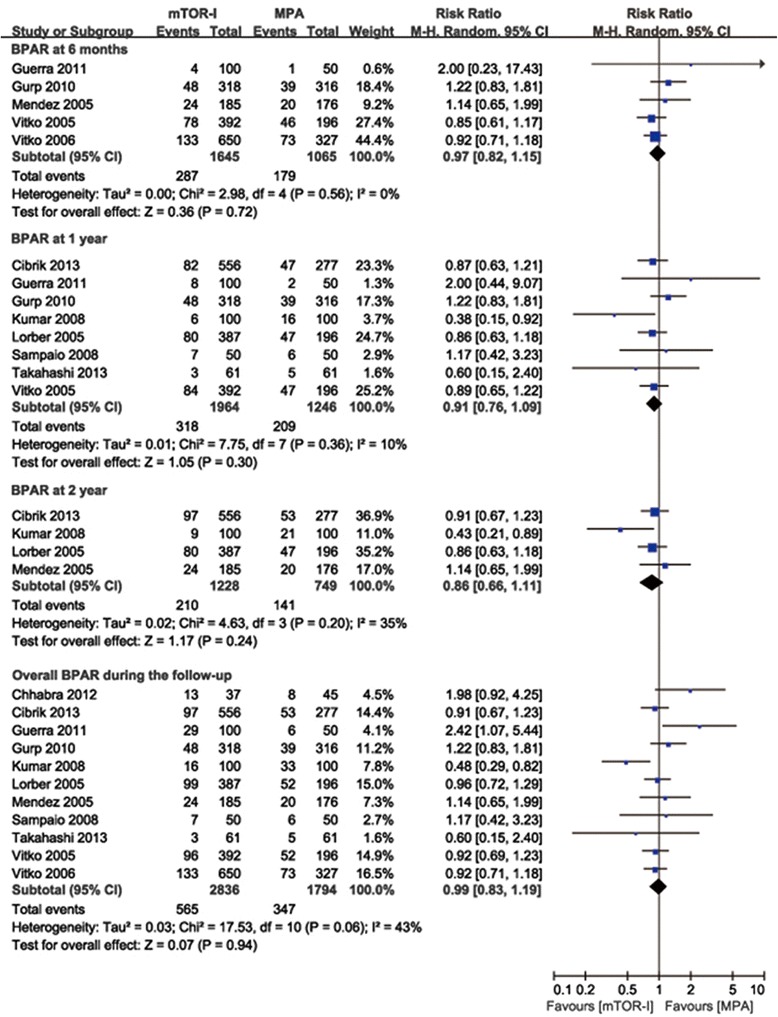
Forest plot showing the relative risk of biopsy-proven acute rejection at 6 months, 1 year, 2 years and at the end of the follow-up period
Table 2.
Meta-regression analysis of potential sources of heterogeneity for the outcome of biopsy-proven acute rejection and graft loss
| Covariate | Subgroup | BPAR | Graft loss | |||
|---|---|---|---|---|---|---|
| n. | RR (95 % CI)a | P-valueb | RR (95 % CI)a | P-valueb | ||
| Follow-up | ≥3 years | 5 | 1.04 (0.70-1.56) | P = 0.96 | 1.21 (0.99-1.48) | P = 0.84 |
| <3 years | 6 | 0.97 (0.83-1.12) | 1.17 (0.90-1.54) | |||
| Mycophenolic acid | MMF | 10 | 1.01 (0.82-1.25) | P = 0.75 | 1.18 (0.99-1.39) | P = 0.62 |
| MPS | 1 | 0.91 (0.67-1.23) | 1.36 (0.81-2.28) | |||
| mTOR-I | Sirolimus | 7 | 1.08 (0.78–1.49) | P = 0.50 | 1.14 (0.93-1.41) | P = 0.52 |
| Everolimus | 4 | 0.93 (0.78-1.10) | 1.27 (0.99-1.63) | |||
| Induction therapy | None | 5 | 0.99 (0.84-1.16) | P = 0.81 | 1.13 (0.89-1.44) | P = 0.54 |
| Antibody induction | 6 | 1.00 (0.69-1.47) | 1.25 (1.01-1.55) | |||
| Calcineurin inhibitor | Tacrolimus | 6 | 1.06 (0.81-1.37) | P = 0.12 | 1.16 (0.90-1.51) | P = 0.78 |
| Ciclosporin | 5 | 0.89 (0.76-1.05) | 1.22 (0.98-1.53) | |||
| Steroid withdrawal | Not withdrawn | 9 | 0.99 (0.87-1.12) | P = 0.43 | 1.20 (1.00-1.44) | P = 0.96 |
| Withdrawn rapidly | 2 | 0.95 (0.24-3.77) | 1.18 (0.85-1.63) | |||
| CNI dose | RD-CNI in mTOR-I group than MPA | 4 | 0.99 (0.82-1.19) | P = 0.93 | 1.27 (0.95-1.70) | P = 0.62 |
| ED-CNI in mTOR-I group and MPA | 7 | 1.09 (0.93-1.29) | 1.16 (0.96-1.40) | |||
aRR < 1 favor mTOR-I
P-valueb for meta-regression
RD-CNI reduced dose of calcineurin inhibitor; ED-CNI equal dose of Calcineurin inhibitor
Graft and patient survival
Patient survival was reported in all trials. There was no significant difference in mortality (11 studies, 4630 patients, RR = 1.17, 95 % CI 0.89–1.53, P = 0.27), with no evidence of heterogeneity (P = 0.80, I2 = 0 %) or publication bias (P = 0.97).
Overall graft loss (including death with a functioning graft) was reported in all trials. The use of a mTOR-I led to a significantly higher risk of overall graft loss (11 studies, 4630 patients, RR = 1.20, 95 % CI 1.02–1.40, P = 0.03) (Fig. 4a). No evident heterogeneity (P = 0.50, I2 = 0 %) or publication bias (P = 0.60) were observed. Death-censored graft loss was reported in 9 trials [12–14, 17–22]. Similarly, patients treated with a mTOR-I showed a significantly increased risk of death-censored graft loss (9 studies, 3453 patients, RR = 1.31, 95 % CI 1.02–1.69, P = 0.03) (Fig. 4b). The results of subgroup analysis and meta-regression for overall graft loss are shown in Table 2. No evident difference was observed on the effects of overall graft loss among any subgroups (P > 0.05 for all comparisons).
Fig. 4.
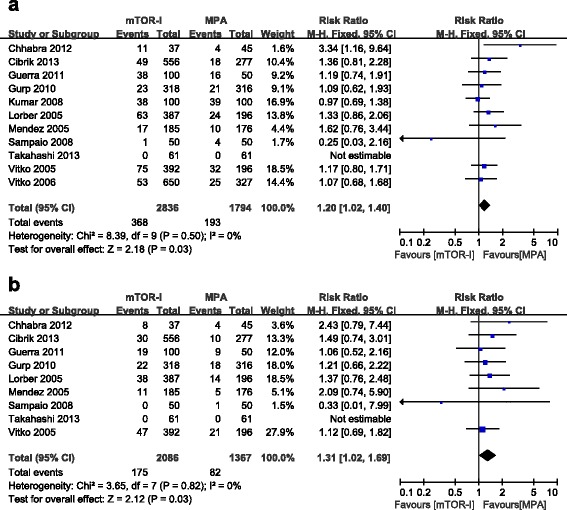
Forest plot showing the relative risk of graft loss (a) and death-censored graft loss (b)
Graft function
Serum creatinine and creatinine clearance (Cockcroft-Gault Formula) was reported in 8 trials [12–15, 17–19, 21]; however, only 6 of them had enough data for meta-analysis (the other 2 trials only described median serum creatinine and a standard deviation could not be calculated). There was no significant difference in serum creatinine between the mTOR-I and MPA groups (6 trials, 2427 patients, WMD = 7.79 μmol/L, 95 % CI −2.18–17.76, P = 0.13, I2 = 51 %). Patients treated with a mTOR-I demonstrated a lower creatinine clearance (6 trials, 2177 patients, WMD = −2.41 μmol/L, 95 % CI −4.55 to −0.26, P = 0.03, I2 = 24 %). We performed subgroup analysis for these two outcomes. Serum creatinine was significantly higher and creatinine clearance was significantly lower in the mTOR-I group when combined with equal doses of CNI, as compared with the MPA group (serum creatinine: WMD = 17.31 μmol/L, 95 % CI 7.90–26.72, P = 0.0003; creatinine clearance: WMD = −4.78 ml/min, 95 % CI, −7.61 to −1.95, P = 0.0009). However, when a mTOR-I was combined with a lower dose of CNI than the MPA group, no significant difference was observed between these two treatment groups (serum creatinine: WMD = −3.11 μmol/L, 95 % CI −11.87–5.64, P = 0.49; creatinine clearance: WMD = 0.76 ml/min, 95 % CI −2.51–4.03; P = 0.65). No heterogeneity was observed in either subgroup (I2 = 0 %) (Fig. 5a and b).
Fig. 5.
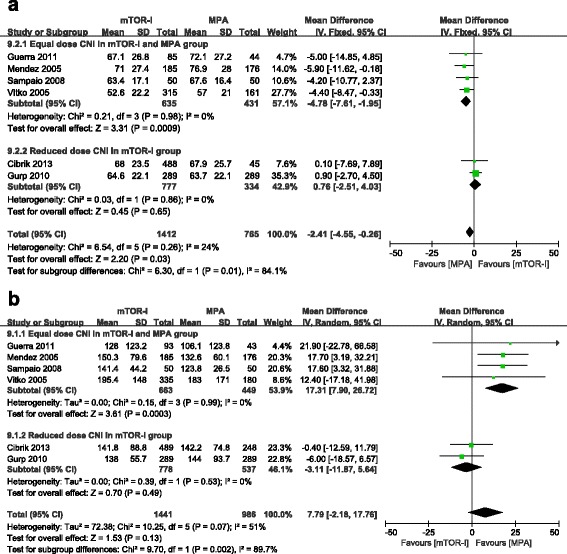
Subgroup analysis for creatinine clearance (a) and serum creatinine (b), stratified by calcineurin inhibitor dose
Glomerular filtration rate (GFR) estimated by the Modification of Diet in Renal Disease (MDRD) study equation [23] was also reported in 4 trials. Guerra et al. [19] and Chhabra et al. [20] showed a significantly lower mean GFR in the mTOR-I group compared with the MMF group throughout the entire long-term follow-up period (beyond 8 years). In contrast, Takahashi et al. [22] and Crbrik et al. [21] reported no significant difference in GFR between the two treatments with 1 and 2 years follow-up, respectively.
New-onset diabetes mellitus (NODM)
New-onset diabetes mellitus (NODM) was reported in 10 trials [13–22]. Patients treated with mTOR-I showed a significantly increased risk of NODM (10 studies, 3550 patients, RR = 1.32, 95 % CI 1.07–1.62, P = 0.008). No significant heterogeneity (I2 = 4 %) or publication bias (P = 0.15) were observed.
Vitko et al. [14] and Cibrik et al. [21] reported that patients treated with a high dose of everolimus (3 mg/d) had a significantly increased risk of NODM when compared with those treated with a low dose of everolimus (1.5 mg/d) or MPA. Similar results were also reported in a Sirolimus study (0.5 mg/d versus 2 mg/d) published by Vitko et al. in 2006 [15].
Infections
CMV infection was reported in all trials. Patients treated with mTOR-I showed a significantly reduced risk of CMV infection (11 studies, 4622 patients, RR = 0.43, 95 % CI 0.29–0.63, P < 0.0001). Heterogeneity was significant (P = 0.02, I2 = 54 %), but no publication bias was observed (P = 0.66). Subgroup analysis and meta-regression also demonstrated that the heterogeneity observed between the studies could not be explained by the type of mTOR-I and MPA used, steroid withdrawal or not, the use of antibody induction or the length of follow-up. No significant difference in the RR of CMV infection was observed for any subgroups examined (P > 0.05 for all comparisons).
Urinary tract infection (UTI) was reported in 7 trials [12, 14, 17–21]. There was no significant difference in the incidence of UTI when a mTOR-I was compared with MPA (7 studies, 2962 patients, RR = 1.00, 95 % CI 0.87–1.15, P = 0.96), with no significant heterogeneity (P = 0.32, I2 = 15 %) or publication bias (P = 0.94).
Only 2 trials [19, 21] reported the incidence of polyoma virus infection. No significant difference was observed between the two treatment groups (2 studies, 975 patients, RR = 1.05, 95 % CI 0.03–40.89, P = 0.98). Heterogeneity was significant and evident (P = 0.01, I2 = 84 %). Because of the small number of included trials, no subgroup analysis was performed to explore the source of heterogeneity.
Dyslipidemia
Serum cholesterol and triglyceride levels were also reported in 6 trials [13, 14, 17–19, 21]. Meta-analysis showed that patients treated with mTOR-I had significantly higher cholesterol and triglyceride levels (cholesterol: 6 studies, 1932 patients, WMD = 33.02 mg/dl, 95 % CI 1.11–64.93, P = 0.04; triglyceride: 6 studies, 1932 patients, WMD = 36.15 mg/d, 95 % CI 23.65–48.64, P < 0.00001). Patients treated with mTOR-I were more likely to require statin therapy (8 studies; 2950 patients; RR = 1.35; 95 % CI 1.18–1.54; P < 0.0001). Heterogeneity was evident in all three analyses (Table 3). Subgroup analysis failed to demonstrate a cause for this heterogeneity (data not shown).
Table 3.
Meta-analysis for secondary outcomes
| Outcome | Trials (n) | Patients (n) | Type | RR (95 % CI)a | P-value | Heterogeneity | |
|---|---|---|---|---|---|---|---|
| I2 % | P-value | ||||||
| New-onset diabetes mellitus | 10 | 3550 | Fixed | 1.32 (1.07-1.62) | 0.008 | 4 | 0.40 |
| Urinary tract infection | 7 | 2926 | Fixed | 1.00 (0.87-1.15) | 0.96 | 15 | 0.32 |
| CMV infection | 11 | 4622 | Random | 0.40 (0.27-0.59) | <0.0001 | 56 | 0.01 |
| Polyoma infection | 2 | 975 | Random | 1.05 (0.03-40.89) | 0.98 | 84 | 0.01 |
| Hyperlipidemia | 8 | 4233 | Random | 1.72 (1.35-2.20) | <0.0001 | 60 | 0.01 |
| Anti-lipid therapy | 8 | 2905 | Random | 1.35 (1.18-1.54) | <0.0001 | 72 | 0.0007 |
| Thrombocytopenia | 3 | 1774 | Fixed | 1.97 (1.19-3.35) | 0.008 | 37 | 0.20 |
| Leucopenia | 7 | 3594 | Random | 0.43 (0.29-0.64) | <0.0001 | 59 | 0.02 |
| Anemia | 6 | 2734 | Random | 1.21 (0.88-1.68) | 0.24 | 81 | <0.0001 |
| Proteinuria | 7 | 2861 | Fixed | 1.79 (1.38-2.31) | <0.0001 | 0 | 0.73 |
| Impaired wound healing | 6 | 2374 | Fixed | 1.55 (0.97-2.47) | 0.07 | 0 | 0.49 |
| Lymphocele | 7 | 3345 | Fixed | 1.80 (1.38-2.34) | <0.0001 | 0 | 0.71 |
| Diarrhea | 7 | 3729 | Random | 0.89 (0.64-1.25) | 0.50 | 80 | <0.0001 |
| Peripheral edema | 5 | 2752 | Random | 1.34 (1.08-1.68) | 0.009 | 56 | 0.06 |
| Malignancy | 8 | 4250 | Fixed | 0.64 (0.45-0.91) | 0.01 | 32 | 0.17 |
| Weighted mean difference | |||||||
| Serum creatinine (μmol/L) | 6 | 2427 | Random | 7.79 (−2.18 to 17.76) | 0.13 | 51 | 0.07 |
| Creatinine Clearance (mL/min)b | 6 | 2177 | Fixed | −2.41 (−4.55 to −0.26) | 0.03 | 5 | 0.38 |
| Total cholesterol (mg/dL) | 6 | 1932 | Random | 33.02 (1.11 to 64.93) | 0.04 | 98 | <0.00001 |
| Total triglyceride (mg/dL) | 6 | 1932 | Random | 36.15 (23.65 to 48.64) | <0.00001 | 45 | 0.11 |
aRR < 1 favor mTOR
bCockcroft-Gault Formula
Hematologic adverse events
Hematologic adverse events, including thrombocytopenia, leucopenia and anemia were reported in several trials. The use of a mTOR-I showed a significantly increased risk of thrombocytopenia (3 studies, 1774 patients, RR = 1.97, 95 % CI 1.19–3.35, P = 0.008, I2 = 37 %) [13, 14, 21] and a significantly reduced risk of leucopenia (7 studies, 3954 patients, RR = 0.43, 95 % CI 0.29–0.64, P < 0.0001, I2 = 59 %) [13–15, 18, 20–22]. However, no significant difference in the risk of anemia was observed (6 studies, 2734 patients, RR = 1.21, 95 % CI 0.88–1.68, P = 0.21, I2 = 81 %) [12, 14, 18, 20–22]. The heterogeneity could not be explained by subgroup analysis.
Proteinuria
Proteinuria was reported in 7 trials [12, 15–17, 20–22]. Patients treated with a mTOR-I showed a significantly increased risk of proteinuria (7 studies, 2861 patients, RR = 1.79, 95 % CI 1.38–2.31, P < 0.0001), with no evident heterogeneity (P = 0.73, I2 = 0 %).
Wound related complications
Impaired wound healing (including wound infection and dehiscence) was reported in 6 trials [15–17, 19, 21, 22]. No significant difference was observed when mTOR-I were compared with MPA (6 studies, 2374 patients, RR = 1.55, 95 % CI 0.97–2.47, P = 0.07), although patients treated with a mTOR-I had a significantly increased risk of lymphocoele (7 studies, 3345 patients, RR = 1.80, 95 % CI 1.38–2.34, P < 0.0001) [12, 14, 15, 17, 19, 21, 22]. Both of these meta-analyses showed low heterogeneity (I2 = 0 %).
Malignancy
Eight trials reported the incidence of malignancy after transplantation [12–16, 18, 20, 21]. The pooled incidence of malignancy was 2.4 % (62 of 2621) in the mTOR-I group and 3.6 % (58 of 1629) in the MPA group. Patients treated with mTOR-I showed a significantly reduced risk of post-transplantation malignancy (8 studies, 4250 patients, RR = 0.64, 95 % CI 0.45–0.91, P = 0.01), heterogeneity was not significant (P = 0.17; I2 = 32 %). Among the 8 trials, 4 trials [12, 15, 16, 18] reported the incidence of post-transplantation lymphoproliferative disease (PTLD). There was no significant difference in the risk of PTLD between the two treatment groups (4 studies, 2394 patients, RR = 0.78, 95 % CI 0.27–2.28, P = 0.65), with no significant heterogeneity (P = 0.22, I2 = 32 %).
Other adverse events
Diarrhea was reported in 7 trials [12, 15, 16, 18]. No significant difference was observed (7 studies, 3729 patients, RR = 0.89, 95 % CI 0.64–1.25, P = 0.50), although heterogeneity was evident (P < 0.0001, I2 = 80 %). Even if we excluded the trial which used EC-MPS [21], no evident change in the RR (RR = 0.89, 95 % CI 0.58–1.36) was observed and the heterogeneity was still present (I2 = 83 %).
Five trials [12, 13, 16, 19, 22] reported the incidence of peripheral edema. Patients treated with mTOR-I showed a significantly higher incidence of peripheral edema (5 studies, 2752 patients, RR = 1.34, 95 % CI 1.08–1.68, P = 0.009). Heterogeneity was evident, but not significant (P = 0.06, I2 = 56 %).
Discussion
In this meta-analysis, we have combined data from eleven eligible randomized controlled trials involving 4930 patients and examined the efficacy and safety of mTOR-I versus MPA when combined with CNI. Our methodology was robust by searching all possible studies, including non-English language sources, even in the abstract form, and strictly assessing the quality of included trials and by thoroughly investigating sources of potential heterogeneity. Consequently, reliable conclusions can be drawn from the data.
Our meta-analysis demonstrates that the use of mTOR-I or MPA as the primary immunosuppression regimen combined with CNI has no significant effect on the risk of BPAR and patient deaths. However, patients treated with a mTOR-I have an increased risk of graft loss (by 20 %). Creatinine clearance was also reduced by approximately 2.5 ml/min in mTOR-I-treated patients. Subgroup analysis demonstrated that serum creatinine was increased by approximately 17 μmol/L and creatinine clearance was reduced by approximately 5 ml/min in the mTOR-I group when combined with equal doses of CNI as the MPA group, but no significant difference was observed when mTOR-I were combined with a lower dose of CNI than the MPA group. A previous meta-analysis [10] failed to demonstrate a significant difference in the risk of graft loss in kidney transplantation when mTOR-I were compared with antimetabolites (MMF and AZA) (Additional File 1). Furthermore, the data was limited to 2 year after transplantation. We have recognized that the combination of mTOR-I and CNI provide immunological synergy, but that the limitation of this combination in clinical practice is the enhanced nephrotoxicity of CNI. Therefore, the current strategy in clinical practice is to minimize CNI dosage when using a mTOR-I [9]. However, in our subgroup analysis, even when a mTOR-I combined with reduced dose CNI was compared to MPA, no advantage was observed. Notably, there was a relatively higher risk of graft loss (RR = 1.27, P = 0.06, Table 2). Some researchers demonstrated that long-term graft survival may be influenced by CNI minimization strategies, although this may increase the incidence of de novo donor-specific antibody and antibody-mediated rejection [24, 25]. However, we could not deduce the reason why the graft loss rate is significantly higher in the mTOR-I group.
For secondary outcomes, mTOR-I-treated patients showed an increased risk of NODM (RR = 1.32), especially in the high dose mTOR-I group. This is in agreement with the data from the US renal data system showing that the risk of NODM was significantly higher in all drug combinations that included mTOR-I compared with other therapeutic regimes without this drug [26]. Hyperlipidemia and proteinuria (RR = 1.79) were also more common in mTOR-I-treated patients. Higher cholesterol and triglyceride levels of approximately 33.02 mg/dl and 36.15 mg/dl, respectively, were observed in mTOR-I-treated patients. Evidence from several studies and reviews have demonstrated that dyslipidemia is more common in patients receiving mTOR-I-based regimens, with increased levels of cholesterol and triglycerides, and an increased use of lipid-lowering agents [27–29]. NODM and hyperlipidemia are well recognized risk factors for post-transplant cardiovascular events, all-cause mortality, and graft loss over a period of years after transplantation [27, 30–32]. Most trials included in our analysis did not report the incidence of cardiovascular events, so we are unable to report on this outcome.
Our study also showed that mTOR-I significantly reduced the risk of CMV infections (RR = 0.43), and malignancy (RR = 0.64) compared with MPA. A previous meta-analysis [10] failed to show a difference in the incidence of malignancy between two treatment groups because of the short-term follow-up. Another meta-analysis [33] reported that the CMV incidence under mTOR-I + CNI treatment ranged from 0 % to 10 %, which was significantly lower than with mTOR-I free immunosuppression. Post-transplant malignancy has emerged as a leading cause of morbidity and mortality, especially in patients who have a high or long-term exposure to immunosuppression [34]. There is already both theoretical and experimental evidence in the literature explaining why a mTOR-I might protect against the development of malignancy [35, 36].
When mTOR-I was compared with MPA, the risk of lymphocoele was increased by 76 %, despite a similar risk of impaired healing. A previous review has reported similar results, in that wound healing complications were observed more frequently after mTOR-I became available, particularly in direct comparison with MMF [37]. In our meta-analysis, patients treated with mTOR-I showed a reduced risk of leucopenia (RR = 0.43), but an increased risk of thrombocytopenia (RR = 1.97). Other outcomes, such as diarrhea and anemia, were similar when mTOR-I were compared with MPA.
Our analysis has several limitations. Firstly, the quality of included trials and the lengths of follow-up are variable among trials. Secondly, although the primary outcomes such as BPAR, graft and patient survival were well reported in most trials, many of the adverse outcomes were not reported. The definitions of reported outcomes were often variable case by case or not clearly specified. For example, some trials reported the creatinine clearance (Cockcroft-Gault Formula) to represent graft function, while others reported the calculated GFR (MDRD). Some trials reported the incidence of hypertriglyceridemia and hypercholesterolemia (with variable definitions) or use of lipid-lowering drugs, while some reported the serum levels of triglyceride and cholesterol. As outlined in Table 1, immunosuppression regimens and dose/target level varied among these trials. For example, some trials used a fixed-dose of mTOR-I and MPA, but some used a control-dose based on therapeutic drug monitoring. The use of steroid and the target level of CNI also varied between trials. Thirdly, we have excluded a trial in which 3.2 % of patients received more than one organ transplant (i.e., not kidney alone, so not matching our inclusion criteria) [38]. In this study, Suszynski et al. compared two different doses of sirolimus with MMF with a 10 year follow-up. Although no significant changes in almost all results would have been observed if we included the data from this study in our current meta-analysis (data not shown), we admit that the summary (RR) effects outlined in this article may not represent the true effects of mTOR-I and MPA. Finally, most of the transplant recipients in the trials included in our meta-analysis are older than 18 years of age; therefore, our findings cannot be applied to pediatric patients.
Conclusions
In summary, according to our meta-analysis, mTOR-I showed no particular superiority compared with MPA, but in fact had an increased risk of graft loss when combined with CNI. Therefore, we suggest that mTOR-I must be used cautiously in de novo kidney recipients in combination with CNI, and that the optimal dose strategies of mTOR-I and CNI need to be further investigated.
Acknowledgments
The authors would like to thank Duo Lv for statistic support in this systematic review.
Abbreviations
- AZA
Azathioprine
- BPAR
Biopsy-Proven Acute Rejection
- CMV
Cytomegalovirus
- CNI
Calcineurin inhibitor
- CsA
Cyclosporine
- EC-MPS
Enteric-coated mycophenolate sodium
- MPA
Mycophenolic acid
- mTOR-I
mammalian target of rapamycin inhibitor
- MMF
Mycophenolate mofetil
- NODM
New-onset diabetes mellitus
- PTLD
Post-transplantation lymphoproliferative disease
- RR
Relative risk
- UTI
Urinary tract infection
- WMD
Weighted mean difference
Additional file
Included trials and reports. Figure S1. Egger’s test for biopsy-proven acute rejection. Figure S2. Egger’s test for graft loss. Figure S3. Egger’s test for new-onset diabetes mellitus. Figure S4. Egger’s test for CMV infection. Supplemental Table. Different results between our meta-analysis and the previous study.
Footnotes
Competing Interests
The authors declare that they have no competing interests.
Authors’ contribution
X.X. planned the study, searched the literature, assessed studies, extracted data, analyzed data and prepared the article. Y.J. searched the literature, assessed studies, extracted data, analyzed data and assisted in article preparation. X.L. and S.X. assisted in the data analysis. Z.S. planned the study, analyzed data and assisted in article preparation. J.C. assisted in article review. All authors read and approved the final manuscript.
Contributor Information
Xishao Xie, Email: xiexishao@126.com.
Yan Jiang, Email: amandakimi@zju.edu.cn.
Xiuxiu Lai, Email: lxx1989lxx@163.com.
Shilong Xiang, Email: xiaoxiangno2@sina.com.
Zhangfei Shou, Email: zfshou@zju.edu.cn.
Jianghua Chen, Email: chenjhzju@sina.com.
References
- 1.Marcen R. Immunosuppressive drugs in kidney transplantation: impact on patient survival, and incidence of cardiovascular disease, malignancy and infection. Drugs. 2009;69:2227–2243. doi: 10.2165/11319260-000000000-00000. [DOI] [PubMed] [Google Scholar]
- 2.Hardinger KL, Brennan D. Novel immunosuppressive agents in kidney transplantation. World J Transplant. 2013;3:68. doi: 10.5500/wjt.v3.i4.68. [DOI] [PMC free article] [PubMed] [Google Scholar]
- 3.Knight SR, Russell NK, Barcena L, et al. Mycophenolate Mofetil decreases acute rejection and may improve graft survival in renal transplant recipients when compared with Azathioprine: a systematic review. Transplantation. 2009;87:785–794. doi: 10.1097/TP.0b013e3181952623. [DOI] [PubMed] [Google Scholar]
- 4.Maripuri S, Kasiske BL. The role of mycophenolate mofetil in kidney transplantation revisited. Transplant Rev (Orlando) 2014;28:26–31. doi: 10.1016/j.trre.2013.10.005. [DOI] [PubMed] [Google Scholar]
- 5.Budde K, Curtis J, Knoll G, et al. Enteric-coated mycophenolate sodium can be safely administered in maintenance renal transplant patients: Results of a 1-year study. Am J Transplant. 2004;4:237–243. doi: 10.1046/j.1600-6143.2003.00321.x. [DOI] [PubMed] [Google Scholar]
- 6.Salvadori M, Holzer H, de Mattos A, et al. Enteric-coated mycophenolate sodium is therapeutically equivalent to mycophenolate mofetil in de novo renal transplant patients. Am J Transplant. 2004;4:231–236. doi: 10.1046/j.1600-6143.2003.00337.x. [DOI] [PubMed] [Google Scholar]
- 7.Cooper M, Salvadori M, Budde K, et al. Enteric-coated mycophenolate sodium immunosuppression in renal transplant patients: efficacy and dosing. Transplant Rev (Orlando) 2012;26:233–240. doi: 10.1016/j.trre.2012.02.001. [DOI] [PubMed] [Google Scholar]
- 8.Rostaing L, Kamar N. mTOR inhibitor/proliferation signal inhibitors: entering or leaving the field? J Nephrol. 2010;23:133–142. [PubMed] [Google Scholar]
- 9.Russ GR. Optimising the use of mTOR inhibitors in renal transplantation. Transplant Res. 2013;2:S4. doi: 10.1186/2047-1440-2-S1-S4. [DOI] [PMC free article] [PubMed] [Google Scholar]
- 10.Webster AC, Lee VW, Chapman JR, et al. Target of rapamycin inhibitors (sirolimus and everolimus) for primary immunosuppression of kidney transplant recipients: a systematic review and meta-analysis of randomized trials. Transplantation. 2006;81:1234–1248. doi: 10.1097/01.tp.0000219703.39149.85. [DOI] [PubMed] [Google Scholar]
- 11.Higgins JPT, Green S. Cochrane handbook for systematic review of interventions. Cochrane Collaboration. Available at: http://www.handbook.cochrane.org/. Accessed December 26, 2012.
- 12.Lorber MI, Mulgaonkar S, Butt KMH, et al. Everolimus versus mycophenolate mofetil in the prevention of rejection in de Novo renal transplant recipients: A 3-year randomized, multicenter, phase III study. Transplantation. 2005;80:244–252. doi: 10.1097/01.TP.0000164352.65613.24. [DOI] [PubMed] [Google Scholar]
- 13.Mendez R, Gonwa T, Yang HC, et al. A prospective, randomized trial of tacrolimus in combination with sirolimus or mycophenolate mofetil in kidney transplantation: Results at 1 year. Transplantation. 2005;80:303–309. doi: 10.1097/01.tp.0000167757.63922.42. [DOI] [PubMed] [Google Scholar]
- 14.Vitko S, Margreiter R, Weimar W, et al. Three-year efficacy and safety results from a study of everolimus versus mycophenolate mofetil in de novo renal transplant patients. Am J Transplant. 2005;5:2521–2530. doi: 10.1111/j.1600-6143.2005.01063.x. [DOI] [PubMed] [Google Scholar]
- 15.Vitko S, Wlodarczyk Z, Kyllonen L, et al. Tacrolimus combined with two different dosages of sirolimus in kidney transplantation: Results of a multicenter study. Am J Transplant. 2006;6:531–538. doi: 10.1111/j.1600-6143.2005.01193.x. [DOI] [PubMed] [Google Scholar]
- 16.Kumar MSA, Saeed MI, Ranganna K, et al. Comparison of four different immunosuppression protocols without long-term steroid therapy in kidney recipients monitored by surveillance biopsy: Five-year outcomes. Transplant Immunol. 2008;20:32–42. doi: 10.1016/j.trim.2008.08.005. [DOI] [PubMed] [Google Scholar]
- 17.Sampaio EL, Pinheiro-Machado PG, Garcia R, et al. Mycophenolate mofetil vs. sirolimus in kidney transplant recipients receiving tacrolimus-based immunosuppressive regimen. Clin Transplant. 2008;22:141–149. doi: 10.1111/j.1399-0012.2007.00756.x. [DOI] [PubMed] [Google Scholar]
- 18.Van Gurp E, Bustamante J, Franco A, et al. Comparable Renal Function at 6 Months with Tacrolimus combined with fixed-dose Sirolimus or MMF: results of a randomized multicenter trial in renal transplantation. J Transplant 2010; 2010:731426. [DOI] [PMC free article] [PubMed]
- 19.Guerra G, Ciancio G, Gaynor JJ, et al. Randomized trial of immunosuppressive regimens in renal transplantation. J Am Soc Nephrol. 2011;22:1758–1768. doi: 10.1681/ASN.2011010006. [DOI] [PMC free article] [PubMed] [Google Scholar]
- 20.Chhabra D, Skaro AI, Leventhal JR, et al. Long-term kidney allograft function and survival in prednisone-free regimens: tacrolimus/mycophenolate mofetil versus tacrolimus/sirolimus. Clin J Am Soc Nephrol. 2012;7:504–512. doi: 10.2215/CJN.06940711. [DOI] [PMC free article] [PubMed] [Google Scholar]
- 21.Cibrik D, Silva HT, Vathsala A, et al. Randomized trial of Everolimus-facilitated Calcineurin inhibitor minimization over 24 months in renal transplantation. Transplantation. 2013;95:933–942. doi: 10.1097/TP.0b013e3182848e03. [DOI] [PubMed] [Google Scholar]
- 22.Takahashi K, Uchida K, Yoshimura N, et al. Efficacy and safety of concentration-controlled everolimus with reduced-dose cyclosporine in Japanese de novo renal transplant patients: 12-month results. Transplant Res. 2013;2:14. doi: 10.1186/2047-1440-2-14. [DOI] [PMC free article] [PubMed] [Google Scholar]
- 23.Levey AS, Bosch JP, Lewis JB, et al. A more accurate method to estimate glomerular filtration rate from serum creatinine: a new prediction equation. Modification of Diet in Renal Disease Study Group. Ann Intern Med. 1999;130:461–470. doi: 10.7326/0003-4819-130-6-199903160-00002. [DOI] [PubMed] [Google Scholar]
- 24.Sellares J, de Freitas DG, Mengel M, et al. Understanding the causes of kidney transplant failure: the dominant role of antibody-mediated rejection and nonadherence. Am J Transplant. 2012;12:388–399. doi: 10.1111/j.1600-6143.2011.03840.x. [DOI] [PubMed] [Google Scholar]
- 25.Djamali A, Kaufman DB, Ellis TM, et al. Diagnosis and management of antibody-mediated rejection: current status and novel approaches. Am J Transplant. 2014;14:255–277. doi: 10.1111/ajt.12589. [DOI] [PMC free article] [PubMed] [Google Scholar]
- 26.Johnston O, Rose CL, Webster AC, Gill JS. Sirolimus is associated with new-onset diabetes in kidney transplant recipients. J Am Soc of Nephrol. 2008;19:1411–1418. doi: 10.1681/ASN.2007111202. [DOI] [PMC free article] [PubMed] [Google Scholar]
- 27.Kasiske B, Cosio FG, Beto J, et al. Clinical practice guidelines for managing dyslipidemias in kidney transplant patients: a report from the Managing Dyslipidemias in Chronic Kidney Disease Work Group of the National Kidney Foundation Kidney Disease Outcomes Quality Initiative. Am J Transplant. 2008;4(Suppl 7):13–53. doi: 10.1111/j.1600-6135.2004.0355.x. [DOI] [PubMed] [Google Scholar]
- 28.Busaidy NL, Farooki A, Dowlati A, et al. Management of metabolic effects associated with anticancer agents targeting the PI3K-Akt-mTOR pathway. J Clin Oncol. 2012;30:2919–2928. doi: 10.1200/JCO.2011.39.7356. [DOI] [PMC free article] [PubMed] [Google Scholar]
- 29.Kaplan B, Qazi Y, Wellen JR. Strategies for the management of adverse events associated with mTOR inhibitors. Transplant Rev (Orlando) 2014;28:126–133. doi: 10.1016/j.trre.2014.03.002. [DOI] [PubMed] [Google Scholar]
- 30.Kasiske BL, de Mattos A, Flechner SM, et al. Mammalian target of rapamycin inhibitor dyslipidemia in kidney transplant recipients. Am J Transplant. 2008;8:1384–1392. doi: 10.1111/j.1600-6143.2008.02272.x. [DOI] [PubMed] [Google Scholar]
- 31.Cosio FG, Hickson LJ, Griffin MD, et al. Patient survival and cardiovascular risk after kidney transplantation: the challenge of diabetes. Am J Transplant. 2008;8:593–599. doi: 10.1111/j.1600-6143.2007.02101.x. [DOI] [PubMed] [Google Scholar]
- 32.Legendre C, Anglicheau D. Transplantation: Proteinuria in kidney transplantation: an ongoing story. Nat Rev Nephrol. 2013;9:251–252. doi: 10.1038/nrneph.2013.61. [DOI] [PubMed] [Google Scholar]
- 33.Andrassy J, Hoffmann VS, Rentsch M, et al. Is cytomegalovirus prophylaxis dispensable in patients receiving an mTOR inhibitor-based immunosuppression? a systematic review and meta-analysis. Transplantation. 2012;94:1208–1217. doi: 10.1097/TP.0b013e3182708e56. [DOI] [PubMed] [Google Scholar]
- 34.Campistol JM. Minimizing the risk of posttransplant malignancy. Transplantation. 2009;87:S19–S22. doi: 10.1097/TP.0b013e3181a07a57. [DOI] [PubMed] [Google Scholar]
- 35.Kauffman HM, Cherikh WS, Cheng Y, et al. Maintenance immunosuppression with target-of-rapamycin inhibitors is associated with a reduced incidence of de novo malignancies. Transplantation. 2005;80:883–889. doi: 10.1097/01.TP.0000184006.43152.8D. [DOI] [PubMed] [Google Scholar]
- 36.Geissler EK. The influence of mTOR inhibitors on immunity and the relationship to post-transplant malignancy. Transplant Res. 2013;2:S2. doi: 10.1186/2047-1440-2-S1-S2. [DOI] [PMC free article] [PubMed] [Google Scholar]
- 37.Nashan B, Citterio F. Wound healing complications and the use of mammalian target of rapamycin inhibitors in kidney transplantation: a critical review of the literature. Transplantation. 2012;94:547–561. doi: 10.1097/TP.0b013e3182551021. [DOI] [PubMed] [Google Scholar]
- 38.Suszynski TM, Gillingham KJ, Rizzari MD, et al. Prospective randomized trial of maintenance immunosuppression with rapid discontinuation of prednisone in adult kidney transplantation. Am J Transplant. 2013;13:961–970. doi: 10.1111/ajt.12166. [DOI] [PMC free article] [PubMed] [Google Scholar]