Innate lymphoid cells (ILCs), defined as lineage negative (Lin−) CD127+ cells, have emerged as novel important immune effector cells, playing a critical role also in tumor immunosurveillance.1–5 Recently, it was shown that the number of ILCs in acute myeloid leukemia (AML) patients is significantly reduced after chemotherapy/radiotherapy as compared to healthy donors.6 However, so far, no data on ILC frequency, subset distribution and function in AML treatment naïve patients are available. Therefore, we analyzed the frequency, subset distribution and function of ILCs in AML patients before any treatment, a parameter that is of paramount importance to understand the role of ILCs during leukemogenesis and to assess the impact of current treatments on these cells.
ILCs are a novel family of lineage negative CD127+ innate immune cells belonging to the lymphoid lineage, yet not expressing rearranged antigen specific receptors. Instead, they are activated and regulated mainly by cytokine mediated signals. To date, three distinct subsets of ILCs have been described, based on their transcriptional regulation and cytokine profiles that mirror those of T-helper subsets: ILC1, expressing T-bet and producing IFN-γ and TNF-α, ILC2, expressing GATA-3 and secreting IL-4, -5, -13 and ILC3, expressing Rorγt and secreting IL-17A and/or IL-22.7,8 Although a population of ILCs CD127dim/− has recently been described,9 here we focused on circulating ILC populations that are CD127+ in peripheral blood (PB). We identified ILCs within the PB lymphocyte region by multicolor flow cytometry, on the basis of their forward (FSC) and side scatter (SSC) profiles (FSC low and SSC low) and by excluding from the analysis doublets (FSC H/FSC W dot plot, followed by SSC A/SSC W dot plot) and dead cells [positive for ViViD LIVE/DEAD fixable dead cell stain kit (LifeTechnologies)]. Total ILCs were gated as Lin−CD127+ cells. Subsequently, ILC1 were identified as CRTH2−cKit−CD56− cells, ILC2 as CRTH2+cKit+/− cells, ILC3 NCR+ as CRTH2−cKit+NKp46+ cells and ILC3 NCR− as CRTH2−cKit+NKp46− cells, as described by Spits et al.7 A minimum of 106 MNCs was acquired on a Gallios flow cytometer (Beckman Coulter). Data were analyzed using FlowJo™ software (TreeStar). Statistical analysis was performed using t-tests or ANOVAs.
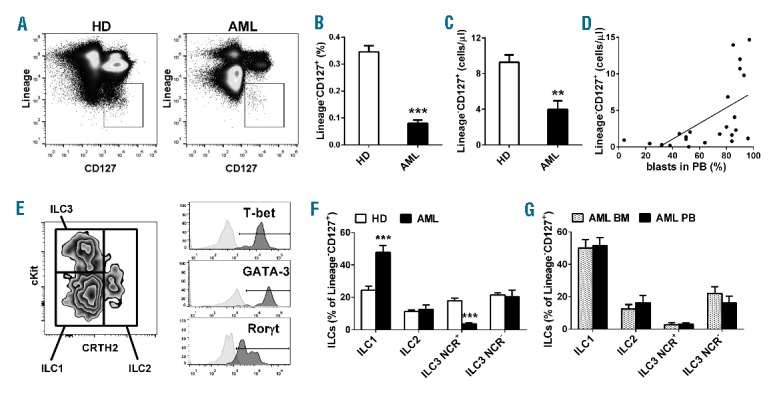
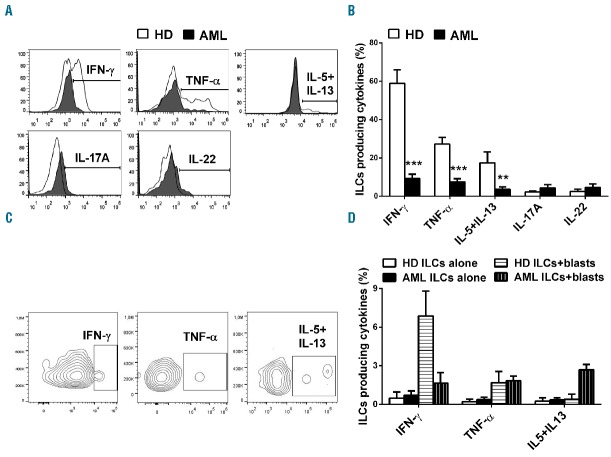
We compared the frequency of total ILCs in PB samples from 38 age- and sex-matched healthy subjects and 38 newly diagnosed AML patients [(median age 61, range 21–79; sex ratio (M:F) 21:17; primary AML 38 of 38 (100%); hyperleukocytosis 21 of 38 (55.3%); cytogenetic risk group: low 6 of 38 (15.8%), intermediate 22 of 38 (57.9%), high 10 of 38 (26.3%)]. All patients provided written informed consent (EMATC-2013-01 or approval by the local ethical committee of the Canton of Bern, Switzerland), and the research was conducted in accordance with the Declaration of Helsinki. Remarkably, we measured a highly significant reduction of circulating ILCs in patients at disease onset compared to controls both in percentage and absolute number (Figure 1A–C). Moreover, we found a positive correlation between the number of circulating ILCs and the percentage of circulating leukemic blasts (R2=0.3477, P=0.0031) (Figure 1D). Then, we analyzed the relative frequency of the different ILC subsets, characterized by the combination of surface marker expression detailed above and of specific transcription factors: T-bet for ILC1, GATA-3 for ILC2 and Rorγt for ILC3 (Figure 1E). Strikingly, we found a significant enrichment of ILC1 in AML patients and a concomitant profound reduction of ILC3 NCR+ cells. No differences were detectable in the levels of ILC2 and ILC3 NCR− cells (Figure 1F). No difference was observed either in the frequency of total circulating ILCs and in the distribution of the ILC subsets among the three cytogenetic risk groups (data not shown). In addition, since AML is a malignancy originating in the bone marrow (BM), we compared the frequencies of ILCs between paired BM and PB samples from 17 patients. We did not find any difference either in percentage of total ILCs (data not shown), or in the relative proportions of the different ILC subsets (Figure 1G), suggesting a similar composition of ILCs in BM and PB in AML patients at disease onset. To test the functionality of ILCs in terms of their capacity to produce type 1 (IFN-γ and TNF-α), type 2 (IL-5 plus IL-13) and type 3 (IL-17A and IL-22) cytokines, we stimulated MNCs with 1 μg/mL PMA plus 0.5 μg/mL Ionomycin, in the presence of BrefeldinA (Sigma-Aldrich), for 3 h and stained them for intracellular cytokine production. Following this direct ex vivo short-term activation, ILCs of AML patients were dramatically impaired in their production of IFN-γ, TNF-α as well as type 2 cytokines (e.g. IL-5/IL-13) as compared to ILCs of healthy subjects, while we found no difference in type 3 cytokines (e.g. IL-17A and IL-22) (Figure 2A and B). Moreover, in order to assess the role the ILCs might have in vivo, we used fresh PB of 4 newly diagnosed AML patients and, by adapting a method recently described,11 we isolated AML blasts from MNCs using a monoclonal antibody cocktail against CD14 and CD33 (Miltenyi). Then, we depleted the CD14−CD33− MNCs’ flow through fraction from CD4+ and CD8+ cells so as to obtain MNCs that are both depleted of leukemic cells, and enriched in ILCs. It was seen that ILC-enriched MNCs, of both healthy donors and leukemic patients, incubated with target cells (i.e. blasts) are able to produce cytokines in response to respectively allogeneic or autologous blasts (Figure 2C and D).
Figure 1.

Innate lymphoid cells frequency and subtypes in AML patients at diagnosis. Total circulating ILCs were identified as Lineage [(FITC-conjugated anti-CD3, anti-CD4, anti-CD14, anti-CD16, anti-CD19 (Beckman Coulter), anti-CD8, anti-CD15 (AbD Serotech), anti-CD20, anti-CD33, anti-CD34, anti-CD203c and anti-FceRI (BioLegend)] negative CD127+ (PerCP-Cy5.5- or Brilliant Violet 421-conjugated anti-CD127 (BioLegend)] lymphocytes. Since a non-negligible proportion of ILC3 can express CD56,10 we excluded this marker from the lineage cocktail. (A) Representative example of the gating strategy to determine, by multiparameter flow cytometry, in healthy donors (HD) and AML patients, the percentage (B) and the absolute number (C) of total circulating ILCs. Histograms represent the mean ± SEM of total Lin−CD127+ ILCs in PB of healthy subjects and AML patients. (D) Correlation between the number of circulating ILCs and the percentage of circulating blasts. (E) Representative example of the gating strategy to determine ILC1, ILC2 and ILC3 according to CRTH2 versus cKit expression and subsequent evaluation of T-bet expression (PE CF594-conjugated) in ILC1, GATA-3 (PE-Cy7-conjugated) in ILC2 and Rorγt (PE-conjugated) in ILC3 (all from BD Pharmingen) of one representative healthy donor. In clear gray the histogram of the isotype control. ILC subsets were identified as previously described,7 by using PE CF594- or Brilliant Violet 421-conjugated anti-CRTH2 (BD Pharmingen); PerCP-Cy5.5- or PE-Cy7-conjugated anti-NKp46; PE− or APC-conjugated anti-cKit; APC-eFluor780-conjugated anti-CD56 (eBioscience). (F and G) Histograms represent the mean ± SEM of the percentage of ILC subsets within total Lin−CD127+ ILCs of healthy donors and AML patients at diagnosis (F), or of BM and PB of AML paired samples at diagnosis (G), setting total ILCs as the 100%. **P<0.01; ***P<0.001.
Figure 2.
Cytokine production by ILCs in AML patients at diagnosis. (A and B) MNCs were stimulated ex vivo for 3 h, then the intracellular staining was performed using PE-conjugated anti-IL-17A, PerCP-conjugated anti-IL-22, PE-Cy7-conjugated anti-IFN-γ, APC-conjugated anti-IL-5 and IL-13, Alexa700-conjugated anti-TNF-α (BD Pharmingen). (A) Representative result of the intracellular staining by gating on total ILCs (Lin−CD127+ cells). (B) Histograms represent the mean ± SEM of the percentage of ILCs (Lin−CD127+ cells) in healthy subjects and AML patients (n=15), producing IFN-γ, TNF-α, IL-5 plus IL-13, IL-17A and IL-22. ** and *** represent significant comparisons with P<0.01 and <0.001, respectively. (C and D) MNCs enriched in ILCs (i.e. MNCs depleted from CD14+/CD33+/CD8+/CD4+ cells) were incubated with target cells (i.e. allogeneic/autologous blasts) overnight at 37°C, in medium without cytokines, at an optimized effector:target ratio of 1:10. The ratio was calculated based on the percentage of flow-cytometry determined frequency of ILCs in CD14−CD33−CD8−CD4− MNCs. As negative control, CD14−CD33−CD8−CD4− MNCs were incubated without targets. BrefeldinA was added to the cultures at incubation onset. After 16 h cells were washed and stained. (C) Representative result of the intracellular staining by gating on total ILCs (Lin−CD127+ cells) obtained from one leukemic patient. (D) Histograms represent the mean ± SEM of the percentage of ILCs (Lin−CD127+ cells), in healthy subjects and AML patients (n=4), producing IFN-γ, TNF-α and IL-5 plus IL-13. **P<0.01; ***P<0.001.
Even if we cannot exclude the involvement of alloreactivity in the recognition of leukemic blasts by ILCs from healthy donors, our data suggest that ILCs from AML patients could be impaired in the production of IFN-γ or type 2 cytokines in comparison to ILCs from healthy donors. Of note, the capacity of ILCs from AML patients to produce TNF-α in response to autologous blasts suggest that ILCs might be able to control, through the TNF-α/TNF-R1 pathway, the leukemic cell growth/survival.12
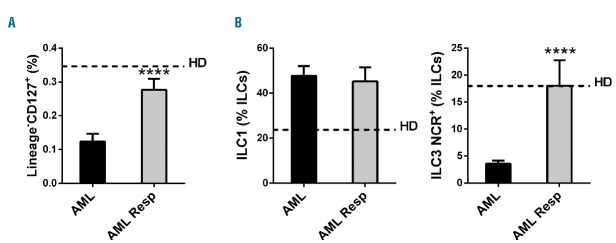
Finally, we compared the percentage of total circulating ILCs in AML patients (n=9) responding to standard chemotherapy (2 cycles of daunorubicin/cytarabine) with that of patients at diagnosis and of healthy donors [F (2, 82)=56.26; P<0.0001]. The percentage of total ILCs is completely recovered in responding patients (Figure 3A). In addition, we asked if also ILC1 and ILC3 NCR+ cells, the subsets dysregulated at diagnosis, were recovered in responding patients. While ILC1 were still increased in comparison to healthy donors, ILC3 NCR+ cells were restored to normal levels [(F (2, 82) = 28.28; P<0.0001) (Figure 3B)].
Figure 3.

ILC frequency in AML patients responding to chemotherapy. Histograms represent the mean ± SEM of the percentage of (A) total Lin−CD127+ ILCs and (B) ILC1 and ILC3 NCR+ in AML patients at diagnosis and in AML patients responding to therapy (AML Resp). Dashed lines represent the mean value observed in control healthy donors. **** represent significant comparisons with P<0.0001 (Tukey corrected for multiple comparisons). **P<0.01; ***P<0.001.
Overall, we show here for the first time that ILCs are significantly dysregulated at diagnosis in terms of: i) frequency; ii) subtype composition; and iii) function in treatment naïve AML patients. Moreover, we show here that ILCs are partially recovered in patients responsive to therapy, suggesting that ILC dysregulation is associated with the disease itself and is not just a consequence of chemotherapy. It is noteworthy that, in AML patients, the circulating ILC pool accurately reflects the ILC dysregulation occurring in their paired bone marrow samples.
Our findings extend previously published work by Munneke et al.6 on changes in blood innate lymphoid cells in patients with AML. Indeed, their work was focused on the correlation between ILC recovery and the decreased susceptibility to develop mucositis/acute graft-versus-host disease in AML patients receiving treatments. However, the comparison was between treated AML patients and healthy donors, lacking data on treatment-naïve AML patients. Therefore, our findings establish, for the first time in AML patients at diagnosis, base-line reference values for ILC frequency and function, as well as the ILC subtype distribution. These values may represent a useful benchmark to assess the effect of anti-cancer treatments on ILC number or function. However, while our work in conjunction with that by Munneke et al.6 strongly suggests the interesting possibility that ILCs may be implicated in the pathogenesis and progression of human AML, the significance of ILC dysregulation in number and of their functional impairment in AML awaits further investigation.
Footnotes
Funding: the Authors would like to thank the Novartis Foundation for Medical–Biological Research, the Fondazione San Salvatore and the University of Lausanne (Pro-Femmes-FBM-UNIL). The authors are indebted to the healthy donors and AML patients for their generous contribution.
Information on authorship, contributions, and financial & other disclosures was provided by the authors and is available with the online version of this article at www.haematologica.org.
References
- 1.Eisenring M, vom Berg J, Kristiansen G, Saller E, Becher B. IL-12 initiates tumor rejection via lymphoid tissue-inducer cells bearing the natural cytotoxicity receptor NKp46. Nat Immunol. 2010;11(11):1030–1038. [DOI] [PubMed] [Google Scholar]
- 2.Shields JD, Kourtis IC, Tomei AA, Roberts JM, Swartz MA. Induction of lymphoidlike stroma and immune escape by tumors that express the chemokine CCL21. Science. 2010;328(5979):749–752. [DOI] [PubMed] [Google Scholar]
- 3.Kirchberger S, Royston DJ, Boulard O, et al. Innate lymphoid cells sustain colon cancer through production of interleukin-22 in a mouse model. J Exp Med. 2013;210(5):917–931. [DOI] [PMC free article] [PubMed] [Google Scholar]
- 4.Ikutani M, Yanagibashi T, Ogasawara M, et al. Identification of innate IL-5-producing cells and their role in lung eosinophil regulation and antitumor immunity. J Immunol. 2012;188(2):703–713. [DOI] [PubMed] [Google Scholar]
- 5.Jovanovic IP, Pejnovic NN, Radosavljevic GD, et al. Interleukin-33/ST2 axis promotes breast cancer growth and metastases by facilitating intratumoral accumulation of immunosuppressive and innate lymphoid cells. Int J Cancer. 2014;134(7):1669–1682. [DOI] [PubMed] [Google Scholar]
- 6.Munneke JM, Björklund AT, Mjösberg JM, et al. Activated innate lymphoid cells are associated with a reduced susceptibility to graft versus host disease. Blood. 2014;124(5):812–821. [DOI] [PubMed] [Google Scholar]
- 7.Spits H, Artis D, Colonna M, et al. Innate lymphoid cells - a proposal for uniform nomenclature. Nat Rev Immunol. 2013;13(2):145–149. [DOI] [PubMed] [Google Scholar]
- 8.Seillet C, Belz GT, Mielke LA. Complexity of cytokine network regulation of innate lymphoid cells in protective immunity. Cytokine. 2014;70(1):1–10. [DOI] [PubMed] [Google Scholar]
- 9.Sonnenberg GF, Mjosberg J, Spits H, Artis D. SnapShot: Innate lymphoid cells. Immunity. 2013;39(3):662–662.e1 [DOI] [PubMed] [Google Scholar]
- 10.Killig M, Glatzer T, Romagnani C. Recognition strategies of group 3 innate lymphoid cells. Front Immunol. 2014;5(142):1–8. [DOI] [PMC free article] [PubMed] [Google Scholar]
- 11.Stringaris K, Sekine T, Khoder A, et al. Leukemia-induced phenotypic and functional defects in natural killer cells predict failure to achieve remission in acute myeloid leukemia. Haematologica. 2014; 99(5):836–847. [DOI] [PMC free article] [PubMed] [Google Scholar]
- 12.Santini V, Gozzini A, Scappini B, Rossi Ferrini P. Maturation and apoptosis of primary human acute myeloblastic leukemia cells are determined by TNF-alpha exclusively through CD120A stimulation. Haematologica. 1999;84(4):291–297. [PubMed] [Google Scholar]


