Abstract
We developed a real-time drug-reporting conjugate (CPT-SS-CyN) composed of a near-infrared (NIR) fluorescent cyanine-amine dye (CyN), a disulfide linker, and a model therapeutic drug (camptothecin, CPT). Treatment with dithiothreitol (DTT) induces cleavage of the disulfide bond, followed by two simultaneous intramolecular cyclization reactions with identical kinetics, one to cleave the urethane linkage to release the NIR dye and the other to cleave the carbonate linkage to release CPT. The released CyN has an emission wavelength (760 nm) that is significantly different from CPT-SS-CyN (820 nm), enabling easy detection and monitoring of drug release. A linear relationship between the NIR fluorescence intensity at 760 nm and the amount of CPT released was observed, substantiating the use of this drug-reporting conjugate to enable precise, real-time, and non-invasive quantitative monitoring of drug release in live cells and semi-quantitative monitoring in live animals.
Introduction
Accurate assessment and monitoring of the concentration of functional agents in biological tissues is important in biology and medicine.1-4 In anticancer drug development and clinical cancer treatment specifically, the therapeutic benefit of drugs is a function of the concentration-time profile in tumor tissues.5-8 Therefore, it is crucial to know the change of drug concentration in the plasma and local tissues over a certain time-course.1 As the vast majority of therapeutic agents used in pro-drug and conjugated nanomedicine are in their inactive form, it is also essential to ensure the conjugated, inactive drug can actually be released in vivo and become therapeutically active.9-15 However, conventional methods to assess the drug release and track the dynamics of active drug concentrations are very complicated.2,16-21 Harvested tissues generally need to be homogenized and cells need to be lysed in order to release the agents from certain intracellular compartments.22-29 During these processes, especially in the process of cell lysis, the intact drug carriers (e.g., micelles or liposomes) will also be disrupted, posing great difficulty in differentiating the released active agents from those inactive agents remaining in the carriers at the point of tissue harvesting. As such, development of minimally invasive or non-invasive methods to confirm the drug release and determine the active drug concentration kinetics in localized tissues is of great benefit.30
Near-infrared (NIR) fluorescence imaging has been widely used for monitoring biological processes in living objects because of its deep tissue penetration capability of NIR signal and the effective elimination of tissue auto fluorescence interference.31-37 Compared to other molecular imaging techniques such as magnetic resonance imaging (MRI), positron emission tomography (PET), and computed tomography (CT), NIR fluorescence imaging has great potential to track some biological processes noninvasively, in real time, and with sequential, longitudinal monitoring capability.38-42 Using NIR fluorescence imaging as a readout tool, which has been used in drug delivery applications, would be of particular interest for tracking the kinetics of drug release in vivo.43-46 Here, we report the design and use of CPT-SS-CyN to enable precise, real-time, and non-invasive monitoring of drug release quantitatively in live cells and semi-quantitatively in vivo. CPT-SS-CyN has a built-in disulfide bond, which can be cleaved through reduction in the cells. The cleavage of the disulfide bond controls the two subsequent elimination reactions that are responsible for the concurrent release of the drug and reporting dye molecule.
Results and discussion
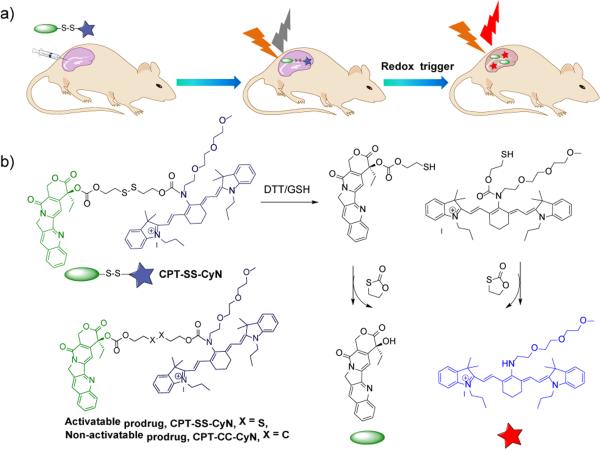
CPT-SS-CyN is composed of a near-infrared fluorescent cyanineamine dye (CyN), a reductive-responsive disulfide linker, and a model therapeutic drug (camptothecin, CPT). The disulfide linker between the drug and the NIR dye is responsive to intracellular reducing agents such as glutathione (GSH), cysteine (Cys) and thioredoxin (Trx).47-50 Treatment with these reducing reagents induces cleavage of the disulfide bond, followed by two subsequent intramolecular cyclization reactions, one to cleave the urethane linkage to release the NIR dye and the other to cleave the carbonate linkage to release CPT with 1,3-oxathiolan-2-one as the same byproduct of the two cyclization reactions. The released NIR dye has a maximum emission wavelength (760 nm) that is significantly different from CPT-SS-CyN (820 nm), and the release of the NIR dye can thus be used to monitor the release of CPT in vitro and in vivo (Scheme 1).
Scheme 1.
(a) Schematic illustration of real-time tracking of active drug release in vivo. (b) Proposed mechanism for concurrent NIR/CPT release from CPT-SS-CyN triggered by DTT/GSH.
Synthesis details of CPT-SS-CyN can be found in the Electronic Supporting Information (Scheme S1-5 and Fig. S1-5†). The chemical structure of CPT-SS-CyN was confirmed by 1H NMR, 13C NMR and ESI-MS analyses (Fig. S4-5†). RP-HPLC analysis showed over 95% purity of the obtained CPT-SS-CyN (Fig. S6†). Following the same method, we synthesized CPT-CC-CyN as the noncleavable control (Scheme S1). We first used RP-HPLC and ESI-MS to confirm the trigger-induced degradation of CPT-SS-CyN upon the addition of dithiothreitol (DTT). As shown in the RP-HPLC spectrum, the single peak of CPT-SS-CyN at 40.6 min, corresponding to the major peak of 1220.5 m/z in the ESI-MS spectrum, decreased significantly upon treatment with DTT (Fig. S6c-6d†). Released CPT (16.2 min) and CyN (44.2 min) were detected (Fig. S6†), demonstrating the successful disulfide cleavage of CPT-SS-CyN followed by the two concurrent elimination reactions as shown in Scheme 1.
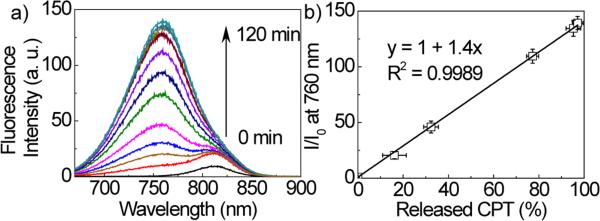
We then used a combined RP-HPLC and fluorimetric analysis to further confirm that the release of CPT occurred concurrently with the observed fluorescence changes (Fig. S7-S8†). At different time points, amount of CPT released was measured by RP-HPLC and fluorescence intensity of degraded products was measured at 760 nm on a fluorescence spectrometer. As shown in Fig. 1, when CPT-SSCyN was treated with DTT, the percentage of the released CPT was found to have a linear correlation with the normalized increase in fluorescence intensity at 760 nm (R2 = 0.9989). In the absence of DTT, however, neither CPT release nor enhanced fluorescence intensity at 760 nm was observed. In comparison, CPT-CC-CyN without a disulfide linker (10 μM) showed no release of CPT or CyN in the presence of 100-fold DTT concentration (1 mM) (Fig. S9b†).We thus consider that the change in fluorescence emission at 760 nm can act as a direct on-off signal to determine CPT release.
Fig. 1.

(a) Fluorescence intensity changes of CPT-SS-CyN (10 μM) upon DTT treatment (1 mM) for up to 120 min. The excitation wavelength was 650 nm. (b) The correlation of fluorescence increase at 760 nm (release of CyN from CPT-SS-CyN, 10 μM) with the release of CPT from CPT-SS-CyN in presence of DTT (1 mM).
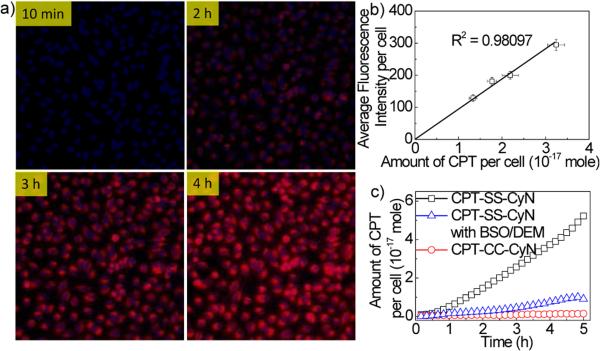
To demonstrate our hypothesis that the active drug release and kinetics could be quantitatively assessed by monitoring the NIR fluorescence signal changes in live cells, Hoechst pre-stained HeLa cells in serum free DMEM medium was incubated with CPT-SS-CyN (0.5 μM), and NIR fluorescence imaging was collected in-situ with an emission filter of 680-750 nm on a GE In-Cell Analyzer at different time points (Fig. 2a). Significant increase in fluorescence signal was observed in HeLa cells after 2-h incubation, indicating the uptake of CPTSS-CyN and release of CyN and CPT in cells. The gradual increase in the NIR fluorescence intensity in the range of 680-750 nm was observed over time. In comparison, no fluorescence signal in the range of 680-750 nm was observed in HeLa cells after treatment with CPT-CC-CyN (0.5 μM) for 5 h (Fig. 2c, and Fig. S9c†). To demonstrate that the fluorescent enhancement in HeLa cells was due to reductive degradation of CPT-SS-CyN, L-buthionine sulfoximine (BSO, 100 μM) and diethylmaleate (DEM, 300 μM) were used as GSH inhibitors to investigate whether inhibition of GSH levels in HeLa cells would reduce or slow down the degradation of the reporting conjugate.51 As shown in Fig. 2c, fluorescence signal in the range of 680-750 nm greatly decreased in BSO/DEM treated HeLa cells after 5-h incubation with CPT-SS-CyN (0.5 μM).
Fig. 2.
(a) Fluorescence microscopy images of HeLa cells incubated with CPT-SS-CyN using the GE In-Cell Analyzer. The cells were incubated with serum free DMEM medium containing CPT-SS-CyN (0.5 μM), and then the images were obtained at each time point (10 min, 2, 3, and 4 h) at 37 °C. The nucleus was stained with Hoechst. The cell images were obtained using the DAPI channel (excitation at 320-370 nm, emission at 430-580 nm) and the Cy5 channel (excitation at 640-660 nm, emission at 680-750 nm). (b) Relationship between average fluorescence intensity per cell (background fluorescence signal has been subtracted) and the amount of CPT released per HeLa cell. (c) Amount of CPT released from CPT-SS-CyN with/without BSO/DEM inhibitors and CPT-CC-CyN with incubation time in HeLa cells. The cells were incubated with serum free Opti-MEM medium containing CPT-SS-CyN (0.5 μM), and then the images were obtained every 10 min at 37°C. The nucleus were stained with Hoechst. The cells were imaged using the DAPI channel (excitation at 320-370 nm, emission at 430-580 nm) and the Cy5 channel (excitation at 640-660 nm, emission at 680-750 nm).
To evaluate whether CPT-SS-CyN enables quantitative assessment of released CPT via following the fluorescence changes in live cells, we measured the concentrations of the released CPT in lysed HeLa cells via liquid chromatography-multiple-reaction monitoring-mass spectrometry (LCMRM/MS) and the fluorescence intensity change at 680-750 nm per cell via GE In-Cell Analyzer (Fig. S10-S14†), and then sought inter-correlation of these two parameters. As shown in Fig. 2b, a linear relationship (R2 = 0.98) between the average fluorescence intensity per cell and the amount of released CPT per cell was observed, demonstrating that the NIR fluorescence intensity change can be utilized as a diagnostic tool for quantitative CPT release studies. This calculation was further validated by correlating the average fluorescence intensity with the amount of released CyN in the living cells. Fig. S12† showed the average fluorescence intensity enhancement at Cy5 channel (excitation at 640-660 nm, emission at 680-750 nm) analyzed by GE In-Cell Analyzer correlates linearly (R2 = 0.98) with the amount of CyN released per cell, as determined by fluorescence spectrometer. Fig. S13† showed a linear relationship between the average amount of CyN per cell analyzed by fluorescence method and average amount of CPT per cell analyzed by LC-MRM/MS. The real-time tracking of active CPT release in the living cells was further investigated. As shown in Fig. 2d, the amount of actively released CPT increased from 0.094 × 10⁻¹⁷ mole/cell at 10 min post incubation to 5.223 × 10⁻¹⁷ mole/cell at 5 h post incubation. However, negligible enhancement of the average fluorescence intensity per cell was observed when HeLa cells were incubated with CPT-CC-CyN, indicating minimal release of CyN and CPT. These studies and experimental results demonstrated the potential of CPT-SS-CyN prodrug as a diagnostic tool for real-time tracking of CPT release quantitatively in live cells.
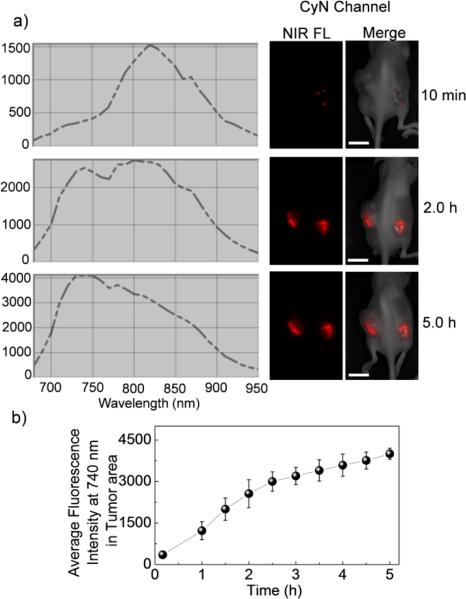
We next assessed the drug-reporting capability of CPT-SSCyN in vivo. Athymic nude mice bearing human A375 melanoma were intratumorally injected with CPT-SS-CyN (5 nmol of CyN, in 25 μL DMSO/PBS (1:10 v/v)) and in vivo whole-body fluorescence imaging was taken on an in vivo imaging system (Maestro, CRi, Inc., excitation filter: 615-665 nm, emission filter: 680-950 nm). Image collection started simultaneously as the intratumoral injection of CPT-SS-CyN and continued for 5 h. Fig. 3a showed the fluorescence spectra of tumor tissues and the whole-body images of mice at 10 min, 2 h, and 5 h post injection of CPT-SS-CyN. During the entire imaging acquisition period (5 h), strong and steady fluorescence signal enhancement was observed at 10 min post injection, and the fluorescence spectra of tumor tissues showed a noticeable shift from ~820 nm (CPT-SS-CyN emission) to ~ 740 nm (CyN emission). The increase in the fluorescent intensity of CyN at 740 nm over time in tumor tissues was showed in Fig. 3b. The fluorescence intensity at 5 h post injection increased by 5 times compared to that at 10 min post-injection. Based on the obtained linear relationship of CPT release and CyN fluorescence intensity enhancement from the in vitro CPT-SS-CyN (Fig. S13†), the amount and kinetics of active CPT release thus can be monitored semi-quantitatively in vivo. We evaluated the cytotoxicity of CPT, CyN, CPT-SSCyN, and CPT-CC-CyN using 3-(4,5-dimethylthiazol-2-yl)-2,5-diphenyltetrazolium bromide (MTT) assay (Fig. S15†). Both the NIR dye (CyN) and the control prodrug (CPT-CCCyN) showed negligible cytotoxicity against HeLa cells. While CPT-SS-CyN showed comparable cytotoxicity to free CPT due to the intracellular GSH induced CPT release.
Fig. 3.
Real-time reporting of CPT release from CPT-SS-CyN in female athymic nude mice bearing human A375 melanoma. (a) Fluorescence spectra (CyN channel) of tumor tissues and whole body NIR fluorescence images of athymic nude mice bearing human A375 melanoma following a single intratumoral injection of CPT-SS-CyN (5 nmol/tumor, the scale bar is 1.0 cm). Images taken at 10 min, 2 h, and 5 h by a Maestro in vivo whole-animal fluorescence imaging system (excitation at 615-665 nm, emission at 680-950 nm) were shown. (b) Average fluorescence intensity profile at 740 nm of tumor tissues after injection of CPT-SS-CyN.
Conclusions
In summary, we developed a real-time drug-reporting system (CPT-SS-CyN) composed of a disulfide bond as a cleavable linker, a cyanine-amide moiety as a near-infrared (NIR) fluorescence reporter, and camptothecin (CPT) as a model therapeutic agent. Treatment with DTT induces cleavage of the disulfide bond, followed by two simultaneous intramolecular cyclization reactions, which leads to concurrent release of CPT and NIR dye. We have demonstrated the possibility of real-time monitoring drug release via reading the NIR fluorescence change in vitro and in vivo. Given the quantitative assessments in the live cells and semi-quantitative measurements in live animals, this developed drug reporting system may enable more precise, real-time, and non-invasive monitoring of active drug release in the development and application of chemotherapeutic treatments. This technique may also be broadly used for monitoring the in vitro and in vivo release of other substrates, such as small molecule inhibitors and activators. The conjugate may be encapsulated or conjugated (e.g., via the oligo(ethylene glycol) terminal) to a controlled release device for drug delivery applications.
Supplementary Material
Acknowledgements
This work is supported by the National Institute of Health (Director's New Innovator Award 1DP2OD007246-01). Q.Y. and J.L. were funded at UIUC from the NIH National Cancer Institute Alliance for Nanotechnology in Cancer “Midwest Cancer Nanotechnology Training Center” Grant R25CA154015A. We thank Dr. Kevin Tucker for analysis of CPT concentration via LC-MRM/MS method.
Footnotes
Electronic Supplementary Information (ESI) available: Experimental details, including the synthesis and characterization of prodrugs, degradation of prodrugs, and analysis of fluorescence arising process in vitro and in vivo. See DOI: 10.1039/b000000x/
References
- 1.Hallifax D, Foster JA, Houston JB. Pharm. Res. 2010;27:2150. doi: 10.1007/s11095-010-0218-3. [DOI] [PubMed] [Google Scholar]
- 2.Chu X, Korzekwa K, Elsby R, Fenner K, Galetin A, Lai Y, Matsson P, Moss A, Nagar S, Rosania GR, Bai JPF, Polli JW, Sugiyama Y, Brouwer KLR, Consortium IT. Clinical Pharmacology & Therapeutics. 2013;94:126. doi: 10.1038/clpt.2013.78. [DOI] [PMC free article] [PubMed] [Google Scholar]
- 3.Mateus A, Matsson P, Artursson P. Mol. Pharmaceut. 2013;10:2467. doi: 10.1021/mp4000822. [DOI] [PubMed] [Google Scholar]
- 4.Dollery CT. Clin. Pharmacol. Ther. 2013;93:263. doi: 10.1038/clpt.2012.240. [DOI] [PubMed] [Google Scholar]
- 5.Gallo JM, Vicini P, Orlansky A, Li SL, Zhou F, Ma JG, Puffer S, Bookman MA, Guo P. Clin. Cancer Res. 2004;10:8048. doi: 10.1158/1078-0432.CCR-04-0822. [DOI] [PubMed] [Google Scholar]
- 6.Gao B, Yeap S, Clements A, Balakrishnar B, Wong M, Gurney H. J. of Clin. Oncol. 2012;30:4017. doi: 10.1200/JCO.2012.43.5362. [DOI] [PubMed] [Google Scholar]
- 7.Zhou QY, Gallo JM. Aaps J. 2011;13:111. doi: 10.1208/s12248-011-9253-1. [DOI] [PMC free article] [PubMed] [Google Scholar]
- 8.Rosso L, Brock CS, Gallo JM, Saleem A, Price PM, Turkheimer FE, Aboagye EO. Cancer Res. 2009;69:120. doi: 10.1158/0008-5472.CAN-08-2356. [DOI] [PubMed] [Google Scholar]
- 9.Das M, Datir SR, Singh RP, Jain S. Mol. Pharm. 2013;10:2543. doi: 10.1021/mp300701e. [DOI] [PubMed] [Google Scholar]
- 10.Kopecek J. Adv. Drug Delivery Rev. 2013;65:49. doi: 10.1016/j.addr.2012.10.014. [DOI] [PMC free article] [PubMed] [Google Scholar]
- 11.Venditto VJ, Szoka FC. Adv. Drug Delivery Rev. 2013;65:80. doi: 10.1016/j.addr.2012.09.038. [DOI] [PMC free article] [PubMed] [Google Scholar]
- 12.Hu XL, Hu JM, Tian J, Ge ZS, Zhang GY, Luo KF, Liu SY. J. Am. Chem. Soc. 2013;135:17617. doi: 10.1021/ja409686x. [DOI] [PubMed] [Google Scholar]
- 13.Jin EL, Zhang B, Sun XR, Zhou ZX, Ma XP, Sun QH, Tang JB, Shen YQ, Van Kirk E, Murdoch WJ, Radosz M. J. Am. Chem. Soc. 2013;135:933. doi: 10.1021/ja311180x. [DOI] [PubMed] [Google Scholar]
- 14.Drbohlavova J, Chomoucka J, Adam V, Ryvolova M, Eckschlager T, Hubalek J, Kizek R. Curr. Drug Metab. 2013;14:547. doi: 10.2174/1389200211314050005. [DOI] [PubMed] [Google Scholar]
- 15.Zhang YF, Yin Q, Yin LC, Ma L, Tang L, Cheng JJ. Angew. Chem. Int. Ed. 2013;52:6435. doi: 10.1002/anie.201300497. [DOI] [PMC free article] [PubMed] [Google Scholar]
- 16.Mathijssen RHJ, Sparreboom A, Verweij J. Nat. Rev. Clin. Oncol. 2014;11:272. doi: 10.1038/nrclinonc.2014.40. [DOI] [PubMed] [Google Scholar]
- 17.Laginha KM, Verwoert S, Charrois GJR, Allen TM. Clin. Cancer Res. 2005;11:6944. doi: 10.1158/1078-0432.CCR-05-0343. [DOI] [PubMed] [Google Scholar]
- 18.Longa GJ, Cross RE. Emerg. Med. 1987;19:115. [Google Scholar]
- 19.Svensson CK, Woodruff MN, Baxter JG, Lalka D. Clin. Pharmacokinet. 1986;11:450. doi: 10.2165/00003088-198611060-00003. [DOI] [PubMed] [Google Scholar]
- 20.Levy RH. Ther. Drug Monit. 1983;5:243. doi: 10.1097/00007691-198309000-00001. [DOI] [PubMed] [Google Scholar]
- 21.Wienkers LC, Heath TG. Nat. Rev. Drug Discovery. 2005;4:825. doi: 10.1038/nrd1851. [DOI] [PubMed] [Google Scholar]
- 22.Tong R, Cheng JJ. Polym. Rev. 2007;47:345. [Google Scholar]
- 23.Greco F, Vicent MJ. Adv. Drug Delivery Rev. 2009;61:1203. doi: 10.1016/j.addr.2009.05.006. [DOI] [PubMed] [Google Scholar]
- 24.Duncan R. Nat. Rev. Cancer. 2006;6:688. doi: 10.1038/nrc1958. [DOI] [PubMed] [Google Scholar]
- 25.Tang L, Cheng JJ. Nano Today. 2013;8:290. doi: 10.1016/j.nantod.2013.04.007. [DOI] [PMC free article] [PubMed] [Google Scholar]
- 26.Farokhzad OC, Cheng JJ, Teply BA, Sherifi I, Jon S, Kantoff PW, Richie JP, Langer R. Proc. Natl. Acad. Sci. U. S. A. 2006;103:6315. doi: 10.1073/pnas.0601755103. [DOI] [PMC free article] [PubMed] [Google Scholar]
- 27.Yuan YY, Mao CQ, Du XJ, Du JZ, Wang F, Wang J. Adv. Mater. 2012;24:5476. doi: 10.1002/adma.201202296. [DOI] [PubMed] [Google Scholar]
- 28.Talelli M, Iman M, Varkouhi AK, Rijcken CJF, Schiffelers RM, Etrych T, Ulbrich K, van Nostrum CF, Lammers T, Storm G, Hennink WE. Biomaterials. 2010;31:7797. doi: 10.1016/j.biomaterials.2010.07.005. [DOI] [PubMed] [Google Scholar]
- 29.Chen CY, Kim TH, Wu WC, Huang CM, Wei H, Mount CW, Tian YQ, Jang SH, Pun SH, Jen AKY. Biomaterials. 2013;34:4501. doi: 10.1016/j.biomaterials.2013.02.049. [DOI] [PMC free article] [PubMed] [Google Scholar]
- 30.Mourant JR, Johnson TM, Los G, Bigio LJ. Phys. Med. Biol. 1999;44:1397. doi: 10.1088/0031-9155/44/5/322. [DOI] [PubMed] [Google Scholar]
- 31.Jung HK, Wang K, Jung MK, Kim IS, Lee BH. PLoS One. 2014:9. doi: 10.1371/journal.pone.0100341. [DOI] [PMC free article] [PubMed] [Google Scholar]
- 32.Robinson JT, Hong GS, Liang YY, Zhang B, Yaghi OK, Dai HJ. J. Am. Chem. Soc. 2012;134:10664. doi: 10.1021/ja303737a. [DOI] [PMC free article] [PubMed] [Google Scholar]
- 33.Dacosta RS, Tang Y, Kalliomaki T, Reilly RM, Weersink R, Elford AR, Marcon NE, Wilson BC. J. Innov. Opt. Health Sci. 2009;2:407. [Google Scholar]
- 34.Chen XY, Conti PS, Moats RA. Cancer Res. 2004;64:8009. doi: 10.1158/0008-5472.CAN-04-1956. [DOI] [PubMed] [Google Scholar]
- 35.Jung W, Boppart SA. Anal. Cell. Pathol. 2012;35:129. doi: 10.3233/ACP-2011-0047. [DOI] [PMC free article] [PubMed] [Google Scholar]
- 36.Choi HS, Liu WH, Liu FB, Nasr K, Misra P, Bawendi MG, Frangioni JV. Nat. Nanotechnol. 2010;5:42. doi: 10.1038/nnano.2009.314. [DOI] [PMC free article] [PubMed] [Google Scholar]
- 37.Zaheer A, Lenkinski RE, Mahmood A, Jones AG, Cantley LC, Frangioni JV. Nat. Biotechnol. 2001;19:1148. doi: 10.1038/nbt1201-1148. [DOI] [PubMed] [Google Scholar]
- 38.Choy G, O'Connor S, Diehn FE, Costouros N, Alexander HR, Choyke P, Libutti SK. BioTechniques. 2003;35:1022. doi: 10.2144/03355rr02. [DOI] [PubMed] [Google Scholar]
- 39.Li C, Wang W, Wu QP, Shi K, Houston J, Sevick-Muraca E, Dong L, Chow D, Charnsangavej C, Gelovani JG. Nucl. Med. Biol. 2006;33:349. doi: 10.1016/j.nucmedbio.2006.01.001. [DOI] [PubMed] [Google Scholar]
- 40.Wu Y, Cai WB, Chen XY. Mol. Imaging Biol. 2006;8:226. doi: 10.1007/s11307-006-0041-8. [DOI] [PMC free article] [PubMed] [Google Scholar]
- 41.Oliveira S, van Dongen GAMS, Stigter-van Walsum M, Roovers RC, Stam JC, Mali W, van Diest PJ, van Bergen en Henegouwen PMP. Mol. Imaging. 2012;11:33. [PubMed] [Google Scholar]
- 42.Pan H, Zhang PF, Gao DY, Zhang YJ, Li P, Liu LL, Wang C, Wang HZ, Ma YF, Cai LT. ACS Nano. 2014;8:5468. doi: 10.1021/nn501028b. [DOI] [PubMed] [Google Scholar]
- 43.Tang L, Yang XJ, Dobrucki LW, Chaudhury I, Yin Q, Yao C, Lezmi S, Helferich WG, Fan TM, Cheng JJ. Angew. Chem. Int. Ed. 2012;51:12721. doi: 10.1002/anie.201205271. [DOI] [PMC free article] [PubMed] [Google Scholar]
- 44.Weissleder R, Tung CH, Mahmood U, Bogdanov A. Nat. Biotechnol. 1999;17:375. doi: 10.1038/7933. [DOI] [PubMed] [Google Scholar]
- 45.Yang Z, Lee JH, Jeon HM, Han JH, Park N, He Y, Lee H, Hong KS, Kang C, Kim JS. J. Am. Chem. Soc. 2013;135:11657. doi: 10.1021/ja405372k. [DOI] [PubMed] [Google Scholar]
- 46.Wu XM, Sun XR, Guo ZQ, Tang JB, Shen YQ, James TD, Tian H, Zhu WH. J. Am. Chem. Soc. 2014;136:3579. doi: 10.1021/ja412380j. [DOI] [PubMed] [Google Scholar]
- 47.Zheng ZB, Zhu GZ, Tak H, Joseph E, Eiseman JL, Creighton DJ. Bioconjugate Chem. 2005;16:598. doi: 10.1021/bc0499634. [DOI] [PubMed] [Google Scholar]
- 48.Lee MH, Kim JY, Han JH, Bhuniya S, Sessler JL, Kang C, Kim JS. J. Am. Chem. Soc. 2012;134:12668. doi: 10.1021/ja303998y. [DOI] [PubMed] [Google Scholar]
- 49.Estrela JM, Ortega A, Obrador E. Crit. Rev. Clin. Lab. Sci. 2006;43:143. doi: 10.1080/10408360500523878. [DOI] [PubMed] [Google Scholar]
- 50.Lee MH, Han JH, Lee JH, Choi HG, Kang C, Kim JS. J. Am. Chem. Soc. 2012;134:17314. doi: 10.1021/ja308446y. [DOI] [PubMed] [Google Scholar]
- 51.Horan AD, Chan CY, Pletcher CH, Menon C, Evans SM, Moore JS, Koch CJ. Cytometry. 1997;29:76. [PubMed] [Google Scholar]
Associated Data
This section collects any data citations, data availability statements, or supplementary materials included in this article.


