Abstract
Study design
Animal experimental study
Objective
To evaluate a novel quantitative imaging technique for assessing disc degeneration.
Summary of Background Data
T2-relaxation time (T2-RT) measurements have been used to quantitatively assess disc degeneration. T2 values correlate with the water content of inter vertebral disc tissue and thereby allow for the indirect measurement of nucleus pulposus (NP) hydration.
Methods
We developed an algorithm to subtract out MRI voxels not representing NP tissue based on T2-RT values. Filtered NP voxels were used to measure nuclear size by their amount and nuclear hydration by their mean T2-RT. This technique was applied to 24 rat-tail intervertebral discs’ (IVDs), which had been punctured with an 18-gauge needle according to different techniques to induce varying degrees of degeneration. NP voxel count and average T2-RT were used as parameters to assess the degeneration process at 1 and 3 months post puncture. NP voxel counts were evaluated against X-ray disc height measurements and qualitative MRI studies based on the Pfirrmann grading system.
Tails were collected for histology to correlate NP voxel counts to histological disc degeneration grades and to NP cross-sectional area measurements.
Results
NP voxel count measurements showed strong correlations to qualitative MRI analyses (R2=0.79, p<0.0001), histological degeneration grades (R2=0.902, p<0.0001) and histological NP cross-sectional area measurements (R2=0.887, p<0.0001).
In contrast to NP voxel counts, the mean T2-RT for each punctured group remained constant between months 1 and 3. The mean T2-RTs for the punctured groups did not show a statistically significant difference from those of healthy IVDs (63.55ms ±5.88ms month 1 and 62.61ms ±5.02ms) at either time point.
Conclusion
The NP voxel count proved to be a valid parameter to quantitatively assess disc degeneration in a needle puncture model. The mean NP T2-RT does not change significantly in needle-puncture induced degenerated IVDs. IVDs can be segmented into different tissue components according to their innate T2-RT.
Keywords: intervertebral disc degeneration, quantitative MRI analysis, animal degeneration model, T2-relaxation time measurements, nucleus pulposus, 7 Tesla MRI, threshold subtraction
Introduction
MRI assessments are an important tool for studying disc degeneration clinically as well as for research purposes. Animal models have frequently been used to study disc degeneration using MR imaging, with the goal of developing treatment options to inhibit or reverse this process.[1, 2]
MRIs can be analyzed either qualitatively to describe the morphology of degenerated IVDs or quantitatively to measure specific tissue parameters related to pathological changes. For quantitative assessments, nucleus pulposus (NP) size, hydration and proteoglycan content are the most relevant parameters in intervertebral discs (IVD), as their declines are key characteristics of the disc degeneration process.[3-9]
T2-relaxation time (T2-RT) measurements correlate with IVD-tissue water content[10] and have therefore been used to quantify NP hydration in disc degeneration studies.[10-14]
Our group developed an algorithm based on T2 values to assess the NP size and water content of healthy and degenerated discs. The innovative aspect of this method is the subtraction of MRI voxels not representing NP tissue as determined by their T2-RT. As a result, the T2 values of NP tissue can be assessed separately; artifacts from the surrounding tissue are filtered out. In addition, this subtraction technique allows for measurement of the NP size according to the number of voxels that compose it. Therefore our group proposes the “NP voxel count” as a new parameter for measuring disc degeneration as well as a new means to calculate NP size. To our knowledge, no study has utilized T2-RT measurements to assess the size of the NP or to segment the IVD into its different components.
The viability of this method is demonstrated in a rat-tail needle puncture disc degeneration model. Needle puncturing of rat tail discs leads to extrusion of NP tissue with subsequent degenerative changes to the IVD.[15] Needle defects have been shown to induce histological, radiological and biochemical alterations to the NP and the AF.[15-18]
In the presented study, the NP voxel count of punctured IVDs was correlated to established outcome measures for this rat-tail model: disc height measurements using X-rays[19], qualitative MR imaging based on the modified Pffirmann scale[20] and histological assessments according to the grading system developed by Han B.[15]
In addition, by merging MRI T2 maps onto corresponding histological sections we validated the ability of this method to segment IVDs into their different tissue components.
Materials and Methods
Specimen
The study was approved and undertaken in accordance with the Hospital of Special Surgery Institutional Animal Care and Use Committee as well as New York state guidelines. Twenty-four athymic male nude rats (Hsd: RH-Foxn1rnu male 190-250g) were punctured between the third and fourth vertebra of the caudal spine using an 18-gauge needle; this needle size has been shown to reliably induce degenerative processes in rat tails.[16, 18] We used athymic rats to suppress possible immunoreactions of the injected collagen gel mentioned below.
In order to produce a variety of degeneration stages three different puncturing techniques were chosen: six animals were punctured percutaneously, six were punctured openly and twelve were punctured openly with simultaneous collagen gel injection to repair the puncture defect. Preliminary data by our group showed that high-density collagen gel can seal annular defects [26] and delay degenerative changes in a needle puncture rat tail model. All animals were followed up radiologically.
The discs proximally adjacent to the punctured IVDs of all specimen (n=24) were used as a healthy control.
Percutaneous procedure
Rats were anesthetized with isoflurane. Lateral radiographs were taken to localize and mark the target IVD level. The IVD was punctured in a posterior-anterior direction. The needle was withdrawn after X-ray verification of the intra-discal position of the needle tip.
Open procedure and collagen injection
A dorsal, 2cm longitudinal skin incision was made and the annulus fibrosus (AF) was exposed and punctured. The needle penetrated the AF until the bevel was completely inserted. In the collagen-injected group, the IVD was punctured and simultaneously injected with collagen around the annular defect.
Collagen gel preparation
Collagen type I was extracted from rat-tail tendons. The tendons were dissected and digested in a dilute solution of acetic acid (0.1% 80ml per gram, at 4°C for two days). The resulting solution was centrifuged and the collagen concentrated to 20mg/ml by lyophilization and resuspension in acetic acid.
Quantitative MR imaging
All groups underwent 7T MRI (Bruker 7T USR Preclinical MRI System) imaging at one and three months post-puncture.
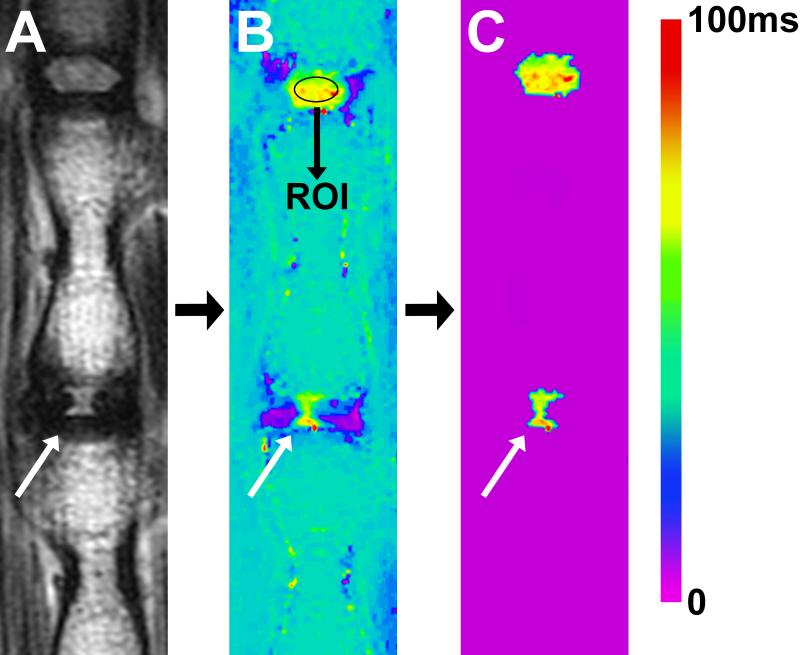
We used a sagittal multi-slice multi-echo (MSME) pulse sequence (TR=2000ms, TE=12ms, NEX=2, number of echoes = 12, echo spacing = 12ms, slice thickness = 1mm and matrix size = 320 X 320, resolution: 125μm X 125μm X 1mm) to create a T2 map based upon fitting semi-log plots of T2 signal intensity versus relaxation time for the twelve acquired echoes (Fig. 1, A). Bruker's proprietary program TopSpin™ was used for this fitting process. A color map was assigned to the resulting T2 map (Fig 1, B). Next, our algorithm was applied to this T2 map: An oval shaped standard region of interest (ROI) measuring ~1mm2 (comprising 90 voxels) was drawn in the center of the NP of the healthy disc proximal to the punctured IVD (Fig. 1, B). Subsequently, the mean T2-RT of the ROI was measured, and this value minus two standard deviations was used to set a subtraction threshold for all voxels in that slice. Voxels with T2 values lower than the threshold were subtracted out (Fig. 1, C). A freeform drawing tool was used to encircle the remaining NP voxels, which were then counted in the TopSpin™ program. Finally, the mean T2-RT of all encircled NP voxels was calculated (Fig. 1, C).
Fig. 1.
Quantitative MR imaging illustrating the method to determine NP size and hydrationy status according to T2-RTs. (A) T2 weighted MRI of a rat-tail with a needle-punctured disc (white arrow). (B) Matching image with T2-RT measurements displayed as a color map. A ROI was drawn within the NP of the proximal healthy adjacent disc. A subtraction threshold was calculated from the average T2-RT of the ROI, minus two standard deviations. (C) All voxels below the threshold were subtracted; remaining voxels in disc spaces were subsequently counted. In the last step the average T2-RT of those remaining voxels were measured.
The rationale for the chosen ROI size was to include a large portion of the nucleus (about ¾), while still leaving a border of NP tissue between the ROI and the surrounding AF or endplate to eliminate artifacts. A PhD student and a research assistant each performed the quantitative measurements twice in order to evaluate the intra- and inter-observer variability.
Qualitative MRI analysis
A sagittal TurboRare sequence (TR=2017, ms, TE=60ms, NEX=6, Echo train length=12, slice thickness = 1mm and matrix size = 320 X 320, resolution: 125μm X 125μm X 1mm) was utilized for qualitative assessments. We used a modified Pfirrmann grading system,[20] which divides IVD degeneration into four grades, according to NP signal intensity, homogeneity, and loss of disc height (Table 1). A board-certified radiologist and a spine fellow analyzed the MR images.
Table 1.
Modified MRI Pfirrmann grading
| Grade | Structural changes within NP | Signal intensity | Intervertebral disc height |
|---|---|---|---|
| I | Homogenous and bright | Hyperintense | Normal |
| II | Heterogeneous | Intermediate | Normal |
| III | Heterogeneous and gray | Intermediate | Decreased |
| IV | Heterogeneous and black | Hypointense | Decreased or collapsed |
NP, nucleus pulposus
Disc height measurements
X-rays were performed under anesthesia using a digital, self-contained cabinet X-ray (exposure time 10 seconds, 26 kV). Lateral images were taken centered on the experimented level. The IVD height was expressed as a disc height index (DHI) based on a modified method of Lu et al [19] using the Surgimap© program. The DHI was calculated by dividing disc height measurements by adjacent vertebral body height measurements.
Histology
Samples were fixated in 10% neutral buffered formalin with 1% by weight of 1-hexadecylyridinium chloride monohydrate. Subsequently the samples were decalcified in 10% EDTA with a 0.05M Tris buffered solution (pH 7.4). The segments were then cut mid-sagittaly, embedded in paraffin and cut to 5-μm thick sections. The sections were stained with Alcian Blue and Safranin O. Disc degeneration was evaluated according to the Han scaling system[15] which takes AF/NP cellularity, morphology and border into account.
A Bioquant image analysis program was used to draw a ROI around the NP manually to measure its mid-sagittal cross-sectional area. Six collagen-injected animals were sacrificed and measured after one month, the other six after three months. Two openly punctured animals were measured after one month and the remaining four after three months. Six healthy adjacent discs were included in cross-sectional area calculations.
T2/histology merging
T2 maps were overlaid onto corresponding histological sections using a raster graphics editor (GIMP 2.8). Both layers were locked to maintain their height-to-width ratio throughout editing. T2 maps were scaled upwards in size until a clear fit was evident, as indicated by corresponding histological landmarks.
Statistics
In order to determine the inter- and intra-observer variability two independent observers repeated their assessment twice within two days. Inter-observer variability was assessed by the interclass correlation coefficient (ICC) using a two-way random effects model (i.e., assumes that observers are randomly sampled from a pool of observers and animals are randomly sampled from a pool of animals). The intra-observer variability was assessed by the Pearson correlation coefficient, “r”. The ICC and the Pearson correlation coefficient have been widely used to validate radiological methods.[21, 22]
Comparisons of voxel count measurements and of mean T2 values over time were performed with a two-way analysis of variance (ANOVA) test and all pairwise comparisons were adjusted for multiple comparisons by post-hoc Tukey's test. Pearson correlation coefficient was used to evaluate correlation between the voxel count value and other outcome measures; linear regression test was performed and R square predictive value was calculated. All analyses were performed using appropriate statistical software (SPSS Version 18.0.0.1, SPSS Inc., Chicago, IL).
Results
Threshold calculations
The threshold for each specimen was calculated by determining the mean T2-relaxation time of a ROI of a healthy nucleus (Fig. 1, B), and then subtracting two standard deviations from that mean. The mean T2-RTs ranged from 55.9ms to 69.3ms (mean=61.07ms). The standard deviations (SD) ranged from 6.87ms to 10.5ms (mean=8.88ms). After subtraction, the resulting threshold value ranged from 41.6ms to 49.38ms (mean=43.3). The lowest T2 value from each ROI averaged 44.94ms ±5.42. Thus, for any ROI, subtracting two standard deviations from the mean T2-RT yields a threshold value that closely approximates the lowest measured T2-RT.
NP voxel count
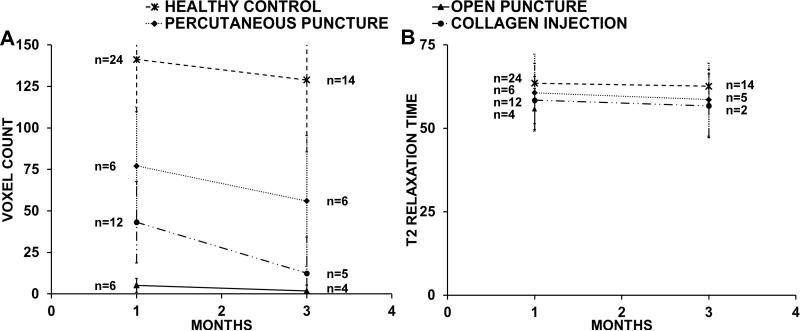
The mean NP voxel count of healthy adjacent discs was 141±31.5 (n=24) after one month and 129±43.43 (n=14) after three. The voxel count of all punctured discs decreased over time. The mean voxel counts of the percutaneously punctured group were 77±35.43 (n=6) at one month and 56±39.46 (n=6) at three months; of the open puncture group were 5±4.17 (n=6) and 0 (n=4); and of the collagen-injected group were 43±24.51 (n=12) and 12±21.7 (n=5) (Fig. 2, A). At all time points there was a statistically significant difference in voxel count between healthy adjacent discs and punctured discs (p<0.001).
Fig. 2.
(A) Comparison of the NP voxel count of healthy discs and all punctured groups. All punctured discs showed significant lower values at the 1 and 3 month time point than the healthy discs. The voxel count of all groups deteriorated between the one and three month time points. The percutaneous punctured group showed least degenerative changes followed by the collagen- injected group and the open punctured group. (B) Average NP T2-RT comparison of all punctured groups and healthy discs. There was no statistical significant difference in the average T2-RT between the punctured groups and healthy discs. There was no significant decrease between month one and three in all groups. All IVDs with 0 voxel counts are excluded from the graph. All error bars indicate standard deviation.
T2-relaxation time
The mean T2-RTs of healthy adjacent discs were 63.55ms±5.88ms (n= 20) after one month and 62.61ms±5.02ms (n=14) after three months; there was no statistically significant difference in mean T2-RTs between healthy and punctured discs at either time point (open: p=0.193 1 month, p=0.059 3 months; percutaneous: p=0.812 1 month, p=0.703 3 months; collagen injection: p=0.188 1 month, p=0.696 3 months). All T2 values remained constant; there was no statistically significant difference in mean T2-RTs at month one and month three (open: p=0.133; percutaneous: p=0.633; collagen injection: p=0.755).
Inter- and intra-observer variability
The ICC was used to assess the inter observer variability for each assessment. Between the two observers, the ICC for the first assessment was 0.961 (95% CI = 0.848, 0.991) (p<0.0001) for the NP voxel count measurements and 0.871 (95% CI = 0.561, 0.969) (p<0.0001) for the mean T2 time measurements. In the second assessment, the ICC between the two observers was 0.996 (95% CI = 0.986, 0.999) (p<0.0001) for the NP voxel count measurements and 1.000 (95% CI = 0.999, 1.000) (p<0.0001) for the mean T2 time measurements. These high ICC values imply that the two observers are interchangeable with each other.
The intra-observer variability was assessed by the Pearson correlation coefficient (r). The first observer demonstrated an r = 0.99 (p<0.0001) for two repeated NP voxel count measurements and an r = 1.00 (p<0.0001) for two repeated mean T2-RT measurements. The second observer demonstrated an r = 1.00 (p<0.0001) for two repeated NP voxel count measurements and an r = 0.88 (p<0.0001) for two repeated mean T2-RT measurements. These values imply low intra observer variability for both measures within each of the two observers.
Histology
Degenerative changes in needle-punctured IVDs have been described in detail by several groups. Our experiments revealed similar histological changes as described by other groups[16, 17, 23, 24], which progressed from one to three months. The punctured and collagen-injected groups showed a narrowing of NP tissue with a decline in NP cells and matrix resulting in an increased matrix-to-cell ratio. Extruded NP tissue was visible in the paravertebral space (Fig.3). The remaining intradiscal NP cells became slightly larger and formed clusters but maintained their typical morphology with a polymorph cell shape, intracellular vacuoles and stellar nuclei (Fig. 4). Round or ovoid chondrocytes infiltrated the AF leading to the formation of cartilage-resembling tissue bordering the NP (Fig. 4; Fig. 5). This tissue was clearly discernible from the NP, displaying a different cell morphology and a matrix which stained more intensely with Alcian blue and Safranin-O (Fig. 5). Chondrocyte infiltration and other morphological changes to the AF such as ruptured or serpentine fibers appeared concurrently with reduction in NP size. With further degeneration, the NP was continuously replaced by connective tissue. This connective tissue consists of elongated spindle-form fibroblasts embedded in an organized parallel-aligned fibrous matrix, a morphology resembling scar tissue. Despite the different cell shape this connective tissue also clearly differed from NP tissue as it stained much less intense for Alcian blue and Safranin-O. Extensive endplate damage was visible in the advanced degenerative stages. There was no sign of collagen leaking into the disc space in the collagen-injected group.
Fig. 3.
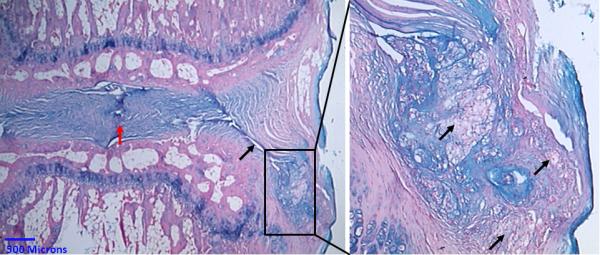
Alcian blue stain. Open needle punctured rat tail after 3 months. Left, red arrow points to the degenerated disc space with no residual NP tissue. The needle puncture defect (black arrow) is visible. The box marks nuclear tissue which extruded into the paravertebral space. Right, higher magnification of the extruded tissue. The polymorph vacuolated NP cells (black arrows) are clearly visible in the paravertebral space.
Fig. 4.
Alcian blue stain. Histological section demonstrating early degenerative changes of a needle punctured IVD after 1 month. (A) IVD at low magnification. The most prominent change in this specimen is the reduced size and altered shape of the NP compared to healthy discs C. (B) Higher magnification of box in A, the cluster formation of the NP cells becomes visible. The cells retain their typical morphological structure with stellar shaped nuclei and a vacuolated cytoplasm. The matrix-to-cell ratio increased in the NP. Close to the NP border the AF becomes infiltrated with chondrocyte resembling cells (black arrows).(C) Healthy disc with large oval shaped nucleus.
Fig. 5.
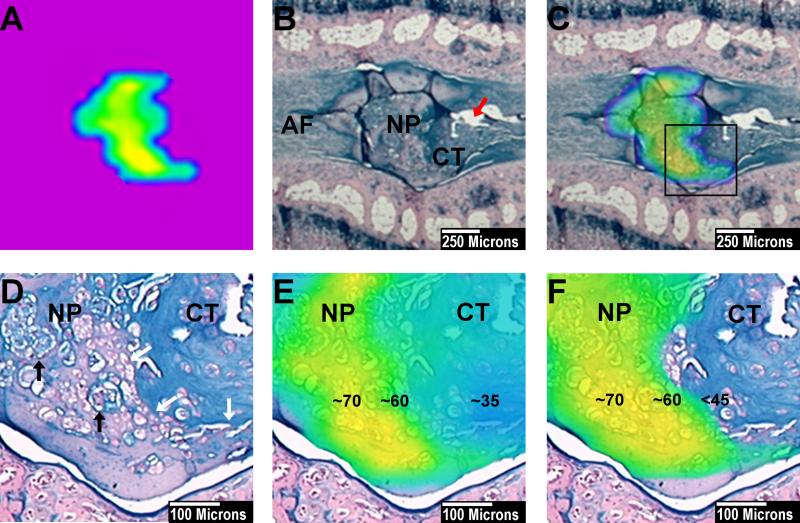
Demonstration of the thresholding technique which filters out non-NP tissue. Punctured IVD at one month. (A) NP after threshold subtraction. The NP voxel count is 33 voxels. (B) Alcian Blue stained slide of corresponding punctured IVD. The IVD was punctured on the right side with the AF defect still visible (red arrow). On the punctured side, the NP borders degenerative cartilage tissue (CT) on the contralateral side to AF tissue. There is a clear border delineating the NP from the surrounding tissue. (C) NP color map from part A, merged to the corresponding histological section. The shape of the NP is congruent with the shape of the histological NP. (D) Higher magnification of the marked area in part C. The NP tissue with its cluster forming NP cells (black arrows) shows a distinct border (white arrows) with degenerative cartilage tissue (CT). The cartilage tissue stains more intense for Alcian blue and contains chondrocytes. (E) T2 heat map merged over the NP and the bordering cartilage tissue (from part D). The center of the NP shows T2 values of 70ms (yellow) the NP border about 60ms (green). The cartilage tissue shows values around 35ms. (F) After threshold subtraction below 45ms only the NP tissue remains covered by the T2 color map. This indicates that after threshold subtraction the remaining voxels represent histological NP tissue. The surrounding degenerative tissue is filtered out.
NP cross-sectional area measurement
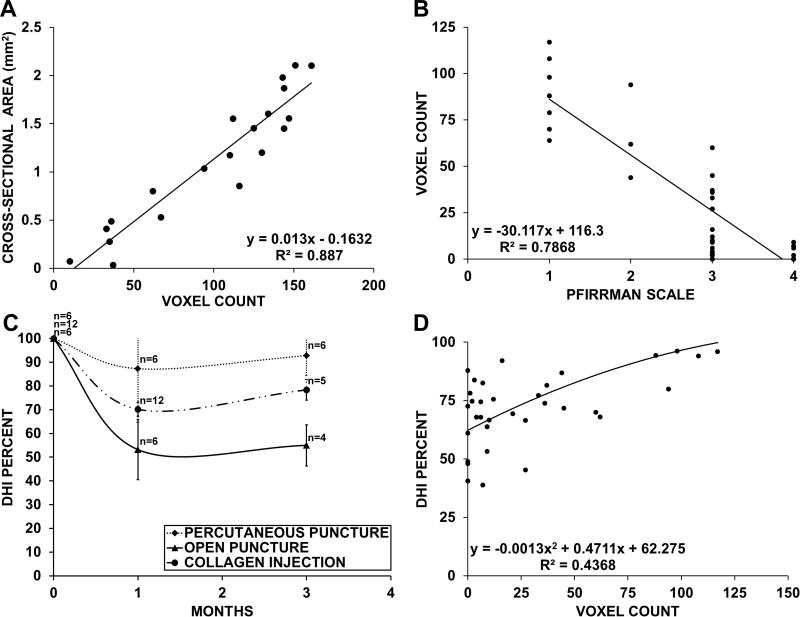
There was a strong correlation (R2=0.887, p<0.0001) between the histological cross-sectional area of all measured discs and their corresponding NP voxel count (Fig. 5, A). The mean cross-sectional area in healthy adjacent discs was 1.6mm2. In the collagen-injected group, the cross-sectional area was 0.68mm2 for those sacrificed at one month and it dropped to 0.17mm2 for those at three months. The cross-sectional area of the punctured group was 0mm2 at months one and three, as the NP appeared to have been completely replaced by connective tissue in all specimens.
Histological degeneration grade
There was a strong correlation (R2=0.902, p<0.0001) between the histological grading system and voxel count measurements. Adjacent healthy discs had a mean score of 5, punctured and injected a mean score of 9.8±3.49 and open punctured disc of 15.
Merging T2 maps with histology
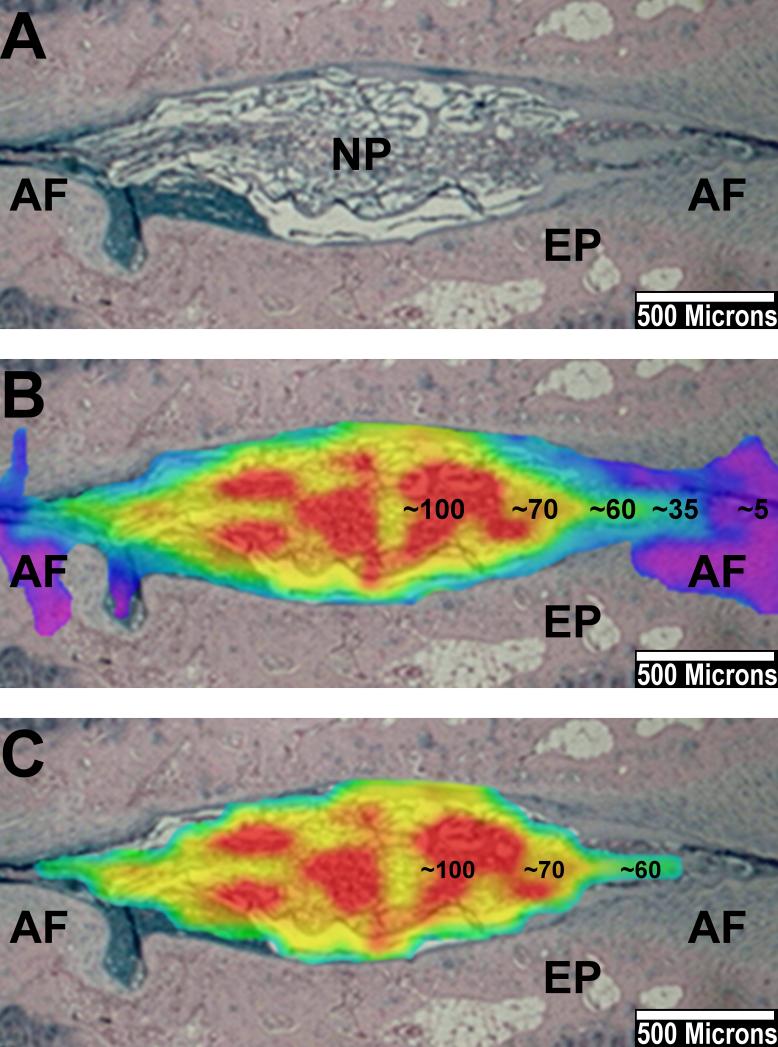
Merging IVD T2 heat maps with the corresponding histological sections allowed for the correlation of tissue components with specific T2-RT values (Fig. 5; Fig. 7). Nuclear cells and surrounding nuclear matrix represented tissue within the NP specific T2-RT range of 40-100ms (Fig. 5). The degenerative cartilage tissue bordering the NP had lower T2-RT values of 25-35ms (Fig. 7). The AF showed values between 5 and 35ms. Overall, the cartilage resembling tissue showed higher T2-RTs than did the AF; however, we did not include it in the NP because histological observations from this as well as other studies indicate that this tissue originates from a degenerative transformation of the AF. [15, 16]
Fig. 7.
Example of merging T2 color maps with histological sections. Alcian blue stained slide. Punctured disc at one month. (A) The NP shows a decreased size compared to healthy discs (not shown). The AF can be delineated from the NP on both sides. (B) Corresponding T2 color map merged on the histological section. The center of the NP shows peak values up to 100ms (red), the T2-RT continuously drops towards the AF and the surrounding endplate (EP). The AF shows values below 35ms. (C) Same image of B after threshold subtraction below 45ms. The T2 color map now almost exclusively covers histological NP tissue. The AF is filtered out.
Threshold subtraction has been shown to filter out all non-NP tissue (Fig. 7). Peak T2-RT values (80-100ms) on the NP color map represented a high concentration of vacuolated NP cells. The NP T2-RT continuously dropped towards the AF and the surrounding cartilage tissue on merged images (Fig. 5; Fig. 7).
Qualitative MRI analysis
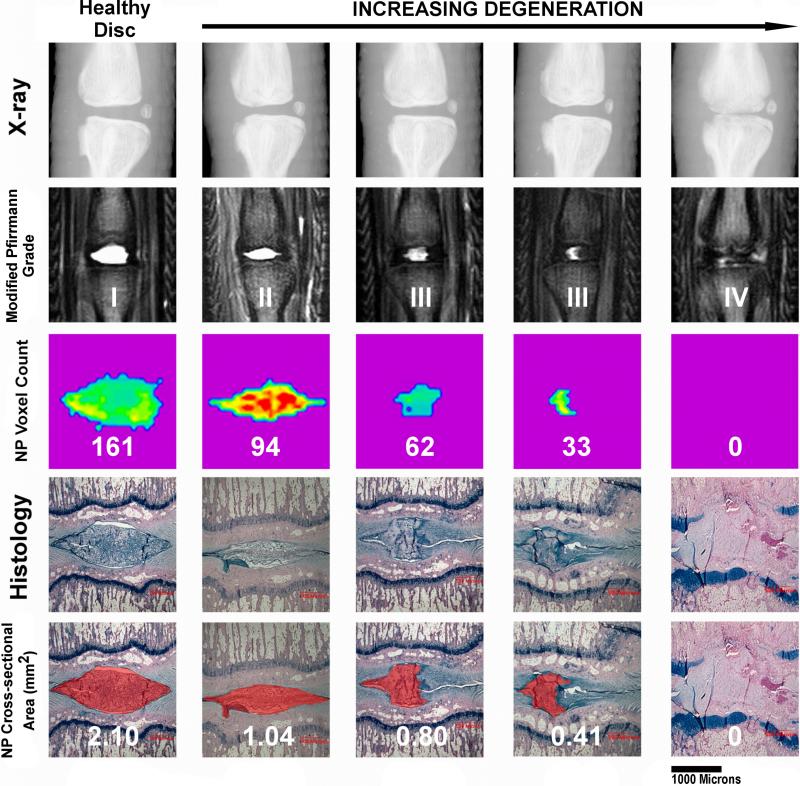
Altered shape, reduced disc height, and loss of NP size were the most frequent degenerative MRI changes (Fig. 8). The residual NP displayed high signal intensity in the center and in several specimens appeared less homogenous with lower signal intensity at the border to the AF (Fig. 8). However, in most animals the NP remained homogeneous without loss in signal intensity even though its size was reduced or the disc height decreased. In later degenerative stages, MRI showed black discs often combined with a collapsed disc space. At three months, the modified Pfirrmann Grades I-IV were found in 4, 2, 12, and 6 animals, respectively. Only 9 out of 24 animals had deteriorated between one and three months. Grade I covered a NP voxel count range of 117 to 64, Grade II 4 to 44, Grade III 60 to 5, and Grade IV 7 to 0. The modified Pfirrmann grade and the voxel count correlated (R2=0.79, p<0.0001). However, voxel counts overlapped when comparing different grades (Fig. 6, B).
Fig. 8.
Different radiological modalities compared to histological NP cross section area measurements. The measured cross section area is marked red on histological sections (Alcian blue stain) in the bottom row. Increasing stages of degeneration are shown from left to right. The first column on the left shows a healthy disc. The column at the very right shows late stage degenerative changes with the NP being completely replaced by connective tissue on histological sections. There is a continuous drop in NP voxel count (middle row) parallel to the increasing degenerative changes on histological sections and conventional T2 weighted MRIs (second row from the top). The modified Pfirrmann grade increases with progressive degeneration. However, subtle degenerative changes such as those between the third and fourth column are not detected. This figure displays the capability of the NP voxel count to quantify subtle differences in IVD degeneration. The NP voxel count is well correlated with the histological NP cross section area. On X-rays, only the severely collapsed disc space correlated with the NP voxel count and the progressed degenerative changes on the histological section.
Fig. 6.
A,B,D; Correlation between various parameters for measuring disc degeneration. The histological NP cross section was only measured once for each specimen. All other parameters were measured twice, at the one and three month time points. (A) Comparison of the histological NP cross-sectional area and the NP voxel count of all punctured specimens. The parameters showed a strong correlation (p<0.0001). (B) Voxel count compared to the Pfirrmann grade in all punctured animals. Both parameters correlated (p<0.0001). Each grade showed a wide range of T2-values. There is an overlap of voxel counts between different grades. (C) Disc height measurements. All groups show an initial drop with an increase between month one and three. Even severely degenerated discs, as in the open puncture group, had a mean disc height of over 50% of the prepuncture state. (D) Comparison of the voxel count and disc height measurements. The parameters only showed a moderate correlation (p<0.0006). Specimen with low NP voxel count values displayed a large amount of variation in disc height.
Disc height measurements
The disc height decreased in all punctured groups one month after needle puncture. However, every group partially recovered disc height between months one and three (Fig. 6, C). There was only moderate correlation between disc height measurements and the voxel count (R2=0.43, p<0.0006) (Fig. 6, D).
Discussion
The condition of the nucleus pulposus reflects the overall health of the disc as well as that of the adjacent bone and joint structures of the spinal segment. Loss of NP tissue in needle-punctured discs is the initial step in a cascade of degenerative changes eventually leading to severe structural and biochemical alterations to the IVD.[3-6]
Quantitative MRI assessment of disc degeneration
MRI-based RT measurements are independent of scanner or imaging parameters; rather, they reflect intrinsic tissue properties, which allows for the study of tissue composition and subsequent changes in pathological conditions.[8]
T1ρ-RT measurements have been demonstrated to correlate strongly with IVD proteoglycan content and moderately with water content.[7, 9] T1ρ-RT measurements have also correlated with water:proteoglycan ratio analysis using MR spectroscopy imaging.[27] T2-RT has been shown to strongly correlate with NP water content and moderately with proteoglycan content.[10]
Several studies investigated the T2-RT of degenerated IVDs in animal models as well as in humans.[10-14, 25] Niinimaki et al. punctured porcine IVDs to induce a degenerative process and reported a 22% decrease in NP T2 values over four weeks.[13] In contrast, our results indicate that the mean NP T2-RT does not significantly decrease in punctured, degenerated discs and remains constant over three months. These conflicting results may arise from the different methods applied in our measurements. Subtracting voxels not representing NP tissue allowed us to analyze the nucleus more specifically by filtering out surrounding tissue (Fig. 7). Niinimaki used a centrally placed standard oval ROI within the NP. The difficulty with fixed ROIs, especially in small animal degenerated IVDs, is that the degenerating NP becomes smaller and changes its shape (Fig. 8). This can lead to infiltration of the ROI with tissue possessing lower innate T2 values consequently lowering the mean T2-RT of the ROI.
Mean NP T2-RT in human discs has been reported to decrease with progressive degeneration.[12, 14] Most study groups segmented the NP from the surrounding tissue by manually drawing a ROI around the nucleus and subsequently measuring the mean T2-RT of that ROI.[10, 12, 14, 25] A potential disadvantage of this technique results from the difficulty in delineating the nucleus from the surrounding tissue based purely on morphological MRI features. We segmented the NP based on its inherent T2-RT. The unique composition of the IVD with different tissue types each representing specific T2 values facilitated this method.
Based on our measurements, we conclude that the mean T2-RT of the NP does not significantly decrease in needle-punctured discs. Rather, the nucleus is being replaced by degenerative tissue with lower T2 values. This is supported by merging MRI color maps with the actual histology (Fig. 7). Whether these results apply to degenerated discs in humans has yet to be investigated. Disc degeneration in humans is a prolonged process that leads to biochemical changes over time[5, 6] that could affect the NP composition and, consequently, its T2 values. In contrast, puncturing IVDs artificially induces a degeneration process primarily caused by extrusion of the NP through the defect (Fig 3). Niinimaki's study reported a negligible change in NP water concentration between healthy and punctured porcine discs (93% to 90%). This supports our hypothesis that NP hydration, which is proportional to NP T2-RT, does not change significantly in punctured animal models.
NP voxel count as a parameter of disc degeneration
The mid-sectional NP voxel count appears to be a more practical quantitative parameter to measure puncture-induced disc degeneration. Using this parameter allowed us to establish an objective continuous scale in rat-tail models ranging from 160 voxels in healthy discs to 0 voxels in severely degenerated IVDs.
The voxel count correlated with the corresponding histological NP cross-sectional area (Fig. 6, A), with the morphological changes according to the modified Pfirrmann grading system (Fig. 6, B) and with histological changes according to the Han grade. This suggests that in this model, the overall health of the disc can be extrapolated from the voxel count value.
All punctured groups experienced drops in NP voxel count between months one and three by a mean of 49%; whereas, only 1/3 of these animals dropped by one grade on the modified Pfirrmann scale. These results illustrate that voxel count has the sensitivity to capture subtle degenerative changes compared to qualitative grading (Fig. 8).
Disc height measurements only moderately correlated with NP voxel count (Fig. , D). Some severely degenerated discs showed disc height values of about 60% to 70% when compared to their healthy prepuncture state. This is likely explained by the replacement of NP tissue with connective tissue during the degeneration process that partially compensated for the loss of disc height.
The greater loss of NP tissue in the open puncture group could have resulted from two mechanisms. First, there is a possibility that percutaneous procedures resulted is less severe annular injury as the needle penetration depth is not as controllable as in open procedures. Second, open puncture procedures required complete resection of the posterior paravertebral muscles to expose the AF. This resulted into a large tissue defect around the puncture site which might have facilitated the extrusion of disc material.
Conclusion
We describe in a rat-tail puncture model of disc degeneration how the NP can be segmented from other components of the IVD by its inherent T2-RT. The NP voxel count is a new unit that allows for the measurement of the NP size and aids in the assessment of IVD degeneration. In contrast, the NP T2-RT does not change significantly in needle-punctured degenerated IVDs and therefore did not prove to be a valid parameter in that regard. Whether these T2-RT results also apply to other degeneration models and human degenerated discs requires further investigation.
Introduction of a new algorithm based on T2-relaxation time measurements to assess intervertebral discs degeneration. This method allowed us to quantify the size of the Nucleus Pulposus by the amount of MRI voxels it is composed of and its hydration via average T2- relaxation time measurements.
Nuclear voxel count proved to be an objective and sensitive parameter to assess disc degeneration in a needle puncture rat-tail model. This parameter correlated to other established radiological and histological assessments. Average T2-RT measurements were not useful to characterize disc degeneration, as the values did not significantly change in degenerated discs.
The described technique can be used as a standard assessment method to compare disc degeneration and regeneration outcomes between different study groups.
Acknowledgments
We would like to thank Jonathan Dyke PhD and Henning Voss PhD from the Weill Cornell Citigroup Biomedical Imaging Center for their support in analyzing the MRI data. We also would like to thank Stephen Doty PhD from the Hospital of Special Surgery for his help interpreting the histological sections. In addition we would like to thank Sara Towne for her support to write this paper.
References
- 1.Hiyama A, et al. Transplantation of mesenchymal stem cells in a canine disc degeneration model. J Orthop Res. 2008;26(5):589–600. doi: 10.1002/jor.20584. [DOI] [PubMed] [Google Scholar]
- 2.Sakai D, et al. Regenerative effects of transplanting mesenchymal stem cells embedded in atelocollagen to the degenerated intervertebral disc. Biomaterials. 2006;27(3):335–45. doi: 10.1016/j.biomaterials.2005.06.038. [DOI] [PubMed] [Google Scholar]
- 3.Battie MC, Videman T. Lumbar disc degeneration: epidemiology and genetics. J Bone Joint Surg Am. 2006;88(Suppl 2):3–9. doi: 10.2106/JBJS.E.01313. [DOI] [PubMed] [Google Scholar]
- 4.Hadjipavlou AG, et al. The pathophysiology of disc degeneration: a critical review. J Bone Joint Surg Br. 2008;90(10):1261–70. doi: 10.1302/0301-620X.90B10.20910. [DOI] [PubMed] [Google Scholar]
- 5.Kraemer J. Intervertebral Disk Diseases. 3rd ed. Thieme; Stuttgart: 2009. [Google Scholar]
- 6.Urban JP, Roberts S. Degeneration of the intervertebral disc. Arthritis Res Ther. 2003;5(3):120–30. doi: 10.1186/ar629. [DOI] [PMC free article] [PubMed] [Google Scholar]
- 7.Johannessen W, et al. Assessment of human disc degeneration and proteoglycan content using T1rho-weighted magnetic resonance imaging. Spine (Phila Pa 1976) 2006;31(11):1253–7. doi: 10.1097/01.brs.0000217708.54880.51. [DOI] [PMC free article] [PubMed] [Google Scholar]
- 8.Mwale F, Iatridis JC, Antoniou J. Quantitative MRI as a diagnostic tool of intervertebral disc matrix composition and integrity. European spine journal : official publication of the European Spine Society, the European Spinal Deformity Society, and the European Section of the Cervical Spine Research Society. 2008;17(Suppl 4):432–40. doi: 10.1007/s00586-008-0744-4. [DOI] [PMC free article] [PubMed] [Google Scholar]
- 9.Nguyen AM, et al. Noninvasive quantification of human nucleus pulposus pressure with use of T1rho-weighted magnetic resonance imaging. J Bone Joint Surg Am. 2008;90(4):796–802. doi: 10.2106/JBJS.G.00667. [DOI] [PMC free article] [PubMed] [Google Scholar]
- 10.Marinelli NL, et al. T2 relaxation times of intervertebral disc tissue correlated with water content and proteoglycan content. Spine (Phila Pa 1976) 2009;34(5):520–4. doi: 10.1097/BRS.0b013e318195dd44. [DOI] [PubMed] [Google Scholar]
- 11.Jazini E, et al. Alterations in T2 relaxation magnetic resonance imaging of the ovine intervertebral disc due to nonenzymatic glycation. Spine (Phila Pa 1976) 2012;37(4):E209–15. doi: 10.1097/BRS.0b013e31822ce81f. [DOI] [PMC free article] [PubMed] [Google Scholar]
- 12.Takashima H, et al. Correlation between T2 relaxation time and intervertebral disk degeneration. Skeletal radiology. 2012;41(2):163–7. doi: 10.1007/s00256-011-1144-0. [DOI] [PubMed] [Google Scholar]
- 13.Niinimaki J, et al. Quantitative magnetic resonance imaging of experimentally injured porcine intervertebral disc. Acta Radiol. 2007;48(6):643–9. doi: 10.1080/02841850701326933. [DOI] [PubMed] [Google Scholar]
- 14.Wang YX, et al. T1rho and T2 relaxation times for lumbar disc degeneration: an in vivo comparative study at 3.0-Tesla MRI. Eur Radiol. 2013;23(1):228–34. doi: 10.1007/s00330-012-2591-2. [DOI] [PubMed] [Google Scholar]
- 15.Han B, et al. A simple disc degeneration model induced by percutaneous needle puncture in the rat tail. Spine (Phila Pa 1976) 2008;33(18):1925–34. doi: 10.1097/BRS.0b013e31817c64a9. [DOI] [PubMed] [Google Scholar]
- 16.Keorochana G, et al. The effect of needle size inducing degeneration in the rat caudal disc: evaluation using radiograph, magnetic resonance imaging, histology, and immunohistochemistry. Spine J. 2010;10(11):1014–23. doi: 10.1016/j.spinee.2010.08.013. [DOI] [PubMed] [Google Scholar]
- 17.Issy AC, et al. Experimental model of intervertebral disc degeneration by needle puncture in Wistar rats. Braz J Med Biol Res. 2013;46(3):235–44. doi: 10.1590/1414-431X20122429. [DOI] [PMC free article] [PubMed] [Google Scholar]
- 18.Zhang H, et al. Developing consistently reproducible intervertebral disc degeneration at rat caudal spine by using needle puncture. J Neurosurg Spine. 2009;10(6):522–30. doi: 10.3171/2009.2.SPINE08925. [DOI] [PubMed] [Google Scholar]
- 19.Lu DS, et al. Effects of chondroitinase ABC and chymopapain on spinal motion segment biomechanics. An in vivo biomechanical, radiologic, and histologic canine study. Spine (Phila Pa 1976) 1997;22(16):1828–34. doi: 10.1097/00007632-199708150-00006. discussion 1834-5. [DOI] [PubMed] [Google Scholar]
- 20.Yu LP, et al. MRI assessment of lumbar intervertebral disc degeneration with lumbar degenerative disease using the pfirrmann grading systems. PLoS One. 2012;7(12):e48074. doi: 10.1371/journal.pone.0048074. [DOI] [PMC free article] [PubMed] [Google Scholar]
- 21.Dendukuri N, Reinhold C. Correlation and regression. AJR Am J Roentgenol. 2005;185(1):3–18. doi: 10.2214/ajr.185.1.01850003. [DOI] [PubMed] [Google Scholar]
- 22.Bird P, et al. OMERACT Rheumatoid Arthritis Magnetic Resonance Imaging Studies. Exercise 5: an international multicenter reliability study using computerized MRI erosion volume measurements. J Rheumatol. 2003;30(6):1380–4. [PubMed] [Google Scholar]
- 23.Zhang H, et al. Time course investigation of intervertebral disc degeneration produced by needle-stab injury of the rat caudal spine: laboratory investigation. J Neurosurg Spine. 2011;15(4):404–13. doi: 10.3171/2011.5.SPINE10811. [DOI] [PubMed] [Google Scholar]
- 24.Sobajima S, et al. A slowly progressive and reproducible animal model of intervertebral disc degeneration characterized by MRI, X-ray, and histology. Spine (Phila Pa 1976) 2005;30(1):15–24. doi: 10.1097/01.brs.0000148048.15348.9b. [DOI] [PubMed] [Google Scholar]
- 25.Marinelli NL, Haughton VM, Anderson PA. T2 relaxation times correlated with stage of lumbar intervertebral disk degeneration and patient age. AJNR Am J Neuroradiol. 2010;31(7):1278–82. doi: 10.3174/ajnr.A2080. [DOI] [PMC free article] [PubMed] [Google Scholar]
- 26.Borde BH, James AR, Härtl R, et al. Repair of Defects in the Rat Tail Annulus Fibrosus Using Injectable High Density Collagen Gels.. Orthopedic Research Society, ANNUAL MEETING 2012; San Francisco, CA. 2012. [Google Scholar]
- 27.Zuo J, Joseph GB, Li X, Link TM, Hu SS, Berven SH, Kurhanewitz J, Majumdar S. In vivo intervertebral disc characterization using magnetic resonance spectroscopy and T1ρ imaging: association with discography and Oswestry Disability Index and Short Form-36 Health Survey. Spine (Phila Pa 1976) 2012;37(3):214–21. doi: 10.1097/BRS.0b013e3182294a63. [DOI] [PMC free article] [PubMed] [Google Scholar]


