

Abstract
This paper reports a simple and rapid method for simultaneous determination of the residues of selected herbicides viz. pendimethalin, oxyfluorfen, imazethapyr and quizalofop-p-ethyl in peanut by liquid chromatography-tandem mass spectrometry (LC-MS/MS). A modified approach of the QuEChERS methodology was used to extract the herbicides from the peanut kernel without any clean-up. The method showed excellent linearity (r2 > 0.99) with no significant matrix effect. Accuracy of the method in terms of average recoveries of all the four herbicides ranged between 69.4 –94.4 % at spiking levels of 0.05, 0.10 and 0.25 mg kg−1 with intra-day and inter-day precision RSD (%) between 2.6–16.6 and 8.0–11.3, respectively. Limit of quantification (LOQs) was 5.0 μg kg−1 for pendimethalin, imazethapyr and quizalofop-p-ethyl and 10.0 μg kg−1 for oxyfluorfen. The expanded uncertainties were <11 % for determination of these herbicides in peanut. The proposed method was successfully applied for analysis of these herbicide residues in peanut samples harvested from the experimental field and the residues were below the detection level.
Keywords: Peanut, Herbicides, LC-MS/MS, Safety evaluation, Modified QuEChERS
Introduction
Peanut (Arachis hypogaea L.) is an important crop in India and worldwide, which is mostly grown and used for oil production. But there is a shift in consumption pattern of peanut as oil. In 1980s, almost 80 % peanut produced in India was used for oil expulsion (Reddy, 1988), but currently, only about 49 % of the produce is being crushed for oil and rest used for direct consumption and export (Govindaraj and Jain, 2012). The consumption of raw peanut has recently increased and it has attracted attention as a functional food for good health as evidenced by numerous beneficial components found in it (Francisco and Resurreccion, 2008). Peanut is mainly grown in semi-arid regions and in India; Gujarat is the main producing state. Among the different constraints that limit the productivity of peanut in India, weed menace is one of the serious bottlenecks as peanut is confronted with repeated flushes of various grassy and broad-leaved weeds throughout its growing season (Jat et al. 2011). Pendimethalin and oxyfluorfen are two herbicides, mainly used for pre-emergence weed control in peanut cultivation whereas imazethapyr and quizalofop-p-ethyl are used to control post-emergence weeds (Jat et al. 2011). Alternate application of these different pre-emergence and post-emergence herbicides could lead to apprehensions of accumulation of their residues together in kernel at harvest. As the consumption of peanut as a functional food is increasing and being a traded commodity, monitoring of pesticide residue levels is very important to maintain quality and to ensure food safety. In order to ensure consumer safety, the USA has set up Maximum Residue Limit (MRL) of pendimethalin and imazethapyr as 0.1 mg kg−1 and 0.1 mg kg−1, respectively in peanut kernel (FAS International Maximun Residue Level Database 2013). In European Union (EU), MRL has also been established for pendimethalin (0.1 mg kg−1), oxyfluorfen (0.05 mg kg−1) and quizalofop-p-ethyl (0.1 mg kg−1) in peanut kernel (EU Database on MRLs 2013). While in India, the MRL for oxyfluorfen (0.05 mg kg−1) and imazethapyr (0.1 mg kg−1) has been established only in peanut oil (Food Safety and Standards Authority of India, 2011). Analysis pesticide residue in peanut matrices is often counted as a challenging task due to its high fat and low moisture content. Therefore, it is necessary to develop a suitable method for simultaneous analysis of these commonly used herbicides in peanut and test their residues at harvest (in field studies) to ensure that if it can meet the MRLs regulations.
Different chromatographic methods, such as liquid chromatography (LC) (Maldaner et al. 2008; Sondhia, 2010; Shah et al. 2011), capillary electrophoresis (Han et al. 2008), gas chromatography (GC) (Engebretson et al. 2001; Fenoll et al. 2008; Hu et al. 2010) and enzyme-linked immunoassay (Steinheimer and Scoggin, 1998; Zeng et al. 2006) have been used till date for the determination of these herbicide residues in different matrices. In comparison with conventional techniques of GC and LC, LC hyphenated with tandem mass spectrometry (LC–MS/MS) is a prevailing technique in pesticide residues analysis, as the number of polar and non-GC-amenable pesticides used in oilseeds is increasing. In this study among the four herbicides used, pendimethalin (logKow = 5.18), oxyfluorfen (logKow = 4.47) and quizalofop-p-ethyl (logKow = 4.2) are relatively non-polar in nature, whereas imazethapyr is of intermediate polarity (logKow = 1.04 to 1.49 depending on the pH). LC-MS/MS allows the rapid and efficient determination of many compounds that have hardly been investigated in foods till date, or determined with some difficulties by using laborious and time-consuming GC or conventional LC procedures. Advanced LC-MS/MS techniques, employing atmospheric pressure ionization such as electrospray ionization (ESI) (Hernandez et al. 2006; Wong et al. 2010; Bletsou et al. 2013) and atmospheric pressure chemical ionization (APCI) (Bonmatin et al. 2003; Botitsi et al. 2011) provide an improved sensitivity and selectivity as compared with the classical detectors.
Before carrying out the chromatographic analysis of samples, pre-treatment and pre-concentration are important steps for ultratrace analysis. The widely used methods for extraction and cleanup of pesticides for high fatty matrix samples like peanut rely on conventional method like liquid–liquid extraction (LLE) (Newsome et al. 2000) or advanced extraction method like solid- phase extraction (SPE) (Wang, 2006), low-temperature purification (LLP) (Li et al. 2007a) and gel-permeation chromatography (GPC) (Wang et al. 2009) Although these classical methods mentioned above yield precise results, but they are tedious, time-consuming, hazardous to health due to the usage of high amounts of organic solvents, and expensive with respect to the disposal of solvents, incurring consequent costs to the customer. Finally, the analytical methods exploiting these strategies cannot be considered green and are not in agreement with the actual tendency to develop green analytical methods
Recently, modern analytical chemistry seeks to develop the so-called procedures of green chemistry, involving small amount of samples and reagents, easy operation and simple analytical laboratory equipment, while the analytical reagents and chemicals are harmless to health and environment (Tobiszewski et al. 2009; Kaljurand and Koel, 2011; Stocka et al. 2011). In recent years, QuEChERS (quick, easy, cheap, rugged, effective and safe) sample preparation approach (Anastassiades et al. 2003), has been emerged as the most universal sample preparation method and this extraction technique is gaining popularity due to simplicity, use of minimal volumes of non-chlorinated organic solvents which, in the era of green chemistry (Pinto et al. 2011; Ferreira et al. 2014; Sadowska-Rociek et al. 2014). It has applicability to a wide range of organic contaminants including pesticides (Wilkowska and Biziuk, 2011) of differing polarities, volatilities and matrices; this extraction technique has been successfully used for the extraction of pesticides from fatty matrices, such as olives (Cunha et al. 2007), palm oil (Sobhanzadeh et al. 2012), milk, egg, and avocado (Lehotay et al. 2005) and rapeseed (Jiang et al. 2012). Many modifications and studies on QuEChERS method have been published and one of its important modifications includes use of additional water to obtain necessary moisture for better recovery in case of dry samples (Koesukwiwat et al. 2008; Mastovska et al. 2010).
Concerning the analysis of pesticide residues in peanut, there are only few works in the published (Li et al. 2007a; Cortes et al. 2008; Wang et al. 2009). In most cases, studies have been carried out only for insecticides or more particular group of insecticides like organophosphorous (OPs) (Li et al. 2007b, Su et al. 2011), whereas methods are mostly available to determine pesticide residues in peanut oil and only few studies reported in raw peanut. However, no study including the simultaneous analysis of selected herbicides in peanut using QuEChERS is found in literature to the best of our knowledge. Furthermore, there is growing awareness and concern that some toxicologically significant residues remaining on or in the harvested crop could be consumed as food or feedstock. But, a specific study on the safety of selected herbicides in peanut has not been carried out until now. This paper reports a multi-residue method for simultaneous determination of pendimethalin, oxyfluorfen, imazethapyr and quizalofop-p-ethyl in peanut kernels. Peanut samples were submitted to a modified QuEChERS extraction without clean-up procedure and sequentially submitted to a selective and sensitive LC-MS/MS analysis. The developed method was also successfully employed for determination of terminal residue of these herbicides in peanuts grown in an experimental field with various treatments to evaluate their safe use.
Materials and methods
Reagents and chemicals
The certified reference standards of pendimethalin (98.8 %), oxyfluorfen (99.9 %), imazethapyr (99.9 %), quizalofop-p-ethyl (98.6 %) were purchased from Sigma Aldrich, Germany. Primary secondary amine (PSA, 40 μm, Bondesil), C18 and florisil sorbents were procured from United Chemical Technology (Bristol, PA, USA). Methanol and acetonitrile solvents were of residue analysis grade and purchased from Thomas Baker (Mumbai, India). The other reagents namely anhydrous magnesium sulphate (MgSO4) and sodium chloride (NaCl) were of analytical reagent grade and purchased from Merck India Ltd. (Mumbai, India). To ensure efficient removal of residual water, MgSO4 was activated by heating at 650 °C for 4 h before use and stored in desiccators. Ammonium formate and formic acid of required purity were purchased from Thomas Baker (Mumbai, India) and HPLC-grade water (≤18 ΩMcm) was obtained through a Sartorius (Göttingen, Germany) water purification system.
Preparation of standard working solutions
Individual pesticide stock solutions containing 1 000 μg mL−1 of the target herbicides were prepared by dissolving 10 (±0.1) mg reference standards in 10 mL of methanol and stored at −20 °C. Intermediate stock standard mixture in methanol containing 10 μg mL−1 of each compound was prepared by mixing appropriate quantities of the individual stock solutions. A working standard mixture of 1 μg mL−1 was prepared from the above stock standard by serial dilution, which was used for spiking and also to prepare solvent as well as matrix matched calibration curves from the herbicides in solvent and matrix.
LC-MS/MS analysis
The LC-MS/MS analysis was carried out with Agilent 1200 series HPLC coupled to an API 4000 Qtrap (AB Sciex) mass spectrometer equipped with an electrospray ionisation interface. The HPLC separation was carried out using an Atlantis dC18 column (100 mmx2.1mmx5μm) from Waters India Pvt Ltd., Bangalore. The mobile phase was composed of (A) methanol: water (20:80 v/v with 5 mM ammonium formate and 0.15 % formic acid) and (B) methanol: water (90:10 v/v with 5 mM ammonium formate); with gradient 0–0.5 min 85 % A, 0.5–7 min 85–2 % A, 7–15 min 2 % A, 15–16 min 2–85 % A and 16–20 min 85 % A. The mobile phase flow rate was 0.3 mL min−1 and column temperature was maintained at 35 °C. The source parameters included nebulizer gas 40 psi; heater gas 60 psi; ion source temperature 550 °C; ion spray voltage 5 500 V. An aliquot of 10 μL was injected with auto sampler. Analyte dependent mass parameters are given in Table 1.
Table 1.
Analyte MS-MS Transitions and LC–MS/MS conditions for the analysis of herbicides
| Herbicides | RT (min) | Q | Q1 | DP (V) | CE (V) | CXP (V) | Q2 | CE (V) | CXP (V) |
|---|---|---|---|---|---|---|---|---|---|
| Pendimethalin | 10.76 | 282.15 | 212.1 | 46 | 17 | 10 | 194 | 27 | 10 |
| Oxyfluorfen | 10.14 | 362.08 | 316.1 | 66 | 21 | 6 | 237.16 | 35 | 12 |
| Imazethapyr | 5.00 | 290 | 159 | 96 | 53 | 6 | 177 | 37 | 10 |
| Quizalfop-p-ethyl | 10.13 | 373.06 | 299 | 71 | 27 | 6 | 91 | 47 | 4 |
RT, retention time; Q, precursor ion; Q1, product ion for quantification; Q2, product ionfor confirmation, DP, declustering potential; CE, collision energy; CXP, collision cell exit potential
Extraction procedure
Approximately 200 g of peanut kernel sample spiked with the test herbicides was pre-soaked in water for 1 h (1:1 sample : water) and crushed thoroughly in a blender and a portion of 5 g (1:1, sample : water) of sample was accurately weighed in a centrifuge tube (50 mL), to which 2.5 mL water was added and the mixture was vortexed. Then10 mL acetonitrile was added and the mixture was vortexed for 1 min. Afterwards, 4 g MgSO4 and 1 g NaCl were added and the mixture was immediately hand shaken vigorously and then vortexed for 2 min. The mixture was centrifuged for 5 min at 4 000 rpm. An aliquot from the upper layer (1 mL) was again centrifuged at 10 000 rpm for 5 min and transferred into an auto-sampler vial, appropriately diluted and 10 μL extract was analysed by LC-MS/MS without any further cleanup. All experiments were performed in six replicates. Fig. 1 presents a diagram of the extraction procedures of selected herbicides in peanut by our developed method.
Fig. 1.

Schematic picture of the extraction procedure for the determination of herbicides in peanut
Method validation parameters
The performance of the analytical method was assessed as perthe single laboratory validation approach of Thompson et al. (2002)
Calibration curves and linearity
The evaluation of the calibration curves and linearity were carried out based on injections of the standard solutions prepared in organic solvent and also in blank peanut extract, at the concentrations of 1, 2.5, 5, 10, 25 and 50 ng mL−1 in six replicates.
Selectivity and sensitivity
The selectivity of the method was evaluated by comparing the chromatograms obtained from fortified peanut samples with those the blank samples and sensitivity of the method was determined in terms of limit of quantification (LOQ) of the test compounds. LOQs of the method were established at the lowest fortified level of the respective herbicide in peanut matrix, with S/N ratio ≥10.
Matrix effects
Matrix effects in terms of signal suppression or enhancement due to the co-elution of matrix components were evaluated by post-extraction spiking and compared with the solvent standards. Where a matrix-matched calibration standards, which prepared by adding the extract of blank control samples, were in the range of same concentrations as the solvent standard solutions. Matrix effect was evaluated through comparison of the slopes obtained in the calibration with matrix matched standards with those obtained with calibration with standards diluted in the solvent (n = 6). Higher and lower slopes of the matrix calibration equation with reference to the solvent based calibration equation represent matrix induced enhancement and suppression, respectively.
Accuracy and precision of the method
The accuracy was determined as % recovery at three different fortification levels (0.05, 0.1 and 0.25 mg kg−1). Precision was evaluated in terms of repeatability at three different fortification levels, with six replicates at each level on the same day (intra-day precision), and reproducibility (inter-day precision) was calculated with six replicates at each of the three concentration levels on six different days. The numerical values of precision were expressed by relative standard deviation of six replicate measurements of the analytes, using the equation.
Measurement of uncertainty
The reproducibility of the method was assured by evaluating the measurement of uncertainty. The expanded uncertainty in the determination of the herbicides was calculated at 50 ng g−1 as per the EURACHEM/CITAC Guide CG 4 (EURACHEM/CITAC Guide 2000). Uncertainty associated with the calibration graph (U1), day-wise uncertainty associated with precision (U2), analyst-wise uncertainty associated with precision (U3), day-wise uncertainty associated with accuracy/bias (U4), and analyst-wise uncertainty associated with accuracy/bias (U5) were evaluated for all the herbicides in peanut as described by Banerjee et al., 2007 and Konieczka and Namiesnik 2010. The global uncertainty (U) was calculated as:
and reported as expanded uncertainty (2U) which is twice the value of the combined uncertainty at 95 % confidence level.
Field trial
A field experiment was conducted at the experimental farm of Directorate of Groundnut Research, Junagadh, Gujarat, from July to November, 2012 (120 days from sowing to harvesting),with an aim to study the residues of these herbicides in peanut kernel. A randomized block design was used with three replications for each treatment and plots (5.0 × 3.6 m2) were separated by ridges. The peanut variety, TG 37A was sown @ 100 kg ha−1 seed rate and at a spacing of 45 cm × 15 cm with recommended package of practices. Commercially available formulation of pendimethalin [Stomp 30EC, Rallis India Ltd., Mumbai] was applied at 500, 1 000, and 2 000 g a.i. ha−1 and oxyfluorfen (Galigen 23.5 EC, Makhteshim-Agan-India Pvt. Ltd., Mumbai) was applied at 250, 500, and 1 000 g a.i. ha−1in peanut as pre-emergence herbicide in separate plots after sowing. Both imazethapyr (Persuit SL 10, BASF India Ltd.) and quizalofop-p-ethyl (Targa Super 5 EC, Dhanuka Agritech Ltd., Mumbai) were sprayed at 25, 50 and 100 g a.i. ha-l as post-emergence herbicides in separate plots at 20 days after sowing of peanut. Three different plots were maintained as weed free (only manual weeding) with absolutely no application of these herbicides.
Sampling
Randomly 2.0 kg of peanut samples were collected at harvest time from the treated and untreated control plots. Immediately after collection, the samples were kept into polyethylene bags and transported to the laboratory where they were thoroughly mixed and 500 g of sub-samples obtained by quartation method, were stored at −20 °C until analysis.
Safety Evaluation
The food safety of each herbicide was evaluated by comparing their dietary exposure (theoretical maximum daily intake) vis-a-vis the maximum permissible intake (MPI). The acceptable daily intakes (ADI) for pendimethalin, oxyfluorfen, quizalofop-p-ethyl and imazethapyr are 0.125, 0.003, 0.009 (http://ec.europa.eu/sancopesticides/public/index.cfm) and 0.25 mg kg−1 body weight day−1 (http://pmep.cce.cornell.edu/profiles/extoxnet/haloxyfop-methylparathion/imazethapyr-ext.html), respectively. Multiplying the ADI by the body weight of an average child (16 kg) and an adult (60 kg), the MPIs for pendimethalin, oxyfluorfen, quizalofop-p-ethyl and imazethapyr were estimated at 2.000, 0.048, 0.144 and 4.000 mg person−1 day−1, for child whereas for an adult the corresponding values were workeout 7.5, 0.18, 0.54, 15 mg person−1 day−1. The dietary exposure was calculated by multiplying the residue levels of each herbicide in each sample (mg kg−1) with average per capita consumption of 1.83 g of peanut per day (http://mospi.nic.in/rept%20_%20pubn/461_final.pdf).
Quality Control and Quality Assurance
Since the efficiency of sample processing can be significantly influenced by the actual physical conditions of the laboratory, therefore it is not sufficient to test its efficiency once at the time of method validation, rather it should be checked regularly during the application of the method by incorporating quality assurance (QA)/quality control (QC) programme (European Commission, 2011) into the analysis. To follow QA/QC programme, the instruments were calibrated daily with calibration standards of certified reference materials from Sigma Aldrich (Germany) to confirm acceptable chromatographic resolution and mass spectral sensitivity. This standard was also analyzed after substantive changes in the analytical system. Herbicides were identified by their retention times, quantified by precursor ion known as a quantifier ion and confirmed by the ratio of quantifier ions and two products ions known as qualifier ions. Blank contamination is the most common problem observed in the determination of pesticides at trace levels. Thus, precautions were taken to prevent such contamination from personnel, organic solvents, equipment and glassware. Aliquot (10 mL) of each solvent was concentrated to 2 mL and analyzed to check the contamination from the reagents. For every batch of 7 samples analysed, 1 solvent blank, 1 spiked blank (standards spiked into solvent), 1 matrix spike (standards spiked into the matrix matched solvent) standard were simultaneously analysed.
Results and discussion
Optimisation of MS/MS
The optimization of mass spectrometric parameters was initially performed in full scan and daughter scan using direct flow injection. The [MH] + was chosen as the precursor ion for all analytes. The estimation was performed in positive mode by multiple reactions monitoring (MRM). The first mass transition was used for quantification, while the second mass transition was used for confirmation of the residues. The ion ratio for these two mass transitions was used for unambiguous identification of each herbicides according to European Commission (EC) guidelines, 2002. The precursor ions, product ions and corresponding collision voltages during MRM acquisition are listed in Table 1.
Optimization of sample preparation method
The tests of optimization of the extraction procedure included the homogeneity test, sample weight selection to optimize the extraction efficiency and the evaluation of the different clean-up strategies for minimizing the matrix effects. Optimization procedures were performed in six replicates and the identification and quantification were carried out by LC-MS/MS.
Optimization of extraction step
Homogeneity test
Usually, the QuEChERS method is designed for samples with more than 75 % moisture content (Kolberg et al. 2011). For determining pesticide residues in food matrices of low water content or high fat content, the sample size for extraction is reduced and water added to make sample pores more accessible to the extraction solvent (Walorczyk, 2008; Pareja et al. 2011). Different trial approaches were examined in a pilot study and the efficiency of the extraction process was comparatively assessed considering the relative standard deviation (RSD) values. In approach (1), peanut samples spiked with the test herbicides mixture (0.1 mg kg−1) were soaked in distilled water (for 1 h) in a proportion of a) 1:1 sample to water ratio and b) 1:2 sample to water ratio and then homogenized thoroughly in a blender. In approach (2), dry crushing of the treated sample and adition of water (1:1) to the pre-weighed sample.
The RSDs (n = 6) for the results of homogeneity test were lowest (<8 %, Fig. 2) when the samples were processed as per approach 1a as compared to the approach 1b (7.5–15.4 %) and 2 (6.3–16.6 %). The pre-soaking of the treated sample in water (1:1 sample to water ratio) following the crushing of the treated sample facilitated satisfactory sample homogenization.
Fig. 2.

Homogeneity test for peanut kernel samples
Sample size optimization
Sample size was optimized by randomly selecting three different sizes viz. 5, 10 and 20 g sample (1:1 sample to water ratio; n = 6; spiked at 0.1 mg kg−1). The sample size of 5 g (with 1:1 sample to water ratio) was chosen as it gave good precision with RSD (%) values of 6.4, 7.9, 2.4 and 7.9 for pendimethalin, oxyfluorfen, imazethapyr and quizalfop-p-ethyl, respectively. When the sample size was increased above 5 g, the extraction efficiency was sacrificed as the extract appeared turbid due to co-extraction of higher proportion of matrix components. Though precision in analysis (RSD) was satisfactory, the recoveries were relatively low (72.5, 73.6, 64.6 and 76.2 % for pendimethalin, oxyfluorfen, imazethapyr and quizalfop-p-ethyl, respectively). To improve the extraction efficiency, water (2.5, 5 and 10 mL) was externally added to the sample mass of 5 g (1:1 water to sample). With the external addition of water (2.5 mL) the recoveries for all the analytes improved (20.2, 3.4, 8.6 and 13.4 % increment in recovery for pendimethalin, oxyfluorfen, imazethapyr and quizalfop-p-ethyl, respectively) with acceptable RSD (70.2–87.2 % ± 5.2–8.0 %; Fig. 3).
Fig. 3.

Effect of addition of water to a sample mass of 5 g (1:1 sample to water ratio; n = 6) on recovery of herbicides. Error bars indicate RSD values (%) (n = 6)
Clean-up optimization
Although fats have limited solubility in acetonitrile, a certain fraction of it from matrix may got co-extracted which interfered with the analysis of the target compounds. To minimize the fatty co-extractives different clean-up strategies were evaluated using aliquots of the extract (1.0 mL upper layer of acetonitrile extract) without and with dispersive solid phase extraction (d-SPE) clean-up. For d-SPE clean-up step, 1 ml extract was added to one tube containing 150 mg of anhydrous magnesium sulphate (to remove water) and effect of different sorbents like 50 mg of C18 or 50 mg of primary secondary amine (PSA) or 50 mg of florisil were evaluated separately and compared.
When C18 was used in clean-up stage, slightly lower recovery was recorded (reduction in recovery by 16.5, 12.1 and 6.4 % for pendimethalin, quizalofop-p-ethyl and oxyfluorfen, respectively) as compared to no-clean-up (Fig. 4). Such loss in recovery of pendimethalin, quizalofop-p-ethyl and oxyfluorfen in C18 cleanup may be due to the non-polar nature of these compounds. Gratz et al. 2011 and Johnson, 2012 reported reduced recoveries of some strongly non-polar polyaromatic hydrocarbons with C18 clean-up. There was little change in the recovery of imazethapyr (only 2.1 % increase, Fig. 4). Maldaner et al. 2008, showed that when C18 was used as a sorbent for extraction of imazethapyr, the compound had little or no retention on this sorbent.
Fig. 4.

Evaluation of the clean-up step. Error bars indicate RSD values (%) (n = 6)
Clean-up with PSA could remove fatty acids and some other polar co-extractives. When PSA was used in the clean-up step, there was slight loss in the recoveries of pendimethalin (7.0 %), quizalofop-p-ethyl (5.9 %) and little increase in recovery of oxyfuorfen (9.1 %). But remarkably low recovery (only 8.4 % with RSD < 5.4 %) was observed for imazethapyr (Fig. 4), which probably was due to the –COOH group in imazethapyr that reacts with the –NH2 group of PSA (Pareja et al. 2011). With florisil clean-up also, imazethapyr gave remarkably low recovery of 21.1 ± 12.54 %. So, the approach of using a clean-up step was discarded. Other studies in the literature support that QuEChERS procedure can also be applied without clean up steps (Madureira et al. 2012; Carneiro et al. 2013).
Method validation parameters
Linearity and calibration curve
The linearity of calibration curves was assessed over the range from 1 to 50 ng mL−1 for all target compounds with the correlation coefficients of linear functions > 0.99 (Table 2).
Table 2.
Calibration data and LOQ of the herbicides
| Herbicides | Calibration (matrix) | Calibration range (ng mL−1) | Regression equation | r2 | Slope of matrix/slope of solvent | LOQ (ng g−1) |
|---|---|---|---|---|---|---|
| Pendimethalin | Solvent | 1–50 | y = 34837x + 5925.8 | 0.9995 | - | |
| Peanut | 1–50 | y = 32247x + 2177.6 | 0.9977 | 0.926 | 5 | |
| Oxyfluorfen | Solvent | 1–50 | y = 759.3x + 2148.2 | 0.9958 | - | |
| Peanut | 1–50 | y = 714.71x + 2303.7 | 0.9911 | 0.949 | 10 | |
| Imazethapyr | Solvent | 1–50 | y = 4649.6x + 167.95 | 0.9977 | - | |
| Peanut | 1–50 | y = 4746.8x - 395.85 | 0.9996 | 1.02 | 5 | |
| Quizalofop-p-ethyl | Solvent | 1–50 | y = 90835x + 53824 | 0.9996 | - | |
| Peanut | 1–50 | y = 79496x +121863 | 0.9967 | 0.875 | 5 |
Selectivity and sensitivity of the method
The selectivity of the method was evaluated by comparing the chromatograms obtained from fortified peanut samples with those of blank samples. In the chromatogram obtained for blank sample, no peaks were recorded at the retention times of the four target analytes. Moreover, the chromatograms of the fortified sample extracts presented satisfactory chromatographic resolution for all the analytes (Fig. 5). The LOQ values obtained were 5 ng g−1 for all the herbicides except for oxyfluorfen, which had an LOQ of 10 ng g−1 (Table 2). Thus, MRLs required by the European and international regulations for the selected compounds could be complied without any difficulty.
Fig. 5.
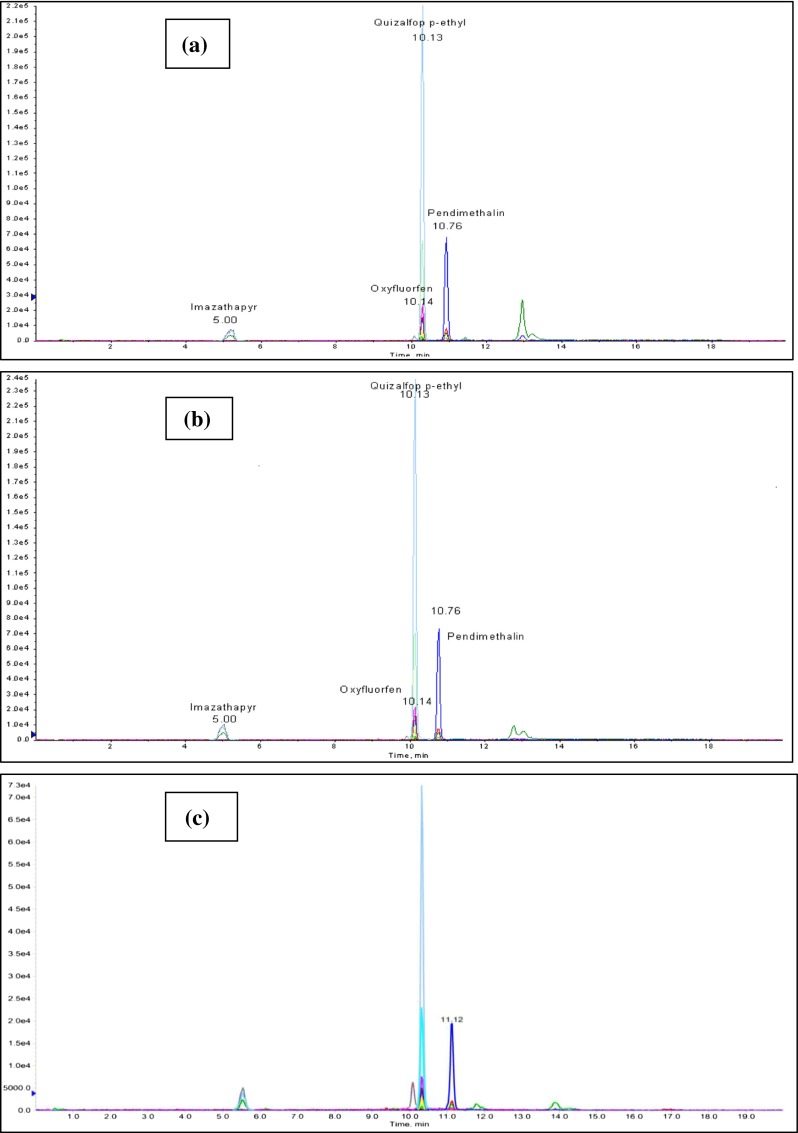
LC-MS/MS chromatograms of a Solvent standard of herbicides, b Matrix standard of herbicides c spiked peanuts sample
Matrix effect
Matrix effect is assessed either as suppression or enhancement in signal, which results in poor analytical accuracy, linearity and reproducibility compared to those produced by solvent standards of the target analytes (Romero-Gonzalez et al. 2011). There was no significant suppression or enhancement observed for the four analytes as evidenced by the slope ratios (ratio of the slope of the matrix calibration equation with reference to the solvent based calibration equation), the values were within 13 % variation in the range between 0.87–1.0 (Table 2) with satisfactory linearity (r2 > 0.99) of the calibration curves.
In the actual QuEChERS method by Anastassiades et al. 2003 and QuEChERS method used by other authors for pesticides determination in fatty matrix (Cunha et al. 2007; Sobhanzadeh et al. 2012) the procedure used 1 g sample mL−1 extract. But in this method, it was 0.25 g sample mL−1 extract. Consequently, there were less interference in the chromatogram and hence no requirement of clean-up was felt. Kmellar et al. (2008) have reported that mild signal suppression and enhancement effect when the matrix effect between −20 % and 0 % and between 0 % and +20 %. The results showed that after the sample treatment was performed, the calculated matrix effects were between 0 to −8 % for pendimethalin, oxyfluofen and imazethapyr. However little bit higher matrix suppression (−13 %) was found for quizalofop-p-ethyl. On the other hand Thompson et al. 2002 and Franco and Marchi, 2013 reported that a result above 10 % is considered to indicate the existence of a matrix effect, which may influence the quantitative analysis on the sample. To avoid confusion, calibration was performed in this study with external matrix-matched standards to obtain accurate results.
Accuracy-recovery and precision of the method
Once the extraction procedure had been optimized, accuracy-recovery and precision of the method was assessed. Recovery data were calculated by comparison with the appropriate matrix-matched standard solutions. Recovery of each compound was determined in six replicate measurements at three concentration levels (0.05, 0.1 and 0.25 mg kg−1). Lowest concentrations were selected at or below the MRLs. Other two concentrations were two times and five times the lowest concentration levels. The recovery rates were in the range of 83.3–91.4, 76.1–94.4, 69.4–73.5 and 81.3–88.0 % for pendimethalin, oxyfluorfen, imazethapyr and quizalofop-p-ethyl, respectively at different fortification levels (Table 3). Relatively lower recovery was found for imazethapyr which might be due to its higher water solubility (1 400 mg L−1).
Table 3.
Recoveries of herbicides from the peanut samples spiked at different concentration level
| Herbicides | Spiked level (mg kg−1) | ||||||||
|---|---|---|---|---|---|---|---|---|---|
| 0.05 | 0.1 | 0.25 | |||||||
| Recovery (%) | RSDr | RSDR | Recovery (%) | RSDr | RSDR | Recovery (%) | RSDr | RSDR | |
| Pendimethalin | 83.3 | 8.6 | 9.0 | 86.9 | 7.9 | 8.9 | 91.4 | 9.4 | 9.5 |
| 4.1 | 6.0 | 3.9 | |||||||
| 5.7 | 2.6 | 3.3 | |||||||
| 10.8 | 8.1 | 10.9 | |||||||
| 5.6 | 2.7 | 3.3 | |||||||
| 12.2 | 8.4 | 13.0 | |||||||
| Oxyfluorfen | 78.9 | 10.8 | 11.3 | 76.1 | 6.5 | 10.8 | 94.4 | 15.4 | 9.3 |
| 11.0 | 7.0 | 7.3 | |||||||
| 8.3 | 12.7 | 7.6 | |||||||
| 10.4 | 4.4 | 5.5 | |||||||
| 9.7 | 13.8 | 7.6 | |||||||
| 11.2 | 9.4 | 8.1 | |||||||
| Imazethapyr | 73.5 | 5.8 | 10.5 | 70.2 | 6.3 | 8.0 | 69.4 | 11.9 | 10.5 |
| 7.9 | 2.7 | 9.6 | |||||||
| 8.2 | 9.4 | 8.4 | |||||||
| 8.8 | 11.3 | 2.9 | |||||||
| 8.3 | 9.5 | 8.4 | |||||||
| 8.7 | 7.2 | 9.9 | |||||||
| Quizalofop-p-ethyl | 81.3 | 8.5 | 9.2 | 86.4 | 5.2 | 8.4 | 88.0 | 11.9 | 8.9 |
| 4.3 | 7.1 | 7.4 | |||||||
| 6.4 | 3.6 | 2.9 | |||||||
| 8.6 | 4.8 | 9.2 | |||||||
| 6.5 | 3.7 | 2.9 | |||||||
| 10.0 | 16.6 | 4.8 | |||||||
Recovery (n = 6); RSDr (n = 6); RSDR (n = 36) s
The precision of the method was determined by repeatability and reproducibility studies, expressed by RSD. The repeatability RSDr (intra-day precision) was measured by comparing standard deviation of the recovery percentages of spiked peanut samples run on the same day. The reproducibility RSDR (as inter-day precision) was determined by analysing spiked peanut samples for six alternate days. Replicate (n = 6 for each concentration level) samples were run and the RSD value was calculated for each herbicide. The method was found to be precise (RSDr and RSDR <20 %) for each compound at all the spiking levels (Table 3).
Assessment of Uncertainty of anlysis
The level of uncertainty associated to the residue measurements was evaluated to check the performance of the method in terms of accuracy and ruggedness. The total uncertainty was evaluated assuming all the contributions independent of each other. A coverage factor of 2 was decided to evaluate the expanded uncertainty at a confidence level of 95 %. The uncertainties associated with calibration were below 3.5 % for the test compounds (Table 4). The uncertainties associated to precisions were up to 2.5 % both on a day-to-day basis as well as on a analyst-to-analyst basis for all the four compounds (Table 4). Furthermore, the uncertainties associated with accuracy were below 2.0 % (Table 4). The expanded uncertainties for pendimethalin, oxtfluorfen, imazethapyr and quizalofop-p-ethyl at 50 ng g−1 were 7.76, 10.28, 7.94 and 7.36, respectively and representing ruggedness of the method. Comparatively higher level of uncertainty was noted for oxyfluorfen (10.28 %) which could be due to the higher detection limit. Imazethapyr also shows little higher values which could be due to the unstable nature of the compounds.
Table 4.
Results of individual and global uncertainties for each herbicides
| Herbicides | Calibration curve | Precision | Bias | aGlobal uncertainty | aExpanded uncertainty | ||
|---|---|---|---|---|---|---|---|
| U1 | U2 | U3 | U4 | U5 | (U) | (2U) | |
| Pendimethalin | 1.2 | 2.44 | 1.5 | 1.99 | 1.2 | 3.88 | 7.76 |
| Oxyfluorfen | 3.45 | 2.32 | 1.89 | 1.82 | 1.51 | 5.14 | 10.28 |
| Imazethapyr | 2.52 | 1.83 | 1.75 | 1.28 | 1.16 | 3.97 | 7.94 |
| Quizalofop-p-ethyl | 1.05 | 2.31 | 1.54 | 1.79 | 1.23 | 3.68 | 7.36 |
aUncertainty components (expressed as relative measures, calculated at 50 ng g−1)
Comparison of the proposed method with other methodologies
The analytical characteristics of the proposed method in combination with LC-MS/MS for the determination of selected herbicides in peanut were compared with other previously published methods for analysis of different pesticides in peanut or the studied herbicides in peanut and different fatty matrix similar to peanut (Table 5). Traditional liquid–liquid extraction (LLE) (Li et al. 2007b) or followed by low temperature purification (LLE-LTP) (Li et al. 2007a; Koesukwiwat et al. 2010) or solid phase extraction (LLE-SPE) (Zhou and Zhang, 2009) are generally labourious and time-consuming procedures while large volumes of organic solvents are usually required. Although that SPE considered as the technique of choice in many laboratories for fatty matrix, require additional establishment set-up and consumables that increased the whole operational cost and difficult to be used with nut samples because any sample should be in a homogeneous liquid state before addition to an SPE column or disk device. Special instrumentation is also required for GPC while several pre-treatment steps are typically required on bench (Sanchez et al., 2006; Wang et al. 2009). Matrix solid phase dispersion (MSPD) offers high sensitivity only if exhaustive extraction is applied (Maldaner et al. 2008). So, QuEChERS based extraction found to be universal extraction method with minimizing the problems encountered in LLE, LLE-LLP, LLE-SPE, MSPD and LLE-GPC method, non-sophisticated equipment needs for sample preparation, with a low cost per sample. The studied herbicides has been successfully extracted from other fatty matrix like rapeseed (Guan and Zhang, 2012) and sunflower seed (Mantzos et al. 2013) by using QuEChERS method and the results obtained by the method we have proposed in the present study are comparable with them.
Table 5.
Comparison of the developed QuEChERS method with other methods for the determination of pesticides in peanut and similar matrices
| Type of pesticides | Matrix | Sample preparation step | Sample Size | Sample preparation time | Solvent requirement | Method of analysis | Percent recovery (RSD) | LOQ (ppb) | References |
|---|---|---|---|---|---|---|---|---|---|
| 16 Organophosphorus (OPs) pesticides | Peanut oil | LLE and LLP | 5gm | Extraction time: 5 mins, LLP: Overnight | 10 mL ACN | GC-ECD | 69.1-106.1 (1.8-12.7) | 6-17 | Li et al. 2007b |
| 38 pesticides of different groups | Raw Peanut | LLE-GPC | 8 gm | Not available | 40 mL ACN | GC/MS | 69-109 (2.2-26.7) | 5-20 | Wang et al. 2009 |
| 33 pesticides of different group | Peanut oil | Liquid partitioning with acetonitrile (ACN). LLP clean-up, and final clean-up with dispersive solid phase extraction | 5gm | Extraction time: 5 minute,, LLP:overnight | 10 mL ACN | GC/MS | 70-110 (<20) | 2-27 | Li et al. 2007a |
| 10 OPs | Peanut | On-line coupling of RP-HPLC and GC | 2.5 gm | Extraction time: 5 minute followed by On-line LC-GC | 5 mL Ethyl acetate | GC | Not available | 1.6-50.2 | Cortes et al. 2008 |
| Oxyfluorfen | Peanut (with shell in 34 pesticides) | Liquid partitioning with ACN. LLP clean-up, and final clean-up with dispersive solid phase extraction | 2.5 gm | 1-2 hr | 10 mL ACN | GC-TOF | 94 (8) | Notavailable | Koesukwiwat et al. 2010 |
| Olive oil (in 26 pesticides) | Liquid partitioning with ACN/hexane and clean-up by GPC | 2 gm | 1 hr for extraction and then time required for GPC clean up | 2 mL hexane and 10 mL ACN | GC-MS/MS | 95-109 (3–4) | 1.5 | Sanchez et al. 2006 | |
| Sunflower seed (in 5 pesticides) | QuEChERS (liquid partitioning with acetonitrile followed by a clean-up step based on dispersive solid-phase extraction with) | 10 gm | 15 mins | 10 mL ACN | GC-MS/MS | 25-77 (3–20) | 4 | Mantzos et al. 2013 | |
| Imazethapyr | Soybean (in 6 pesticides) | MSPD as the extraction technique followed by a clean-up step, using a C8 co-column | 1gm | 40 mins | 20 mL of ethyl acetate and 5 mL methanol | HPLC | 60-118 (15–26) | 40 | Maldaner et al. 2008 |
| Peanut (Single) | Ultrasonic Extraction (USE) using methanolic sodium carbonate followed by clean up with strong cation exchang solid phase extraction (SPE/SCE) | (Not available) | Not available | Not available | HPLC | 80.6-95.5 (2.21-8.45). | 8.81 | Zhou and Zhang, 2009 | |
| quizalofop-p-ethyl | Rapeseed (Single) | Liquid partitioning with acetonitrile followed by a clean-up by QuEChERS method | 10 gm | 13 mins | 10 mL ACN | LC-MS/MS | 90.6-93.1 (1.3-6.6) | 1 | Guan and Zhang, 2012 |
| Rapeseed oil (27 pesticides) | Liquid partitioning with ACN or acidified ACN with LLP | 10 gm | 6 minis for extraction and 12 hrs for LTP | 10 mL ACN | LC-MS/MS | 81-90 (3–15) | 4 | Jiang et al. 2012 | |
| Sunflower seed (5 pesticides) | QuEChERS-liquid partitioning with ACN followed by a clean-up step based on dispersive solid-phase extraction with PSA | 10 gm | 8 mins | 10 mL ACN | GC-MS/MS | 97-106.1 (2.3-15) | 2.9 | Mantzos et al. 2013 | |
| Simultaneous analysis of pendimethalin, oxyfluorfen, imazethapyr and quizalofop-p-ethyl | Raw peanut | QuEChERS-liquid partitioning with acetonitrile without any clean up | 2.5 gm | 13 mins | 10 mL ACN | LC-MS/MS | 69.4-94.4 (2.6-16.6) | 5-10 | Proposed method |
Herbicides residue levels in peanut samples grown in experimental fields
The developed method was applied for analysis of different peanut samples collected from the experimental fields. No herbicide residues were detected in peanut kernel at harvest time with withholding period of 4 months for pendimethalin and oxyfluorfen and 100 days for imazethapyr and quizalofop-p-ethyl after treatments. This indicated that the residue levels of selected herbicides in peanuts were below the MRL value prescribed by European Union (EU) and other international organizations. Guan and Zhang, 2012, reported the harvest residues of quizalofop-p-ethyl in rapeseed and soil as below the detection limit. Sireesha et al. 2012 reported that in radish tubers, the detected residues of pendimethalin and oxyfluorfen were below MRL values at harvest (MRL of pendimethalin (European Food Safety Authority EFSA 2013) and oxyfluorefen (EU Database on MRLs 2013) in radish root is 0.05 mg kg−1). Sondhia, 2008, reported the residue of imazethapyr was below the MRLs in the grains of soybean at harvest (MRL of imazethapyr in soybean grain is 0.1 mg kg−1, Anonymous, 2006).
Since no residues were detected in any of the harvested samples, risk associated with dietary exposure of these herbicides in peanut is considered as safe to the human being.
Conclusion
In this study an analytical method based on modified QuEChERS extraction combined with LC-MS/MS analysis was developed for determination of residues of four herbicides viz. pendimethalin, oxyfluorfen, imazethapyr and quizalofop-p-ethyl in peanut kernels simultaneously without any clean up step. Several experimental parameters were investigated to provide optimum conditions suitable for the extraction. The pre-soaking of the treated sample in water (1:1 sample to water ratio) and crushing of it and addition of external water facilitated satisfactory sample homogenization and extraction. Compared with the published methods, the proposed method was simple, the consumption of organic solvents was reduced and the extraction time was short. The developed method showed satisfactory validation parameters in terms of linearity, low detection and quantification limits, high accuracy and precision and low measurement of uncertainties. Owing to the LC-MS/MS detection, the method gave a good sensitivity and selectivity for different herbicides and the LOQs assessed by the method were below than the MRL values prescribed by European Union (EU) and other international organizations. Virtually no interfering peaks were observed in the chromatograms of the analyzed peanut samples. Appropriate quality control samples (such as solvent blank, spiked blank and matrix spike) has been run along with routine analysis samples to check whether the performance characteristics of the method remain comparable to those obtained in validation. This method was successfully employed to determine the harvest time residues of these herbicides in peanut, and in all cases it was found that the herbicide residues were below the detection limit irrespective of the doses applied in the field experiment. Based on the findings, our study recommends the use of these herbicides in peanut.
Acknowledgment
The authors are thankful to Director, Directorate of Groundnut Research (ICAR), Junagadh and Director, National Research Centre for Grapes (ICAR), Pune, for providing necessary facilities for conducting the study.
References
- Anastassiades M, Lehotay SJ, Stajnbaher D, Schenck FJ. Fast and easy multiresidue method employing acetonitrile extraction/partitioning and “dispersive solid phase extraction” for the determination of pesticide residues in produce. J AOAC Int. 2003;86(2):412–431. [PubMed] [Google Scholar]
- Anonymous (2006) Regulations amending the food and druf regulation (1454 Imazethapyr) Canada Gazette 140: No. 19, May 13, 2006
- Banerjee K, Oulkar DP, Dasgupta S, Patil SB, Patil SH, Savant R. Validation and uncertainty analysis of a multiresidue method for pesticides in grapes using ethyl acetate extraction and liquid chromatography–tandem mass spectrometry. J Chromatogr A. 2007;1173:98–109. doi: 10.1016/j.chroma.2007.10.013. [DOI] [PubMed] [Google Scholar]
- Bletsou AA, Hanafi AH, Dasenaki ME, Thomaidis NS (2013) Development of specific LC-ESI-MS/MS methods to determine bifenthrin, lufenuron and iprodione residue levels in green beans, peas and chili peppers under Egyptian field condition. Food Anal Methods 6:1099–112
- Bonmatin JM, Moineau I, Charvet R, Fleche C, Colin ME, Bengsch ER. A LC/APCI-MS/MS method for analysis of imidacloprid in soils, in plants, and in pollens. Anal Chem. 2003;75:2027–2033. doi: 10.1021/ac020600b. [DOI] [PubMed] [Google Scholar]
- Botitsi HV, Garbis SD, Economou A, Tsipi DF. Current mass spectrometry strategies for the analysis of pesticides and their metabolites in food and water matrices. Mass Spectrom Rev. 2011;30:907–939. doi: 10.1002/mas.20307. [DOI] [PubMed] [Google Scholar]
- Carneiro RP, Oliveira FAS, Madureira FD, de Silva G, Souza WR, Lopes RP (2013) Development and method validation for determination of 128 pesticides in bananas by modified QuEChERS and UHPLC–MS/MS analysis. Food Control 33:413–423
- Cortes JM, Toledano RM, Villen J, Vazquez A. Analysis of pesticides in nuts by online reversed-phase liquid chromatography-gas chromatography using the through-oven transfer adsorption/desorption interface. J Agric Food Chem. 2008;56:5544–5549. doi: 10.1021/jf800773k. [DOI] [PubMed] [Google Scholar]
- Cunha SC, Lehotay SJ, Mastovska K, Fernandes JO, Beatriz M, Oliveira PP. Evaluation of the QuEChERS sample preparation approach for the analysis of pesticide residues in olives. J Sep Science. 2007;30:620–632. doi: 10.1002/jssc.200600410. [DOI] [PubMed] [Google Scholar]
- Engebretson J, Hall G, Hengel M, Shibamoto T. Analysis of pendimethalin residues in fruits, nuts, vegetables, grass and mint by gas chromatography. J Agric Food Chem. 2001;49:2198–2206. doi: 10.1021/jf010048b. [DOI] [PubMed] [Google Scholar]
- EU Database on MRLs (MRLs updated on 28/01/2013).http://ec.europa.eu/sanco_pesticides/public/index.cfm
- EURACHEM/CITAC guide CG 4, EURACHEM CITAC guide. Quantifying uncertainty in analytical measurement (3rd ed.). Available from <http://www.measurementuncertainty.org/>Accessed June, 2014
- European Commission (2011) Document SANCO/12495 Method validation and quality control procedures for pesticide residues analysis in food and feed. European Commission: Brussels, 2011. http://ec.europa.eu/food/plant/protection/resources/qualcontrolen.pdf. (Accessed on June 2014)
- European Commission Decision 2002/657/EC. Off J Eur Commun L 221:8–36
- European Food Safety Authority (EFSA) Reasoned opinion on the modification of the existing MRLs for pendimethalin in various crops. EFSA Journal. 2013;11(5):3217. [Google Scholar]
- FAS International maximun residue level database. http://www.mrldatabase.com Accessed 6 Feb 2013
- Fenoll J, Hellin P, Flores P, Sotomayor JA, Nicolas MI. Determination of oxadiazon and oxyfluorfen in thyme by gas chromatography with electron-capture detection and gas chromatography/mass spectrometry. Int J Environ Anal Chem. 2008;88(9):663–670. doi: 10.1080/03067310802030699. [DOI] [Google Scholar]
- Ferreira AMC, Laespada MEF, Pavon JLP, Cordero BM. Development of an environmentally friendly methodological approach to determine chlorinated hydrocarbons and chlorobenzenes in soils. Green Chem Lett Rev. 2014;7(1):50–59. doi: 10.1080/17518253.2014.895860. [DOI] [Google Scholar]
- Food Safety and Standards Authority of India, Food Safety and Standards (contaminants, toxins and residues) Regulations, 2011.http://www.fssai.gov.in/Portals/0/Pdf/Food %20 safe -ty%20and%20standards%20 (contaminats%20toxins%20and%20residues)%20regulation,%2 02011.pdf
- Francisco MLDL, Resurreccion AVA. Functional components in peanuts. Crit Rev Food Sci Nutr. 2008;48:715–746. doi: 10.1080/10408390701640718. [DOI] [PubMed] [Google Scholar]
- Franco S, Marchi MRR-de. Matrix Effects on water analysis for alkylphenols using solid phase extraction gas chromatography–mass spectrometry. Anal Lett. 2013;46(16):2557–2569. doi: 10.1080/00032719.2013.803247. [DOI] [Google Scholar]
- Govindaraj G, Jain VK. Constraints and strategies for development of small-scale peanut processing units in Gujarat (India): A Garret ranking approach. Int J Agricult Stat Sci. 2012;8(2):705–711. [Google Scholar]
- Gratz SR, Ciolino LA, Mohrhaus AS, et al. Screening and determination of polycyclic aromatic hydrocarbons in seafoods using QuEChERS based extraction and high performance liquid chromatography with fluorescence detection. J AOAC Int. 2011;94:1601–1616. doi: 10.5740/jaoacint.11-035. [DOI] [PubMed] [Google Scholar]
- Guan W, Zhang H. Determination and study on residue and dissipation of benazolin-ethyl and quizalofop-p-ethyl in rape and soil. Int J Environ Anal Chem. 2012;93(6):679–691. doi: 10.1080/03067319.2012.684047. [DOI] [Google Scholar]
- Han L, Guo BY, Feng JH, Lu XM, Lin JM. Study on the enantioselective degradation of imazethapyr in soil by CE. Chromatographia. 2008;68:1071–1073. doi: 10.1365/s10337-008-0836-7. [DOI] [Google Scholar]
- Hernandez F, Pozo OJ, Sancho JV, Bijlsma L, Barreda M, Pitarch E. Multiresidue liquid chromatography tandem mass spectrometry determination of 52 non gas chromatography-amenable pesticides and metabolites in different food commodities. J Chromatogr A. 2006;1109:242–252. doi: 10.1016/j.chroma.2006.01.032. [DOI] [PubMed] [Google Scholar]
- Hu J, Deng Z, Liu C, Zheng Z. Simultaneous analysis of herbicide metribuzin and quizalofop-p-ethyl residues in potato and soil by GC-ECD. Chromatographia. 2010;72(7/8):701–706. doi: 10.1365/s10337-010-1717-4. [DOI] [Google Scholar]
- Jat RS, Meena HN, Singh AL, Surya JN, Misra JB. Weed management in groundnut (Arachis hypogaea) in India - A review. Agri Reviews. 2011;32(3):155–171. [Google Scholar]
- Jiang Y, Li Y, Jiang Y, Li J, Pan C. Determination of multiresidues in rapeseed, rapeseed oil, and rapeseed meal by acetonitrile extraction, low-temperature cleanup, and detection by liquid chromatography with tandem mass spectrometry J. Agric Food Chem. 2012;60:5089–5098. doi: 10.1021/jf3004064. [DOI] [PubMed] [Google Scholar]
- Johnson YS. Determination of polycyclic aromatic hydrocarbons in edible seafood by QuEChERS-based extraction and gas chromatography-tandem mass spectrometry. J Food Sci. 2012;77:131–137. doi: 10.1111/j.1750-3841.2012.02758.x. [DOI] [PubMed] [Google Scholar]
- Kaljurand M, Koel M. Recent advancements on greening analytical separation. Cri Rev Anal Chem. 2011;41(1):2–20. doi: 10.1080/10408347.2011.539420. [DOI] [Google Scholar]
- Kmellar B, Fodor P, Pareja L, Ferrer C, Martinez-Uroz MA, Valverde A, Fernandez-Alba AR. Validation and uncertainty study of a comprehensive list of 160 pesticide residues in multi-class vegetables by liquid chromatography-tandem mass spec trometry. J Chromatogr A. 2008;1215:37–50. doi: 10.1016/j.chroma.2008.10.121. [DOI] [PubMed] [Google Scholar]
- Koesukwiwat U, Lehotay SJ, Mastovska K, Dorweiler KJ, Leepipatpiboon N. Extension of the QuEChERS method for pesticide residues in cereals to flaxseeds, peanuts, and doughs. J Agric Food Chem. 2010;58:5950–5958. doi: 10.1021/jf902988b. [DOI] [PubMed] [Google Scholar]
- Koesukwiwat U, Sanguankaew K, Leepipatpiboon N. Rapid determination of phenoxy acid residues in rice by modified QuEChERS extraction and liquid chromatography-tandem mass spectrometry. Anal Chim Acta. 2008;626:10–20. doi: 10.1016/j.aca.2008.07.034. [DOI] [PubMed] [Google Scholar]
- Kolberg DI, Prestes OD, Adaime MB, Zanella R. Development of a fast multiresidue method for the determination of pesticides in dry samples (wheat grains, flour and bran) using QuEChERS based method and GC–MS. Food Chem. 2011;125:1436–1442. doi: 10.1016/j.foodchem.2010.10.041. [DOI] [Google Scholar]
- Konieczka P, Namiesnik J (2010) Estimating uncertainty in analytical procedures based on chromatographic techniques. J Chromatogr A 1217:882–891 [DOI] [PubMed]
- Lehotay SJ, Mastovska K, Yun SJ. Evaluation of two fast and easy methods for pesticides residue analysis in fatty food matrixes. J AOAC Int. 2005;88:630–638. [PubMed] [Google Scholar]
- Li L, Zhang H, Pan C, Zhou Z, Jiang S, Liu F. Multiresidue analytical method of pesticides in peanut oil using low-temperature cleanup and dispersive solid phase extraction by GC-MS. J Sep Science. 2007;30:2097–2104. doi: 10.1002/jssc.200700052. [DOI] [PubMed] [Google Scholar]
- Li L, Zhou Z, Pan C, Qian C, Jiang S, Liu F (2007b) Determination of organophosphorus pesticides in soybean oil, peanut oil and sesame oil by low-temperature extraction and GC-FPD Chromatographia 66:625–629
- Madureira FD, Oliveira FAS, Souza WR, Pontelo AP, Oliveira MLG, Silva G. A multi-residue method for the determination of 90 pesticides in matrices with a high water content by LC-MS/MS without clean-up. Food Addit Contam. 2012;29(4):665–678. doi: 10.1080/19440049.2011.623837. [DOI] [PubMed] [Google Scholar]
- Maldaner L, Santana CC, Jardim ICSF. HPLC determination of pesticides in soybeans using matrix solid-phase dispersion. J Liq Chromatogr Relat Technol. 2008;31(7):972–983. doi: 10.1080/10826070801924675. [DOI] [Google Scholar]
- Mantzos N, Karakitsou A, Zioris I, Leneti E, Konstantinou I. QuEChERS and solid phase extraction methods for the determination of energy crop pesticides in soil, plant and runoff water matrices. Int J Environ Anal Chem. 2013;93(15):1566–1584. doi: 10.1080/03067319.2013.803282. [DOI] [Google Scholar]
- Mastovska K, Dorweiler KJ, Lehotay SJ, Wegwcheid JS, Szpylka KA. Pesticide multiresidue analysis in cereal grains using modified QuEChERS method combined with automated direct sample introduction GC-TOFMS and UPLC-MS/MS techniques. J Agric Food Chem. 2010;58:5959–5972. doi: 10.1021/jf9029892. [DOI] [PubMed] [Google Scholar]
- Newsome WH, Doucet J, Davies D, Sun WF. Pesticide residues in the Canadian market basket survey 1992 to 1996. Food Addit Contam. 2000;17(10):847–854. doi: 10.1080/026520300420411. [DOI] [PubMed] [Google Scholar]
- Pareja L, Cesio V, Heinzen H, Fernández-Alba AR. Evaluation of various QuEChERS based methods for the analysis of herbicides and other commonly used pesticides in polished rice by LC–MS/MS. Talanta. 2011;83:1613–1622. doi: 10.1016/j.talanta.2010.11.052. [DOI] [PubMed] [Google Scholar]
- Pinto CG, Martin SH, Pavon JLP, Cordero BM. A simplified quick, easy,cheap, effective, rugged and safe approach for the determination of trihalomethanes and benzene, toluene, ethylbenzene and xylenes in soil matrices by fast gas chromatography with mass spectrometry detection. Anal Chim Acta. 2011;689:129–136. doi: 10.1016/j.aca.2011.01.023. [DOI] [PubMed] [Google Scholar]
- Reddy PS. Genetics, breeding and varieties. In: Reddy PS, editor. Groundnut. New Delhi: Indian Council of Agricultural Research Kirshi, Pusa; 1988. pp. 200–317. [Google Scholar]
- Romero-Gonzalez R, Frenich AG, Vidal JLM, Prestes OD, Grio SL. Simultaneous determination of pesticides, biopesticides and mycotoxins in organic products applying a quick, easy, cheap, effective, rugged and safe extraction procedure and ultra-high performance liquid chromatography-tandem mass spectrometry. J Chromatogr A. 2011;1218:1477–1485. doi: 10.1016/j.chroma.2011.01.034. [DOI] [PubMed] [Google Scholar]
- Sadowska-Rociek A, Surma M, Cieslik E. Comparison of different modifications on QuEChERS sample preparation method for PAHs determination in black, green, red and white tea. Environ Sci Pollut Res. 2014;21:1326–1338. doi: 10.1007/s11356-013-2022-1. [DOI] [PMC free article] [PubMed] [Google Scholar]
- Sanchez AG, Martos NR, Ballesteros E. Multiresidue analysis of pesticides in olive oil by gel permeation chromatography followed by gas chromatography–tandem mass-spectrometric determination. Anal Chim Acta. 2006;558:53–61. doi: 10.1016/j.aca.2005.11.019. [DOI] [Google Scholar]
- Shah J, Jan MR, Shehzad FU, Ara B. Quantification of pendimethalin in soil and garlic samples by microwave-assisted solvent extraction and HPLC method. Environ Monit Assess. 2011;175:103–108. doi: 10.1007/s10661-010-1496-2. [DOI] [PubMed] [Google Scholar]
- Sireesha A, Rao PC, Rao PV, Swapna G, Ramalakshmi CS. Residues of pendimethalin and oxyfluorfen in radish and their persistence in soil. J Crop Weed. 2012;8(2):120–125. [Google Scholar]
- Sobhanzadeh E, Bakar NKA, Abas MRB, Nemati KA. Simple and efficient multi-residue method based on QuEChERS for pesticides determination in palm oil by liquid chromatography time-of-flight mass spectrometry. Environ Monit Assess. 2012;184:5821–5828. doi: 10.1007/s10661-011-2384-0. [DOI] [PubMed] [Google Scholar]
- Sondhia S. Terminal residues of imazethapyr in soybean grains, straw and soil. Pesticide Res J. 2008;20(1):128–129. [Google Scholar]
- Sondhia S. Persistence and bioaccumulation of oxyfluorfen residues in onion. Environ Monit Assess. 2010;162:163–168. doi: 10.1007/s10661-009-0784-1. [DOI] [PubMed] [Google Scholar]
- Steinheimer TR, Scoggin KD. Estimation of imazethapyr in agricultural water by its cross-reactivity with either imazaquin or imazapyr ELISA kits. J Agric Food Chem. 1998;46:1883–1886. doi: 10.1021/jf971057g. [DOI] [Google Scholar]
- Stocka J, Tankiewicz M, Biziuk M, Namieśnik J. Green aspects of techniques for the determination of currently used pesticides in environmental samples. Int J Mol Sci. 2011;12:7785–7805. doi: 10.3390/ijms12117785. [DOI] [PMC free article] [PubMed] [Google Scholar]
- Su R, Xu X, Wang X, Li D, Li X, Zhang H, Yu A. Determination of organophosphorus pesticides in peanut oil by dispersive solid phase extraction gas chromatography–mass spectrometry. J Chromatogr B. 2011;879(30):3423–3428. doi: 10.1016/j.jchromb.2011.09.016. [DOI] [PubMed] [Google Scholar]
- Thompson M, Ellison SLR, Wood R. Harmonized guidelines for single laboratory validation of methods of analysis. IUPAC technical report. Pure Appl Chem. 2002;74:835–855. doi: 10.1351/pac200274050835. [DOI] [Google Scholar]
- Tobiszewski M, Mechlinska A, Zygmunt B, Namiesnik J. Green analytical chemistry in sample preparation for determination of trace organic pollutants. Trac-Trend Anal Chem. 2009;28(8):943–951. doi: 10.1016/j.trac.2009.06.001. [DOI] [Google Scholar]
- Walorczyk S. Development of a multi-residue method for the determination of pesticides in cereals and dry animal feed using gas chromatography–tandem quadrupole mass spectrometry II Improvement and extension to new analytes. J Chromatogr A. 2008;1208:202–214. doi: 10.1016/j.chroma.2008.08.068. [DOI] [PubMed] [Google Scholar]
- Wang DN. Methods for determination of agricultural chemical residues in foods in Japan. Beijing: Standard press of China; 2006. pp. 422–445. [Google Scholar]
- Wang J-H, Cai F, Wang Y-L, Wang X-L. Pesticide multiresidue analysis of peanuts using automated gel permeation chromatography clean-up/gas chromatography–mass spectrometry. Food Addit Contam. 2009;26(3):333–339. doi: 10.1080/02652030802350672. [DOI] [PubMed] [Google Scholar]
- Wilkowska A, Biziuk M. Determination of pesticide residues in food matrices using the QuEChERS methodology. Food Chem. 2011;125:803–812. doi: 10.1016/j.foodchem.2010.09.094. [DOI] [Google Scholar]
- Wong J, Hao C, Zhang K, Yang P, Banerjee K, Hayward D, Iftakhar I, Schreiber A, Tech K, Sack C, Smoker M, Chen X, Utture SC, Oulkar DP. Development and interlaboratory validation of a QuEChERS-Based liquid chromatography-tandem mass spectrometry method for multiresidue pesticide analysis. J Agric Food Chem. 2010;58:5897–5903. doi: 10.1021/jf903849n. [DOI] [PubMed] [Google Scholar]
- Zeng DY, Shi HY, Li B, Wang M, Song BA. Development of an enzyme-linked immunosorbent assay for quantitative determination of quizalofop-p-ethyl. J Agric Food Chem. 2006;54:8682–86. doi: 10.1021/jf061492n. [DOI] [PubMed] [Google Scholar]
- Zhou Y-m, Zhang H-s (2009) Detection of imazethapyr in peanut. Agrochemicals (in Chinese) 12:024