

Abstract
Gastric slow wave dysrhythmias are associated with motility disorders. Periods of tachygastria associated with slow wave re-entry were recently recognized as one important dysrhythmia mechanism, but factors promoting and sustaining gastric re-entry are currently unknown. This study reports two experimental forms of gastric re-entry and presents a series of multi-scale models that define criteria for slow wave re-entry initiation, maintenance and termination. High-resolution electrical mapping was conducted in porcine and canine models and two spatiotemporal patterns of re-entrant activities were captured: single-loop rotor and double-loop figure-of-eight. Two separate multi-scale mathematical models were developed to reproduce the velocity and entrainment frequency of these experimental recordings. A single-pulse stimulus was used to invoke a rotor re-entry in the porcine model and a figure-of-eight re-entry in the canine model. In both cases, the simulated re-entrant activities were found to be perpetuated by tachygastria that was accompanied by a reduction in the propagation velocity in the re-entrant pathways. The simulated re-entrant activities were terminated by a single-pulse stimulus targeted at the tip of re-entrant wave, after which normal antegrade propagation was restored by the underlying intrinsic frequency gradient. Main findings: (i) the stability of re-entry is regulated by stimulus timing, intrinsic frequency gradient and conductivity; (ii) tachygastria due to re-entry increases the frequency gradient while showing decreased propagation velocity; (iii) re-entry may be effectively terminated by a targeted stimulus at the core, allowing the intrinsic slow wave conduction system to re-establish itself.
Keywords: gastric dysrhythmia, multi-scale, slow wave, high-resolution mapping
1. Introduction
The motility of the stomach is coordinated by a bioelectrical slow wave activity, which is generated by specialized pacemaker cells termed the interstitial cells of Cajal (ICC) (Huizinga & Lammers, 2009). ICC generate slow waves at different intrinsic frequencies along the gastrointestinal (GI) tract and actively propagate into the smooth muscle layers; smooth muscle cells without ICC cannot maintain normal slow wave conduction (Huizinga & Lammers, 2009). Entrainment of ICC to a single frequency with a constant phase-lag is a key mechanism underpinning regular gastric slow wave propagations (Van Helden et al., 2010). Degradations and loss of ICC have been associated with abnormal slow wave propagations in the form of dysrhythmias in patients diagnosed with gastroparesis and other significant GI motility disorders (Farrugia, 2008; O’Grady et al., 2012a).
Like in the heart, the understanding of gastric slow wave conduction has been partly enabled through advancements in both recording techniques and multi-scale mathematical modelling (Cheng et al., 2013; Paterson, 2013). Accurate spatiotemporal descriptions of GI slow waves have been reported relatively recently through the adoption of high-resolution (HR) electrical mapping (up to 256 electrodes; 1–8 mm inter-electrode pacing) (Egbuji et al., 2010; Lammers et al., 2009; O’Grady et al., 2010a). In a significant recent advance, GI slow wave dysrhythmias have recently been mapped in both the stomach and intestine in animals and humans (Angeli et al., 2013; Lammers et al., 2008, 2012; O’Grady et al., 2011, 2012a). In two separate studies, investigators have now specifically reported occurrences of functional rotor re-entry as one of the key mechanisms associated with gastric dysrhythmia (Lammers et al., 2008; O’Grady et al., 2011). Lammers et al. (2008) reported rotor re-entry in the canine antrum and O’Grady et al. (2011) reported rotor re-entry in the porcine corpus. In both studies, the functional re-entry events were perpetuated by tachygastria compared with the baseline recordings (tachygastria vs baseline in cycles-per-minute (cpm); canine: 11.8 vs 4.9 cpm; porcine: 4.1 vs 3.2 cpm) (Lammers et al., 2008; O’Grady et al., 2011). Furthermore, a relationship of wave separation, which relates to the excitation gap between the successive activities in intestinal re-entrant pathway, as a function of velocity and frequency, was also defined (Angeli et al., 2013).
A key aspect in understanding the re-entry dysrhythmia is elucidating the relationship between the elevated frequency and spatial organization of re-entrant patterns in the stomach. However, a limiting factor is that, to date, all cases of gastric re-entrant pathways were reported as spontaneously occurring events (Lammers et al., 2008; O’Grady et al., 2011), and a protocol for inducing slow wave re-entry is currently lacking. Therefore, focused experimental investigations of gastric re-entry are presently difficult to achieve. An alternative strategy involves the use of continuum mathematical modelling techniques that have been used to great effect in elucidating mechanisms of cardiac dysrhythmias, particularly in uncovering the principle of re-entry activities (Paterson, 2013). Recently, continuum modelling simulation studies have emerged as a tool to investigate gastric slow wave propagations and dysrhythmia mechanisms (Cheng et al., 2013; Du et al., 2013b).
This study presents two theoretical models of gastric re-entrant activity, based on experimental data, to advance understanding of their underlying mechanisms. Two original experimental recordings of episodes of re-entry are presented: (i) a rotor and (ii) a figure-of-eight re-entry. The conduction velocity data from the recordings were then used to support the parameters in the two theoretical models, which were simulated to reproduce the experimental data. Finally, a series of perturbation-simulation studies were conducted to define the initiation, maintenance and termination criteria of gastric slow wave re-entry.
2. Methods
2.1. Experimental methods
Ethical approvals for the experiments were granted by the local institutional review committees (University of Mississippi Medical Center and the University of Auckland), and the International Guiding Principles for Biomedical Research Involving Animals were followed. All recordings were conducted under general anaesthesia with serosal access provided by a midline laparotomy (Egbuji et al., 2010). A validated printed-circuit-board flexible recording platform (inter-electrode spacing: 4/7.2 mm; up to 128 electrodes) was used (Du et al., 2009). Mongrel canines (mean weight: 22 kg) and white cross-breed weaner pigs (mean weight: 35 kg) were employed, according to previously described methods (Egbuji et al., 2010). All recordings were manually screened and a 10-min segment of recordings ( 30 cycles) consisting of spontaneous re-entrant activities was analysed.
Signals were acquired using an ActiveTwo acquisition system modified for passive recordings (BioSemi, the Netherlands). All data analysis was performed in the Gastrointestinal Electrical Mapping Suite (GEMS) software (v1.5) (Yassi et al., 2012). Details of filtering (Paskaranandavadivel et al., 2013), slow wave event and dysrhythmia detection, and data presentation methods (activation, amplitude and velocity mapping) were reported in detail a previous set of studies (O’Grady et al., 2011, 2012a; Paskaranandavadivel et al., 2012). Unless otherwise mentioned, the data are reported in mean SEM.
SEM.
2.2. Experimental recordings used to inform simulations
An example of baseline slow wave activity recorded from the porcine gastric corpus and canine gastric antrum is demonstrated in Fig. 1(a,c), respectively. In both cases, gastric slow waves were organized in a coherent wavefront in a single direction, with a normal slow wave frequency of  cpm in the canine subject and
  cpm in the porcine subject. The velocity of this baseline slow wave activity in the longitudinal gastric axis was
  mm s
mm s in the canine antrum and
  mm s
mm s in the porcine corpus, which were in agreement with previously reported ranges (Egbuji et al., 2010; Lammers et al., 2009). The amplitude of baseline slow wave activity was on average
  mV and in the canine subject and
  mV in the porcine subject.
Fig. 1.

Recordings of gastric slow wave baseline and re-entry activations (inter-electrode spacing: 4 mm). In the baseline activation maps (a,c), slow waves were organized and propagated in a single direction towards the pylorus. In the activation maps (b,d), the re-entrant paths are illustrated by the dashed arrow and the functional blocks (highlighted in grey). The bands in the activation maps represent the times of slow wave activation as indicated by the colour bar on the bottom of each map. In the signal traces (selected at the numbered locations following the re-entry in (b) (1–8) and (d) (1–8); the re-entrant activities are highlighted in grey. (b) A clockwise rotor re-entry in the anterior porcine corpus. (d) A figure-of-eight re-entry in the anterior canine antrum. The activation of the canine re-entry was noticeably faster than the porcine activation. An animation of the re-entrant activities is provided in the supplementary file (Supplement citation link is missing. Insert the tag for supplementary link like Supplementary Animation 1).
A number of spontaneous dysrhythmic episodes were recorded during mapping periods, being consistent in terms of the dynamic behaviour and general propagation patterns in these two species as previously described (Lammers et al., 2008; O’Grady et al., 2011). In particular, two recorded spontaneous episodes of slow wave re-entry were selected to inform the modelling methods, as they were representative of the experimental classes of re-entry (Supplementary Animation 1): the first such episode was a ‘rotor’ re-entry from the porcine corpus (Fig. 1b) and the second was a ‘figure-of-eight’ re-entry from the canine antrum (Fig. 1d). Electrograms were selected to focus on re-entrant initiation and termination behaviours: the rotor re-entry was sustained for up to three cycles and the figure-of-eight pattern terminated spontaneously after two cycles.
Re-entry types were defined based on a previous HR mapping studies conducted by Lammers et al. (2008) and Angeli et al. (2013). Specifically, a rotor re-entry was defined as a rotating wavefront emerging from an ectopic site and propagating in a circuit in a single-direction around a ‘core’ region in the centre of the re-entrant activity (Fig. 1b), while a figure-of-eight re-entry was defined as a double-loop re-entry emerging simultaneously from an ectopic site and propagating around the core in the opposite directions (Fig. 1d).
Functional rotor re-entry occurred spontaneously in the porcine subject, emerging as spiral waves from an ectopic site and around a core located along the greater curvature of the gastric corpus (Fig. 1b). In the activation map, the rotor is seen to be located near the bottom of the mapped field and was maintained over three consecutive cycles. The total activation time of the rotor re-entry around a single loop was  17 s (Fig. 1b). The figure-of-eight re-entry around a single loop was
  6 s (Fig. 1d).
3. Simulation methods and models
3.1. Gastric slow wave entrainment model
Slow wave propagation is underpinned by a mechanism called entrainment, where a network of coupled self-excitatory oscillators, i.e. ICC, with a declining gradient of intrinsic frequencies, converges to a single frequency with constant phase-lag to form a coherent propagating wave (Van Helden et al., 2010). A number of recent multi-scale modelling studies have adopted continuum approaches to model a voltage-dependent mediation of slow wave entrainment in an ICC network (Buist et al., 2010; Du et al., 2010c). In this study, a similar approach using the monodomain model was employed as the governing Equation (1) to simulate entrainment of gastric slow waves (Du et al., 2010b)
 |
(1) |
where  denotes the (trans)membrane potential, with
  and
and  denote ion current and membrane capacitance of ICC, respectively. A stimulus current (
 was used to invoke re-entry events, but not in baseline simulations, because the ICC model employed in this study was self-excitatory. At the tissue level,
  denotes the surface-to-volume ratio and
  denotes the conductivity of the tissue. The monodomain equation couples the slow waves from adjacent active gastric tissues through the terms on the left-hand side of Equation (1). A cell model description was used to further define the
  term on the right-hand side of Equation (1). For this study, a recently published computationally efficient slow wave cell model (Du et al., 2013a), based on another published slow wave cell model (Imtiaz et al., 2002), was incorporated into Equation (1) to simulate a voltage-dependent entrainment of slow wave propagation
 |
(2) |
where the three ion conductances (sodium:  , calcium:
  , background potassium:
  and parameters were identical to the values published in a previous cell modelling study (Du et al., 2013a). The exact slow wave entrainment mechanisms remain incompletely understood. The cell model employed in this study represents a voltage-dependent inositol 1,4,5-trisphosphate (IP
 mechanism of entrainment (Imtiaz et al., 2002; Koh et al., 2003). Other alternative entrainment mechanisms include unitary potentials and Ca
 -sensitive Cl
 conductance, which were considered in other cell modelling studies (Buist et al., 2010; Faville et al., 2009), but they were not employed in this study due to computational efficiency (Lees-Green et al., 2011).
One of the key electrophysiological properties of gastric tissue is an underlying gradient of intrinsic frequencies which determines the propagation of slow wave activity in the aboral direction of the stomach (Huizinga & Lammers, 2009). In the employed cell model (Equation (2)) (Du et al., 2013a), the intrinsic frequency in the cell model was modelled as function of the linear degradation of IP based on the formulation proposed by Imtiaz et al. (2002), as follows:
 |
(3) |
where  is the rate of constant production of IP
 ,
,  is the linear degradation of IP
 ,
,  is the maximum rate of non-linear degradation of IP
 ,
,  and
and  are half saturation constants,
  and
and  are hill coefficients, and
  is maximum rate of IP
 synthesis. The full parameter definitions and values used in this study can be found in a previous study (Du et al., 2013a). A range of
  values (0.06–0.1 m s
 were used to prescribe the intrinsic frequencies of the cell model (Fig. 2a,b).
Fig. 2.

Characterization of cell model intrinsic frequency and stimulation. (a) Intrinsic frequency of the cell model characterized as a function of degradation of IP . (b) Three examples of simulated slow waves at different intrinsic frequencies (top: 5.5 cpm; middle: 3.7 cpm; bottom: 2.5 cpm) at three
  values (0.7, 0.8 and 0.9 m s
 highlighted by the dots in (a). (c) A simulated normal slow wave activity at intrinsic frequency of 3 cpm (bold line). Three separate pacing protocols were tested (single-pulse, 30 pA, 350 ms at 8, 9 and 10 s), none of which produced an active response by the cell model. (d) Three other pacing protocols (single-pulse, 30 pA, 350 ms at 12, 14 and 16 s) invoked active responses where the phase of the subsequent slow waves were shifted by a constant time difference compared with the normal activity (bold).
Another important aspect of the voltage-dependent IP entrainment mechanism is the response of the cell model to an extrinsic stimulus, either in the form of a current stimulus or slow wave potentials from neighbouring tissues (Buist et al., 2010; Du et al., 2010c). To this end, the responses of the cell model at an intrinsic frequency of 3 cpm to a series of stimuli (single pulse; amplitude: 30 pA; duration: 350 ms) at six different onset times were also characterized (Fig. 2c,d).
Equation (1) was solved numerically using a grid-based finite-element-based technique using the CMISS simulation package (Trew et al., 2005). The simulation package employed an LU decomposition and a Euler numerical solver with an implicit scheme to solve the discrete forms of Equation (1). Details on the solution procedures have been previously described (Du et al., 2010a). All numerical simulations were solved on a single 2.27 GHz Intel Xeon CPU of an HPC with 26 GB total memory.
Previous modelling studies have investigated entrainment of slow waves in a 1D model (Buist et al., 2010; Du et al., 2010c). However, because a modified cell model was used in this study and the baseline simulations were fitted to two species with different intrinsic frequencies, additional changes to the model were required to demonstrate entrainment. To this end, a 1D model of 60 mm in length with 1 mm spatial resolution was created with a linear gradient of intrinsic frequency (4.9–4.0 cpm) and zero-flux boundary condition, i.e.  , to demonstrate the mechanism of entrainment. The frequency was based on the baseline frequency from the canine experimental recording (Section 2.3). The 1D model was simulated until it had reached steady-state after 180 s of simulated time, the values of which were used as the initial conditions to simulate the following conditions over a range of conductivities as well as frequency gradients: (i) normal entrainment; (ii) decoupled slow waves, where
  was reduced to a relatively small value (0.02 S mm
 . No stimulus was used in either case, i.e.
  pA.
pA.
3.2. Two-dimensional (2D) mathematical models
A mathematical model representing the coverage of 256 electrodes ( mm
mm with 1 mm spatial resolution in both directions was developed to simulate gastric slow wave propagation in 2D. For this study, the 2D model was assumed to be transverse isotropic, i.e. with the slow waves propagating in the longitudinal (vertical) direction of the model only, as previously demonstrated in a HR mapping study of activation in the porcine stomach (O’Grady et al., 2012b). During normal gastric conduction, a planar wave propagates in the longitudinal direction, as dictated by the conductivity in the longitudinal direction; while during an ectopic activation, the faster circumferential propagation results in an elliptical core profile (O’Grady et al., 2012b). The parameters used to simulate each baseline model are presented in Table 1. The parameters were chosen based on an entrained slow wave frequency and propagation velocity from the experimental recordings above. The magnitude of velocity in the circumferential (horizontal) direction of the 2D model was assumed to be
  1.3 times the magnitude of velocity in the longitudinal direction, based on the porcine data (O’Grady et al., 2012b). Two different baseline 2D models were created, a normal porcine propagation model and a normal canine propagation model (Fig. 3a). The initial condition values were determined in the same way as the 1D model.
Table 1.
Parameters used to simulate the baseline models of porcine and canine gastric slow waves.
| Parameter name | Porcine model | Canine model |
|---|---|---|
| Frequency gradient (cpm) | 3.3–2.7 | 4.9–4.0 |
Longitudinal conductivity (S mm
|
0.085 | 0.22 |
Circumferential conductivity (S mm
|
0.155 | 0.36 |
Fig. 3.
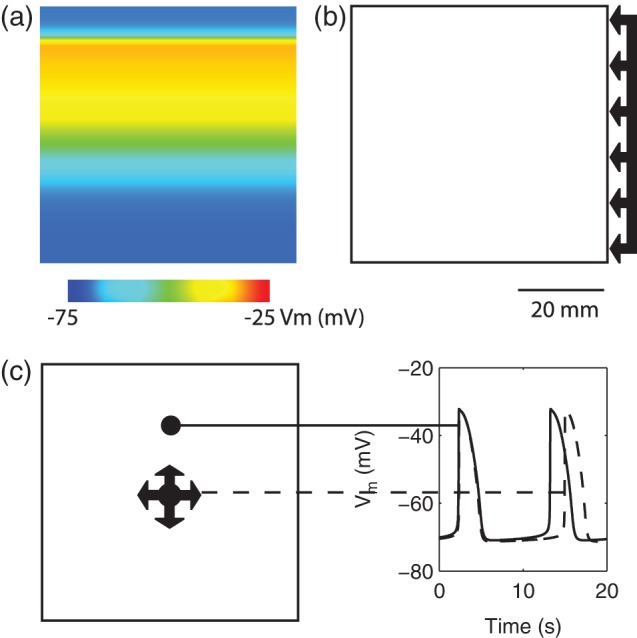
2D model setup for simulating re-entry. (a) An example of the simulated slow wave activity in the porcine baseline model. Propagations in both baseline models were assumed to be planer and antegrade. (b) Rotor activity was initiated by a field-stimulus (single-pulse; 100μA mm ; 500 ms) applied to the right boundary of the porcine baseline model. (c) Figure-of-eight activity was initiated by a point stimulus (single-pulse; 100μA mm
 ; 500 ms) applied to a centre zone in which the activation durations of slow waves and frequency were both reduced (dashed line) compared with the normal slow waves (solid-line).
Two separate re-entrant models were thus created to reproduce and inform experimental observations in different species with different frequency and velocity profiles (Fig. 1). In all cases of re-entry simulations, an animation of the simulated slow waves was generated to better demonstrate the complex spatiotemporal profile of re-entry. Rotor re-entry was simulated using the porcine baseline model and figure-of-eight re-entry was simulated using the canine baseline model. In each simulation study, a different set of stimulus and cellular parameters were used:
3.2.1. Rotor re-entry
A standard technique to invoke a cardiac rotor re-entry is via a line field stimulus applied in the perpendicular direction to the propagating wavefront (Spach, 2001). A field stimulation protocol (single-pulse; 100μA mm ; 500 ms) was administered to the right-hand boundary of the 2D domain (Fig. 3b); to test the effects of this pacing protocol, the onset of stimulus was delayed by 1500 and 3000 ms relative to the original protocol. In a separate simulation, a second pacing stimulus of the same protocol was administered to a location along the re-entrant pathway at the tip of the wave in an attempt to terminate the re-entrant activity. Finally, the same field stimulation protocol was tested to invoke rotor re-entry in the baseline canine model.
3.2.2. Figure-of-eight re-entry
A standard method of invoking figure-of-eight re-entry is by creating a heterogeneity zone in the centre of the simulation domain (Tran et al., 2007). A group of cells in a small central zone (CZ;  mm
mm were prescribed to reduce the intrinsic frequency of the simulated slow waves in this region from 4.5 cpm in the baseline model to 2.8 cpm as shown in Fig. 3(c). A point simulation protocol (single-pulse; μA mm
 ; 500 ms) was then administered to the CZ to invoke an ectopic event 1.3 s following the repolarization in the antegrade propagation in this region. The same variations in pacing protocols were tested by delaying the onset of stimulus by 500 ms. Maintenance of the re-entry was also tested by changing the intrinsic frequency in the CZ back to 4.5 cpm. A similar attempt was made to terminate the re-entrant activity by applying a second stimulus of the same protocol along the re-entrant pathway to the tips of the wave. Finally, figure-of-eight re-entry in the porcine baseline model was tested by increasing the area of the CZ to
  mm
mm and reducing the intrinsic frequency from 3 cpm in the porcine baseline model to 1.5 cpm.
Wave lengths of simulated slow waves during baseline and re-entry were measured. A relationship between longitudinal wave separation and slow wave frequency was measured in accordance to a previous intestinal functional re-entry (Angeli et al., 2013), i.e. depolarization to depolarization distance between two successive wavefronts. Similarly, circumference separation distance was also measured.
4. Results
4.1. Entrainment simulations
The performance of slow wave entrainment in a 1D model is presented in Fig. 4. An example of entrained slow waves of different intrinsic frequencies (4.9–4.0 cpm) to a single frequency over 11 selected sites along the 1D model is demonstrated in Fig. 4(b). In the entrained model, slow waves were constantly phase-locked over time, thereby forming a wavefront with consistent velocity (12 mm s and direction, from the location with the highest intrinsic frequency to the lowest intrinsic frequency, i.e. from the left to the right in Fig. 4(a). In contrast, due to the existence of the intrinsic activities, unentrained slow waves still occurred even when the cell models were electrically uncoupled from each other, as shown in Fig. 4(c). Rather than forming a single coherent wavefront with consistent velocity and propagation over time, sequences of activations were disorganized, and depended purely on the timing of the intrinsic slow wave, as demonstrated by the variable phase-lag between the simulated slow waves in Fig. 4(c).
Fig. 4.

1D entrainment model simulation setup and results. (a) A 60-mm long 1D element was developed with a gradient of intrinsic frequencies as indicated by the dashed-line, with the maximum intrinsic frequency on the left and the minimum intrinsic frequency on the right. The triangles indicate the locations of the simulated traces presented in (b) and (c) (top: left-most triangle; bottom: right-most triangle). (b) Entrained slow waves at the selected locations along the 1D model (prescribed intrinsic frequency gradient: 4.9–4.0 cpm). (c) Decoupled slow waves selected at the same locations along the 1D model and over the same prescribed intrinsic frequencies as (b). (d) Velocity as a function of conductivity at two different intrinsic frequency ranges (canine: 4.9–4.0 cpm, solid-line; porcine: 3.3–2.7 cpm, dashed-line). (e) Velocity as a function of intrinsic frequency gradients at two starting frequencies (canine: 4.9 cpm, solid-line; porcine: 3.3 cpm, dashed-line).
We then examined the effects of conductivity and gradient of intrinsic frequency on slow wave propagation velocity, as shown in Fig. 4(d,e), respectively. In these results, it should be noted that these relationships will somewhat differ in vivo, because the simplified cellular model was not intended to reproduce detailed sub-cellular mechanisms of ICC slow wave generation as achieved elsewhere (Lees-Green et al., 2011). Compared with previous slow wave entrainment modelling studies (Buist et al., 2010; Du et al., 2010a, b, c, 2013a), the present study defined conductivity parameters over two separate intrinsic frequency gradients to reproduce baseline slow wave propagation in two different species, and the effects of varying the intrinsic frequency gradients were then examined. The characterization of these parameters was required to reproduce the re-entrant activities in the 2D models. The specific effects of conductivity and gradient of intrinsic frequencies are presented in Sections 4.1.1 and 4.1.2.
4.1.1. Conductivity
Velocity of propagation demonstrated the expected trend of higher conductivity leading to faster velocity in the 1D model (Fig. 4d), which was consistent with a voltage-dependent propagation mechanism. The maximum and minimum prescribed intrinsic frequencies (porcine: 3.3–2.7 cpm vs canine: 4.9–4.0 cpm) did not appear to significantly affect this relationship, except between 0.2 and 0.8 S mm , where the canine frequency range displayed higher velocities than the porcine model. The simulated slow waves captured the full range of porcine baseline gastric slow wave velocities (6.8–13.3 mm s
 (Egbuji et al., 2010), as well as full range of canine baseline gastric slow wave velocities (5–15 mm s
 (Lammers et al., 2009). It should also be noted that a ‘threshold’ conductivity of 0.05 S mm
 existed, below which slow waves still occurred but could not be entrained, similar to the activities shown in Fig. 4(c).
4.1.2. Intrinsic frequency gradient
Propagation velocity was affected by the gradient of frequencies given the same conductivity (0.5 S mm in the 1D model, with smaller gradients correlating with faster velocities (Fig. 4(e)). However, the starting frequency did affect the velocity in this case, with the higher initial frequency (4.9 cpm, solid-line in Fig. 4(e)) leading to faster velocity over the similar frequency gradients as the lower starting frequency (3.3 cpm, dashed-line in Fig. 4(e)).
The difference between the highest prescribed intrinsic frequency and the resulting entrainment frequency was also notable. For example, the range of 4.9–4.0 cpm resulted in an entrainment frequency of 4.8 cpm (open-circles in Fig. 4(e)), which was slightly lower than the highest prescribed frequency of 4.9 cpm. Furthermore, like velocity, entrainment frequency was also dependent on the frequency gradient, as demonstrated in Fig. 4(e). In general, a lower conductivity and/or smaller frequency gradient led to a slightly higher entrained frequency, though the effect was minimal.
4.2. Rotor re-entry simulations
4.2.1. Initiation
Rotor re-entry was invoked by the field-stimulus in the right-hand side edge of the 2D model, following a normal antegrade propagation wavefront (Supplementary Animation 2). The role of the antegrade wavefront was critical in the rotor formation. The refractory tail first enabled slow wave activity to only be invoked in the top portion of the 2D model ( s, porcine: rotor, in Fig. 5(b)), and it also caused the invoked propagation to meander, eventually forming the rotor in the counter clockwise direction (
 s, porcine: rotor, in Fig. 5(b)). The rotor was formed when the tip of the wave completed the pathway around the core and entrained the next cycle of re-entrant activity ahead of both the normal entrainment and the intrinsic activity (
 s, porcine: rotor, in Fig. 5(b)). The curvature of the tip of the wave was convex, which suggest that the re-entry was radiating outward, and each cell on the propagating wavefront will be activating more than one cell downstream of the re-entry (Comtois et al., 2005).
Fig. 5.

2D model ( mm
mm simulation results over 20 s. (a) Simulated normal porcine slow waves. (b) Rotor activity induced in the normal porcine model. (c) Simulated normal canine slow wave propagation. Note the faster propagation of the canine slow waves compared with the porcine slow waves. (d) Figure-of-eight activity induced in the normal canine model.
The initiation of the rotor activity was dependent on the relative timing of the stimulus to the normal antegrade wavefront. When the onset of stimulus was delayed by up to 1500 ms, the rotor shifted distally and circumferential drift over successive cycles also occurred (Supplementary Animation 2). However, at 1000 ms delay, the rotor activity was eliminated and stimulus invoked a wave propagating in the circumferential direction (Supplementary Animation 2). The direction of the invoked wave was not maintained over the subsequent cycles of activities.
4.2.2. Maintenance
The stable rotor led to a higher frequency than the normal porcine activity (7.5 vs 3.3 cpm), which ‘out-paced’ both normal antegrade activity and intrinsic ICC activation. During the maintenance phase, there was a notable steady drift of rotor across the 2D model (Supplementary Animation 2), as has been observed experimentally in intestinal re-entry (Lammers et al., 2012). Over successive cycles, as the circumferential propagation entrained more of the tissue, the rotor was advanced at a speed of  0.2 mm s
 . The meander of the rotor was facilitated by the faster circumferential velocity component. There was also a significant reduction in the propagation speed of slow waves in both directions compared with the baseline activities (Table 2), which was also evident in the reduction of the wave length and wave separation distances (Table 3).
Table 2.
Velocities of simulated baseline and re-entrant slow waves with respect to the principal axes of the 2D model, compared with the experimental recordings.
Longitudinal velocity: simulation (mm s
|
Longitudinal velocity: recording mm s
|
Circumferential velocity: simulation (mm s
|
Circumferential velocity: recording (mm s
|
|
|---|---|---|---|---|
| Porcine: baseline | 8.5 |  |
11.1 | NA |
| Canine: baseline | 13.6 |  |
16.9 | NA |
| Porcine: rotor | 3.1 |  |
4.6 |  |
| Canine: figure-of-eight | 4.6 |  |
6.5 |  |
 Standard deviation.
Table 3.
Frequency and wave measurements of simulated re-entrant activities.
| Frequency (cpm) | Wave length (mm) | Longitudinal wave separation (mm) | Circumferential wave separation (mm) | Meander velocity (mm s
|
|
|---|---|---|---|---|---|
| Porcine: Baseline | 3.3 | 17 | NA | NA | NA |
| Porcine: rotor | 7.5 | 6 | 17 | 19 | 0.2 |
| Porcine: figure-of-eight | 7.5 | 6 | 17 | 19 | NA |
| Canine: baseline | 4.8 | 31 | NA | NA | NA |
| Canine: rotor | 10.2 | 7 | 19 | 21 | 0.1 |
| Canine: figure-of-eight | 10.2 | 7 | 19 | 21 | NA |
4.2.3. Termination
The rotor was terminated when a second stimulus was administered to the tip of wave along the re-entrant pathway just prior to the next cycle of re-entrant activity (Supplementary Animation 2). The terminated re-entrant activity progressed into an unstable ectopic pacemaker that was eventually entrained by an antegrade wave underpinned by the normal intrinsic frequency gradient.
4.2.4. Rotor re-entry in canine model
The same protocol used to invoke rotor re-entry in the porcine model was also capable of invoking rotor re-entry in the canine baseline model (Supplementary Animation 3). The similar trend that was observed in the porcine rotor re-entry model was also observed in the canine rotor model. The stable rotor led to a higher frequency than the normal canine activity (10.2 vs 4.8 cpm), as shown in Table 3, which was comparable with the experimental values reported by Lammers et al. (2008) in the same species. The meander of the rotor was  0.1 mm s
 , which was slower than in the porcine model.
4.3. Figure-of-eight re-entry simulations
4.3.1. Initiation
Figure-of-eight re-entry was invoked by the point-stimulus in the centre of the 2D model, following a normal antegrade propagation wavefront (Supplementary Animation 4). The initial antegrade wavefront played a similar critical role in the formation of the figure-of-eight re-entry as it did in the formation of the rotor re-entry. The retreating refractory tail of the antegrade wavefront induced an asymmetrical emergence of invoked slow waves from the stimulus site, with the emerging invoked wavefront being initially stopped by a functional block formed by the refractory tail of the antegrade wave immediately distal to the CZ ( s, canine: figure-of-eight, in Fig. 5(d)). This asymmetry in conduction allowed the two ‘tails’ of the emerging spiral wave in the retrograde direction to travel the re-entrant pathway and ultimately entrain the stimulus site prior to the arrival of the subsequent antegrade wavefront, leading to a sustained re-entry pattern (
 s, canine: figure-of-eight, in Fig. 5(d)). The curvatures of the tips of the waves were also convex, similar to the simulated rotor re-entry.
The initiation of the figure-of-eight activity was also dependent on the relative timing of the stimulus to the normal antegrade wavefront. When the onset of stimulus was delayed by 500 ms, the retrograde propagation around the re-entrant pathway was eliminated and an ectopic pacemaker occurred in its place (Supplementary Animation 4). This ectopic activation was only sustained over three cycles, after which the ectopic activity was eliminated by the intrinsic frequency gradient, as has also been observed experimentally (O’Grady et al., 2011). A similar effect was simulated by restoring the intrinsic frequency in the CZ to the normal value. In this case, the initial retrograde propagation around the re-entrant pathway was not able to entrain the pacing site (Supplementary Animation 4).
4.3.2. Maintenance
As in the rotor re-entry case, the figure-of-eight re-entry also led to an elevated entrainment frequency compared with the normal activity (10.2 vs 4.8 cpm), with a reduction in wave length (Table 3). However, unlike the rotor re-entry simulation, the figure-of-eight simulation did not demonstrate a meandering profile. The ectopic wave emerged in an elliptical profile with the major axis corresponding to the faster circumferential propagation. Due to the symmetry in conduction on both sides of the core, the re-entrant pathway was also symmetric over successive cycles, so the figure-of-eight did not meander. There was a similar reduction in the propagation speed of slow waves in both directions compared with the baseline activities (Table 2).
4.3.3. Termination
The figure-of-eight re-entry could be effectively terminated when a second stimulus was administered to the tip of the wave along the entrant pathway, preventing the re-entrant activity from entraining and effectively turning the re-entrant activity into an ectopic pacemaker (Supplementary Animation 4). The subsequent cycles of slow wave progressed in a similar fashion as when the initial stimulus was delayed by 500 ms. The three cycles of ectopic activations following the second stimulus were also unstable and the normal propagation direction was eventually re-established in accordance to the direction of the underlying intrinsic frequency gradient.
4.3.4. Figure-of-eight re-entry in porcine model
The same protocol used to invoke figure-of-eight re-entry in the canine model was unable to invoke the same re-entry pattern in the porcine model. The lower entrainment frequency in the porcine model than the canine model essentially acted as a refractory block to re-entry, identical to the effects by eliminating the heterogeneity prescribed to the CZ (Supplementary Animation 4). When the size of the CZ was increased to  mm
mm , the re-entrant pathway was long enough so that when the slow wave came back to the site of initiation, it was able to invoke another cycle of re-entry (Supplementary Animation 4). The figure-of-eight re-entry also led to an elevated entrainment frequency compared with the normal porcine activity (7.5 vs 3.3 cpm). It is also worth note that due to the increased length of the re-entrant pathway the core of the re-entry in the porcine model segregated into two rotor re-entry cores in time.
5. Discussion
The presence of complex spatiotemporal gastric slow wave dysrhythmias have been identified by the recent application of HR mapping techniques (Lammers et al., 2008; O’Grady et al., 2011, 2012a). However, unlike the well-documented experimental evidence and predictive mathematical models of cardiac dysrhythmias (e.g. Spach, 2001; Trayanova, 2012), the events underpinning gastric dysrhythmias remain poorly characterized. Experimentally, the current uncertainty in the conditions required to reliably invoke gastric re-entry in animal models is a current limitation. Therefore, the stimulus-driven re-entry simulation strategy applied in this study provided a useful in silico method to quantitatively evaluate gastric re-entry.
These results detail two types of spontaneously occurring functional gastric re-entrant activities and represent a detailed modelling analysis of the mechanisms underpinning initiation, maintenance and termination of the re-entry. As may be anticipated, both the initiation and maintenance of slow wave re-entry were shown to be highly dependent on the stimulus timing, conductivity and intrinsic frequency gradient. The simulation results suggested that there is a relatively narrow range of timing window during which the stimulus could successively invoke and maintain a re-entry. For example, when the stimulus was delayed by 500 ms, it invoked an unsustainable ectopic activity rather than a figure-of-eight re-entry (Supplementary Animation 4). This finding could partly explain why, to date, gastric re-entry has only been observed to occur in a minority of gastric dysrhythmia episodes and often as spontaneous events (Lammers et al., 2008; O’Grady et al., 2011, 2012a). The simulations also evaluated a potential targeted approach to therapeutic pacing of gastric dysrhythmias, and demonstrated for the first time that these dysrhythmic activities may be readily terminated via pacing (Supplementary Animations 2 and 4). In both cases, the re-entrant activities were immediately terminated by the second stimuli applied to an specific zone of the model, followed by a few cycles of ectopic activations, before resumption of entrainment by the normal activity in the antegrade direction. In addition, the simulations also demonstrated that a single targeted delivery of stimulus to the tip of re-entrant wave could be used to eliminate tachygastria, and allowing a period of rest for the normal slow wave conduction to re-establish itself. This pacing protocol would have the advantage of not requiring continuous and energy-intensive pacing (Zhang & Chen, 2006), and could now be evaluated in experimental studies using HR mapping methods (Du et al., 2010b).
5.1. Frequency–velocity relationship
In this study, an important simulation finding was that gastric re-entry could be associated with a reduction in propagation velocity (Table 2), while maintaining entrainment at a frequency above the highest intrinsic slow wave frequency of the underlying gastric tissue. This ‘conduction velocity restitution’ phenomenon has been well documented in the cardiac field (Weber et al., 2011), and a reduced velocity associated with a shortened refractory period during tachycardia has been proposed to favour cardiac re-entrant circuits (Kleber & Rudy, 2004). A similar ‘restitution’ effect may also influence slow wave conduction, where tachygastria established by the re-entry could reduce both the wave separation and conduction velocity. The experimental analysis of this effect could be indirectly inferred by comparing gastric slow wave velocities of baseline activity to velocities during tachygastria in separate species—canine (baseline: 15 mm s , 5.0 cpm; tachygastria: 6 mm s
 , 11.8 cpm) (Lammers et al., 2008, 2009); and porcine (baseline: 8.3 mm s
 , 3.2 cpm; tachygastria: 5 mm s
 , 4.4 cpm) (Egbuji et al., 2010; O’Grady et al., 2011). However, a direct validation of this frequency–conduction relationship in the stomach has not been reported to date due to current inability to reliably invoke and maintain re-entry experimentally. In addition to the relatively long-refractory period of gastric slow waves, the re-entrant activity must also entrain the underlying intrinsic activity, which could act as the more commonly reported dynamic ‘break out’ activity that could act to cease the re-entrant circuit (Lammers et al., 2008; O’Grady et al., 2011, 2012a).
The reductions in the wave length and separation distances during re-entry compared with the baseline models were also evident in Fig. 5 and Table 3. Furthermore, the longer wave separation in the circumferential direction than in the longitudinal direction also reflected the faster propagation in the circumferential direction of the stomach. This velocity anisotropy in the stomach is intrinsic and is only apparent when velocity components are measured at a pacemaker and/or ectopic activation site where the two components of velocity could be measured independently (O’Grady et al., 2012b).
5.2. Frequency of gastric dysrhythmias
A higher conductivity in general led to a faster propagation around the re-entrant pathway, which could lead to a higher entrainment frequency, provided the re-entrant wavefront does not catch up to the refractory tail of the previous cycle, which could lead to termination of the re-entry activity (Supplementary Animations 2 and 4). The frequency gradient plays a similar role as conductivity with the exception that it imposes a directional preference for propagation, i.e. normal propagation is usually maintained in the antegrade direction down the intrinsic frequency gradient. On the other hand, if the ectopic or re-entry activations occur at a frequency lower than the entrainment frequency, then the intrinsic frequency would readily correct the abnormal activations, as has been observed experimentally (Zhang & Chen, 2006).
The tachygastria frequency associated with rotor of 11.8 cpm reported by Lammers et al. (2008) was moderately higher than the simulated rotor frequency of 7.5 cpm reported by the model; however, the simulated canine re-entrant activity reported a frequency of 10.2 cpm, which was closer to the reported value. Tachygastria frequency is a relatively easy indicator to detect in far-field recordings such as electrogastrography, which can be readily applied non-invasively (Yin & Chen, 2013). However, this inference should be made in the context of previous studies that have also clearly demonstrated that other types of spatial dysrhythmias can be associated with bradygastria and/or normal frequencies. Particularly the human stomach contains multiple frequency components simultaneously (O’Grady et al., 2011, 2012a), so tachygastria should only be used as an indicator of a specific gastric dysrhythmia subset (Lammers et al., 2008).
Established cardiac re-entry mechanisms could be used to partly explain the development of gastric re-entry. For example, both of the simulated re-entrant activities were established in the shortest re-entrant pathway, and reduced time of completing the pathway led to an elevated frequency, similar to the leading circle concept (Allessie et al., 1973). On the other hand, the conduction around a core of constant size with a curved wavefront (Fig. 5(b,d)) was more similar to the more recently proposed spiral wave concept (Janse, 1999). The electronic effect of spiral wave conduction was more pronounced in the figure-of-eight re-entry simulation (Fig. 5(d)), where the core in the CZ could serve as a current-sink, and the difference between the core and the depolarized wavefront accelerates repolarization in the active wave (Comtois et al., 2005). However, what is not currently clear in the case of gastric re-entry is the effect of individual ion conductances on the initiation and maintenance of re-entry, as have been elucidated in cardiac electrophysiology (Comtois et al., 2005). Anatomical re-entry is another important mechanism of re-entry unique to the GI tract, which has been proposed as a potential frequency-altering mechanism in the intestine (Angeli et al., 2013). To investigate this problem further, the model proposed in this study could be used to create a temporary functional block that would initiate a uni-directional propagation of slow waves around a circular geometry, representing the intestinal lumen. Furthermore, given the known evidence regarding the importance of micro-structural remodelling in causing re-entry in the heart (e.g. Rutherford et al., 2012), it is plausible that degradation and remodelling of ICC may play a similar role in the development of GI re-entry (Du et al., 2010c; Farrugia, 2008).
5.3. Stimulus-driven gastric re-entry
The proposed stimulus protocols that induced re-entry now await further experimental validation. Whereas the experimental recordings of re-entry were spontaneous (Angeli et al., 2013; Lammers et al., 2012; O’Grady et al., 2011), the simulations employed stimuli to initiate re-entry activities, which could mimic premature activity of dysrhythmic events in the stomach (Lammers et al., 2008). The same protocols will need to be validated experimentally to invoke sustained re-entry activities in animal subjects in a reliable manner. One practical concern in inducing experimental re-entry is the interaction between stimulus timing and the underlying slow wave activity (O’Grady et al., 2010b). Whereas in cardiac tissue preparations it is standard to invoke a propagation wave and then a secondary stimulus to induce re-entry (Thakor & Fishler, 1997), in GI tissue this type of preparation is less easy to achieve, given the response of the tissue to stimulus. To this end, an online identification and visualization system may be required to reliably deliver stimulus relative to the normal propagating wavefront (Bull et al., 2011).
5.4. Limitations
The above inferences must be placed within the context of a number of important limitations associated with this study. First, the recorded re-entrant activities reported in the present study were spontaneous and sporadic, and were based on a small sample size, however these patterns are well supported by previous gastric HR mapping studies (Lammers et al., 2008; O’Grady et al., 2011, 2012a). Secondly, the behaviours of the continuum models were highly dependent on the responses of the chosen cell model (Du et al., 2013a). In this study, a simplified cell model was used to compute 120 s of simulated re-entrant activities in 26 min. As demonstrated by the stability of the re-entry simulations, the voltage sensitivity of the cell model was a promoting factor in the initiation and maintenance of re-entry; yet the pathological membrane kinetics associated with gastric dysrhythmias are incompletely understood (Lees-Green et al., 2011). For example, the cell model lacked detailed ion channel kinetics, e.g., the mechano-sensitive sodium channel Na 1.5, which has been shown to influence ICC slow waves during diseases (Beyder et al., 2010; Poh et al., 2012). Thirdly, one of the conditions this study adopted was based on cardiac studies cellular changes, which were applied in order for the figure-of-eight re-entry to occur, as demonstrated in the simulation result (Fig. 5(d)). Furthermore, the present study only investigated functional re-entry with an assumption of cellular homogeneity, whereas in human diseases, ICC degradation could significantly alter the structural and material properties of the GI tissue (Faussone-Pellegrini et al., 2012; O’Grady et al., 2012a). Finally, transverse isotropic conduction was assumed for both baseline models. The relatively magnitude of the propagation in the circumferential direction was based on a previous study (O’Grady et al., 2012b), and the underlying properties of myenteric and intramuscular ICC networks were not further considered in this study.
The present study used a voltage-dependent IP mechanism to couple slow waves (Du et al., 2013a; Imtiaz et al., 2002). A number of recent studies have also proposed alternative biophysically based pacemaking mechanisms (Buist et al., 2010; Faville et al., 2009; Lees-Green et al., 2014). In particular, all of these pacemaking mechanisms focus on a type of voltage-gated ‘pacemaking unit/conductance’ for the intrinsic cycling of calcium and generation of slow wave activity, while a voltage-dependent component was required in order for the cell model to entrain its activity to an extrinsic stimulus by ‘phase-advancing’ the intrinsic calcium cycling. Details of the ICC pacemaking unit are still not yet fully understood, but may be incorporated in future models as they become available.
6. Conclusions
In conclusion, this study has provided several new insights into intrinsic slow wave frequencies, conductivities, and how coordinated stimuli influences the initiation, maintenance and termination of gastric slow wave re-entry. To translate this work to clinical relevance, gastric re-entry will now need to be evaluated in animals and humans, and pacing strategies explored to terminate re-entry. Mathematical multi-scale models that incorporate detailed ICC network structure and smooth muscle fibre information will also be important in providing improved insights about the mechanisms of slow wave perturbations when multiple cellular and tissue parameters are affected.
Funding
This work and authors were funded by grants from the National Institute of Health (R01 DK64775), the New Zealand Health Research Council, and the Riddet Institute. P.D. is supported by a New Zealand Postdoctoral Fellowship from the Rutherford Foundation Trust, and a Marsden Fast-Start Grant from the Royal Society of New Zealand. L.K.C. is supported by a Fraunhofer-Bessel Research Award from the Alexander von Humboldt Foundation and the Fraunhofer-Gesellschaft.
Supplementary material
Supplementary material is available at IMAMMB online.
References
- Allessie M.A., Bonke F.I., Schopman F.J. (1973) Circus movement in rabbit atrial muscle as a mechanism of trachycardia. Circ. Res., 33, 54–62. [PubMed] [Google Scholar]
- Angeli T.R., O’Grady G., Du P., Paskaranandavadivel N., Pullan A.J., Bissett I.P., Cheng L.K. (2013) Circumferential and functional re-entry of in vivo slow-wave activity in the porcine small intestine. Neurogastroenterol. Motil., 25, e304–e314. [DOI] [PMC free article] [PubMed] [Google Scholar]
- Beyder A., Rae J.L., Bernard C., Strege P.R., Sachs F., Farrugia G. (2010) Mechanosensitivity of Nav1.5, a voltage-sensitive sodium channel. J. Physiol., 588, 4969–4985. [DOI] [PMC free article] [PubMed] [Google Scholar]
- Buist M.L., Corrias A., Poh Y.C. (2010) A model of slow wave propagation and entrainment along the stomach. Ann. Biomed. Eng., 38, 3022–3030. [DOI] [PubMed] [Google Scholar]
- Bull S.H., O’Grady G., Cheng L.K., Pullan A.J. (2011) A framework for the online analysis of multi-electrode gastric slow wave recordings. Conf. Proc. IEEE Eng. Med. Biol. Soc., 2011, 1741–1744. [DOI] [PMC free article] [PubMed] [Google Scholar]
- Cheng L.K., Du P., O’Grady G. (2013) Mapping and modeling gastrointestinal bioelectricity: from engineering bench to bedside. Physiology (Bethesda), 28, 310–317. [DOI] [PMC free article] [PubMed] [Google Scholar]
- Comtois P., Kneller J., Nattel S. (2005) Of circles and spirals: bridging the gap between the leading circle and spiral wave concepts of cardiac reentry. Europace, 7 (Suppl. 2), 10–20. [DOI] [PubMed] [Google Scholar]
- Du P., O’Grady G., Egbuji J. U., Lammers W. J., Budgett D., Nielsen P, Windsor J. A., Pullan A. J., Cheng L. K. (2009) High-resolution mapping of in vivo gastrointestinal slow wave activity using flexible printed circuit board electrodes: methodology and validation. Ann. Biomed. Eng., 37, 839–846. [DOI] [PMC free article] [PubMed] [Google Scholar]
- Du P., O’Grady G., Cheng L.K., Pullan A.J. (2010a) A multiscale model of the electrophysiological basis of the human electrogastrogram. Biophys. J., 99, 2784–2792. [DOI] [PMC free article] [PubMed] [Google Scholar]
- Du P., O’Grady G., Davidson J.B., Cheng L.K., Pullan A.J. (2010b) Multiscale modeling of gastrointestinal electrophysiology and experimental validation. Crit. Rev. Biomed. Eng., 38, 225–254. [DOI] [PMC free article] [PubMed] [Google Scholar]
- Du P., O’Grady G., Gibbons S.J., Yassi R., Lees-Green R., Farrugia G., Cheng L. K., Pullan A. J. (2010c) Tissue-specific mathematical models of slow wave entrainment in wild-type and 5-HT(2B) knockout mice with altered interstitial cells of Cajal networks. Biophys. J., 98, 1772–1781. [DOI] [PMC free article] [PubMed] [Google Scholar]
- Du P., Gao J., O’Grady G., Cheng L.K. (2013a) A simplified biophysical cell model for gastric slow wave entrainment simulation. Conference proceedings: Annual International Conference of the IEEE Engineering in Medicine and Biology Society IEEE Engineering in Medicine and Biology Society Conference 2013, pp. 6547–6550. [DOI] [PMC free article] [PubMed] [Google Scholar]
- Du P., O’Grady G., Gao J., Sathar S., Cheng L.K. (2013b) Toward the virtual stomach: progress in multiscale modeling of gastric electrophysiology and motility. Wiley Interdiscip. Rev. Syst. Biol. Med., 5, 481–493. [DOI] [PMC free article] [PubMed] [Google Scholar]
- Egbuji J.U., O’Grady G., Du P., Cheng L.K., Lammers W.J., Windsor J.A., Pullan A.J. (2010) Origin, propagation and regional characteristics of porcine gastric slow wave activity determined by high-resolution mapping. Neurogastroenterol. Motil., 22, e292–e300. [DOI] [PMC free article] [PubMed] [Google Scholar]
- Farrugia G. (2008) Interstitial cells of Cajal in health and disease. Neurogastroenterol. Motil., 20 (Suppl. 1), 54–63. [DOI] [PubMed] [Google Scholar]
- Faussone-Pellegrini M.S., Grover M., Pasricha P.J., Bernard C.E., Lurken M.S., Smyrk T.C., Parkman H.P., Abell T.L., Snape W.J., Hasler W.L., Unalp-Arida A., Nguyen L., Koch K.L., Calles J., Lee L., Tonascia J., Hamilton F.A., Farrugia G & NIDDK Gastroparesis Clinical Research Consortium (GpCRC) (2012) Ultrastructural differences between diabetic and idiopathic gastroparesis. J Cell Mol Med 16: 1573–1581. [DOI] [PMC free article] [PubMed] [Google Scholar]
- Faville R.A., Pullan A.J., Sanders K.M., Koh S.D., Lloyd C.M., Smith N.P. (2009) Biophysically based mathematical modeling of interstitial cells of Cajal slow wave activity generated from a discrete unitary potential basis. Biophys. J., 96, 4834–4852. [DOI] [PMC free article] [PubMed] [Google Scholar]
- Huizinga J.D., Lammers W.J. (2009) Gut peristalsis is governed by a multitude of cooperating mechanisms. Am. J. Physiol. Gastrointest. Liver Physiol., 296, G1–G8. [DOI] [PubMed] [Google Scholar]
- Imtiaz M.S., Smith D.W., Van Helden D.F. (2002) A theoretical model of slow wave regulation using voltage-dependent synthesis of inositol 1,4,5-trisphosphate. Biophys. J., 83, 1877–1890. [DOI] [PMC free article] [PubMed] [Google Scholar]
- Janse M.J. (1999) Functional reentry: leading circle or spiral wave? J. Cardiovasc. Electrophysiol., 10, 621–622. [DOI] [PubMed] [Google Scholar]
- Kleber A.G., Rudy Y. (2004) Basic mechanisms of cardiac impulse propagation and associated arrhythmias. Physiol. Rev., 84, 431–488. [DOI] [PubMed] [Google Scholar]
- Koh S.D., Ward S.M., Ordog T., Sanders K.M., Horowitz B. (2003) Conductances responsible for slow wave generation and propagation in interstitial cells of Cajal. Curr. Opin. Pharmacol., 3, 579–582. [DOI] [PubMed] [Google Scholar]
- Lammers W.J., Ver Donck L., Stephen B., Smets D., Schuurkes J.A. (2008) Focal activities and re-entrant propagations as mechanisms of gastric tachyarrhythmias. Gastroenterology, 135, 1601–1611. [DOI] [PubMed] [Google Scholar]
- Lammers W.J., Ver Donck L., Stephen B., Smets D., Schuurkes J.A. (2009) Origin and propagation of the slow wave in the canine stomach: the outlines of a gastric conduction system. Am. J. Physiol. Gastrointest. Liver Physiol., 296, G1200–G1210. [DOI] [PubMed] [Google Scholar]
- Lammers W.J., Stephen B., Karam S.M. (2012) Functional reentry and circus movement arrhythmias in the small intestine of normal and diabetic rats. Am. J. Physiol. Gastrointest. Liver Physiol., 302, G684–G689. [DOI] [PubMed] [Google Scholar]
- Lees-Green R., Du P., O’Grady G., Beyder A., Farrugia G., Pullan A.J. (2011) Biophysically based modeling of the interstitial cells of Cajal: current status and future perspectives. Front. Physiol., 2, 29. [DOI] [PMC free article] [PubMed] [Google Scholar]
- Lees-Green R., Gibbons S.J., Farrugia G., Sneyd J., Cheng L.K. (2014) Computational modeling of anoctamin 1 calcium-activated chloride channels as pacemaker channels in interstitial cells of Cajal. Am. J. Physiol. Gastrointest. Liver Physiol., 306, G711–G727. [DOI] [PMC free article] [PubMed] [Google Scholar]
- O’Grady G., Du P., Cheng L.K., Egbuji J.U., Lammers W.J., Windsor J.A., Pullan A.J. (2010a) Origin and propagation of human gastric slow-wave activity defined by high-resolution mapping. Am. J. Physiol. Gastrointest. Liver Physiol., 299, G585–G592. [DOI] [PMC free article] [PubMed] [Google Scholar]
- O’Grady G., Du P., Lammers W. J. E. P., Egbuji J. U., Mithraratne P., Chen J. D. Z., Cheng L. K., Windsor J. A., Pullan A. J. (2010b) High-resolution entrainment mapping of gastric pacing: a new analytical tool. Am. J. Physiol. Gastrointest. Liver Physiol., 298, G314–G321. [DOI] [PMC free article] [PubMed] [Google Scholar]
- O’Grady G., Egbuji J.U., Du P., Lammers W.J., Cheng L.K., Windsor J.A., Pullan A.J. (2011) High-resolution spatial analysis of slow wave initiation and conduction in porcine gastric dysrhythmia. Neurogastroenterol. Motil., 23, e345–e355. [DOI] [PMC free article] [PubMed] [Google Scholar]
- O’Grady G., Angeli T. R., Du P., Lahr C., Lammers W. J., Windsor J. A., Abell T. L., Farrugia G., Pullan A. J., Cheng L. K. (2012a) Abnormal initiation and conduction of slow-wave activity in gastroparesis, defined by high-resolution electrical mapping. Gastroenterology, 143, 589–598, e581–e583. [DOI] [PMC free article] [PubMed] [Google Scholar]
- O’Grady G., Du P., Paskaranandavadivel N., Angeli T. R., Lammers W. J. E. P., Asirvatham S. J., Windsor J. A., Farrugia G., Pullan A. J., Cheng L. K. (2012b) Rapid high-amplitude circumferential slow wave propagation during normal gastric pacemaking and dysrhythmias. Neurogastroenterol. Motil., 24, e299–e312. [DOI] [PMC free article] [PubMed] [Google Scholar]
- Paskaranandavadivel N., O’Grady G., Du P., Pullan A.J., Cheng L.K. (2012) An improved method for the estimation and visualization of velocity fields from gastric high-resolution electrical mapping. IEEE Trans. Biomed. Eng., 59, 882–889. [DOI] [PMC free article] [PubMed] [Google Scholar]
- Paskaranandavadivel N., O’Grady G., Du P., Cheng L.K. (2013) Comparison of filtering methods for extracellular gastric slow wave recordings. Neurogastroenterol. Motil., 25, 79–83. [DOI] [PMC free article] [PubMed] [Google Scholar]
- Paterson D.J. (2013) Arrhythmia: 100 years on from George Ralph Mines. J. Physiol., 591, 4065–4066. [DOI] [PMC free article] [PubMed] [Google Scholar]
- Poh Y.C., Beyder A., Strege P.R., Farrugia G., Buist M.L. (2012) Quantification of gastrointestinal sodium channelopathy. J. Theor. Biol., 293, 41–48. [DOI] [PMC free article] [PubMed] [Google Scholar]
- Rutherford S.L., Trew M.L., Sands G.B., LeGrice I.J., Smaill B.H. (2012) High-resolution 3-dimensional reconstruction of the infarct border zone: impact of structural remodeling on electrical activation. Circ. Res., 111, 301–311. [DOI] [PubMed] [Google Scholar]
- Spach M.S. (2001) Mechanisms of the dynamics of reentry in a fibrillating myocardium. Developing a genes-to-rotors paradigm. Circ. Res., 88, 753–755. [DOI] [PubMed] [Google Scholar]
- Thakor N.V., Fishler M.G. (1997) Spiral waves and rotors: computational and experimental models of cardiac arrhythmias. Conference Proceedings: Annual International Conference of the IEEE Engineering in Medicine and Biology Society IEEE Engineering in Medicine and Biology Society Conference, pp. 2601–2603 [Google Scholar]
- Tran D.X., Yang M.J., Weiss J.N., Garfinkel A., Qu Z. (2007) Vulnerability to re-entry in simulated two-dimensional cardiac tissue: effects of electrical restitution and stimulation sequence. Chaos, 17, 043115. [DOI] [PubMed] [Google Scholar]
- Trayanova N.A. (2012) Computational cardiology: the heart of the matter. ISRN Cardiol., 2012, 269680. [DOI] [PMC free article] [PubMed] [Google Scholar]
- Trew M.L., Smaill B.H., Bullivant D.P., Hunter P.J., Pullan A.J. (2005) A generalized finite difference method for modeling cardiac electrical activation on arbitrary, irregular computational meshes. Math. Biosci., 198, 169–189. [DOI] [PubMed] [Google Scholar]
- Van Helden D.F., Laver D.R., Holdsworth J., Imtiaz M.S. (2010) Generation and propagation of gastric slow waves. Clin. Exp. Pharmacol. Physiol., 37, 516–524. [DOI] [PubMed] [Google Scholar]
- Weber F.M., Luik A., Schilling C., Seemann G., Krueger M.W., Lorenz C., Schmitt C., Dossel O. (2011) Conduction velocity restitution of the human atrium–an efficient measurement protocol for clinical electrophysiological studies. IEEE Trans. Biomed. Eng., 58, 2648–2655. [DOI] [PubMed] [Google Scholar]
- Yassi R., O’Grady G., Paskaranandavadivel N., Du P., Angeli T. R., Pullan A. J., Cheng L. K., Erickson J. C. (2012) The gastrointestinal electrical mapping suite (GEMS): software for analyzing and visualizing high-resolution (multi-electrode) recordings in spatiotemporal detail. BMC Gastroenterol., 12, 60. [DOI] [PMC free article] [PubMed] [Google Scholar]
- Yin J., Chen J.D. (2013) Electrogastrography: methodology, validation and applications. J. Neurogastroenterol. Motil., 19, 5–17. [DOI] [PMC free article] [PubMed] [Google Scholar]
- Zhang J., Chen J.D. (2006) Systematic review: applications and future of gastric electrical stimulation. Aliment Pharmacol. Ther., 24, 991–1002. [DOI] [PubMed] [Google Scholar]
Associated Data
This section collects any data citations, data availability statements, or supplementary materials included in this article.