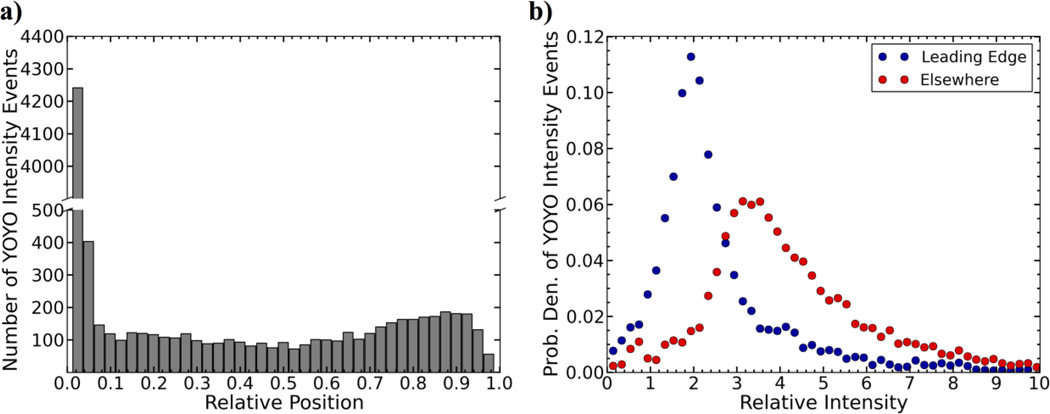
Figure 2.
(a) The relative position histogram of a YOYO intensity event. Relative position is the location of the event from the leading edge of an individual molecule relative to the total length of the molecule. The bin size is 0.025. (b) A histogram of the probability density of the YOYO fluctuation events. The two populations shown are split based on the relative position of the event within the molecule, leading edge versus everywhere else. Due to the large number of events at the leading edge, each population (leading edge and elsewhere) was normalized to one so that they could be plotted together as probability densities. The bin size is 0.2.

