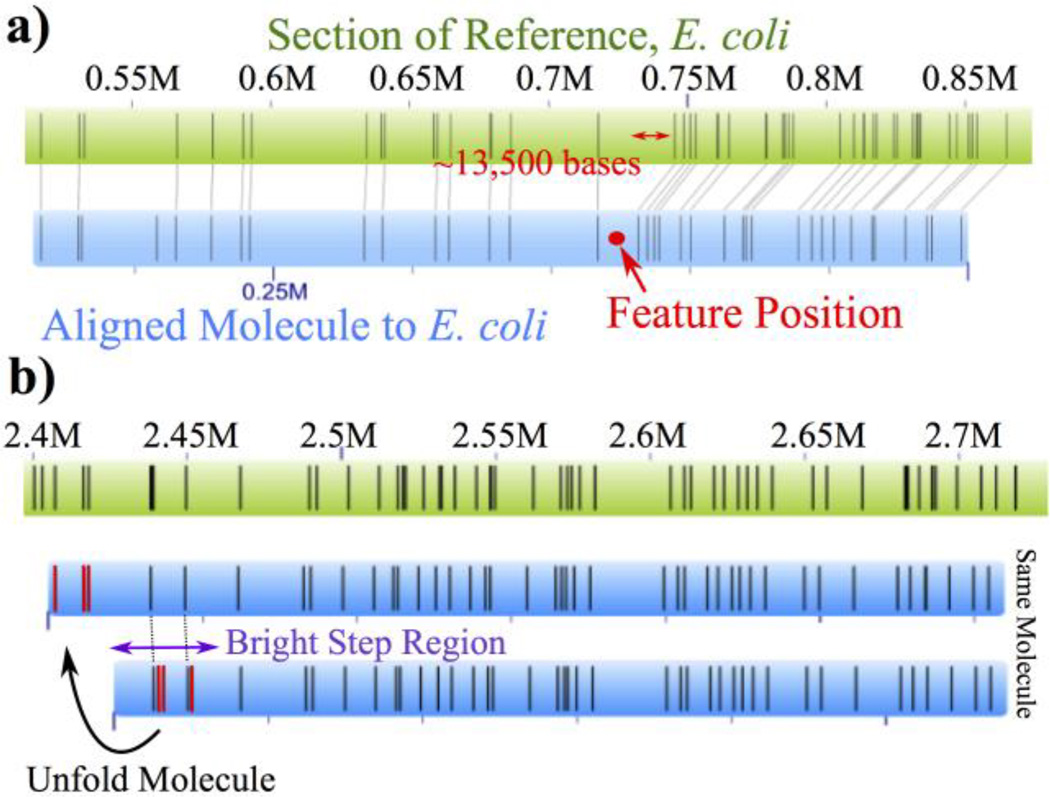
Figure 4.
(a) An example of a knot/backfold in an aligned molecule, blue, to the E. coli reference, green. The labels are shifted roughly 13,500 base pairs after the intensity spike (position in molecule shown in red). (b) An example of a folded region, highlighted by the purple arrow, within a molecule. The red insertion events do not align to the reference until the molecule is “unfolded”.

