

Abstract
The ability to predict response to neoadjuvant chemotherapy for women diagnosed with breast cancer, either before or early on in treatment, is critical to judicious patient selection and tailoring the treatment regimen. In this paper, we investigate the role of contrast agent kinetic heterogeneity features derived from breast dynamic contrast-enhanced magnetic resonance imaging (DCE-MRI) for predicting treatment response. We propose a set of kinetic statistic descriptors and present preliminary results showing the discriminatory capacity of the proposed descriptors for predicting complete and non-complete responders as assessed from pre-treatment imaging exams. The study population consisted of 15 participants: 8 complete responders and 7 non-complete responders. Using the proposed kinetic features, we trained a leave-one-out logistic regression classifier that performs with an area under the receiver operating characteristic (ROC) curve (AUC) of 0.84 under the ROC. We compare the predictive value of our features against commonly used MRI features including kinetics of the characteristic kinetic curve (CKC), maximum peak enhancement (MPE), hotspot signal enhancement ratio (SER), and longest tumor diameter that give lower AUCs of 0.71, 0.66, 0.64, and 0.54, respectively. Our proposed kinetic statistics thus outperform the conventional kinetic descriptors as well as the classifier using a combination of all the conventional descriptors (i.e., CKC, MPE, SER, and longest diameter), which gives an AUC of 0.74. These findings suggest that heterogeneity-based DCE-MRI kinetic statistics could serve as potential imaging biomarkers for tumor characterization and could be used to improve candidate patient selection even before the start of the neoadjuvant treatment.
Introduction
The use of neoadjuvant chemotherapy (NAC) in women diagnosed with breast cancer is gaining considerable acceptance [1,2]. It has been reported that NAC gives high clinical response of up to 70% to 98% and can result in a pathologic complete response (pCR) in 3% to 34% of patients [3–6]. On the other hand, it has also been reported that 2% to 30% of patients may not benefit clinically or pathologically [7]. As a result, the ability to distinguish between highly responsive and non-responsive patients is of critical importance for making treatment choices. Particularly, non-responsive patients, if detected early on, can avoid unnecessary side effects and can be routed to alternative therapies such as hormonal treatment and/or radiation therapy [8,9]. Moreover, identifying potential responders can help in planning a more focused and timely treatment regimen [5].
Traditionally, therapy response is evaluated by morphologic, clinical, and histopathologic assessment [10]. Imaging modalities such as computed tomography (CT) and magnetic resonance imaging (MRI) are used to assess tumor response primarily on the basis of tumor size reduction [11–13]. A widely used criterion for therapy response assessment is the Response Evaluation Criterion in Solid Tumors (RECIST) [14], which uses the longest diameter of the tumor as a basis. However, changes in tumor size due to therapy tend to appear after at least a couple of neoadjuvant treatment cycles [1]. Therefore, response as assessed by a reduction in tumor size can cause considerable delay in giving the appropriate treatment to partially responsive and non-responsive patients. As a result, devising methods for predicting early therapy response has been an active area of research in recent years.
A review on the use of MRI for predicting response to NAC is given in Marinovich et al. [15]. Among the work on early prediction of therapy response, correlations between NAC response and dynamic contrast-enhanced MRI (DCE-MRI) kinetic parameters such as the forward and backward volume transfer coefficients (Ktrans and kep) have been reported [16–18]. Kinetic parameters derived from multiparametric MRI using DCE-MRI and diffusion-weighted MRI have also been explored for assessing the response to NAC treatment [19]. However, the changes in kinetic parameters in the above studies have predictive value after either one or two cycles of neoadjuvant treatment. Moreover, the estimation of volume transfer coefficients such as Ktrans and kep involves a series of assumptions and models derived from the pharmacokinetics of the contrast agent distribution [20]. This leads to different estimates of the parameters due to different underlying assumptions [21], making the estimates less robust.
Hylton et al. [22] have explored morphologic and kinetic features derived from MRI such as the measurement of tumor longest diameter, changes in tumor volume, and peak signal enhancement ratio (SER) in post-treatment MR images as compared to pre-treatment images. Their analysis uses MR images acquired before treatment as well as images obtained after first, second, and third cycles of NAC treatment and shows that tumor volume, when represented as a fraction of the baseline tumor volume as assessed from pre-treatment images, has the greatest relative capacity to monitor NAC response. Another recent method from Tateishi et al. [23] investigates the prediction of pathologic response using positron emission tomography (PET) and DCE-MRI parameters. They use both the baseline imaging and images acquired after two NAC cycles. The results of Tateishi et al. report that the sensitivity of PET CT/MR after two cycles of NAC is not acceptable, while the specificity is high. One of the earlier works by Rieber et al. [24] also suggested that MR could provide information regarding response to therapy following the first cycle. Esserman et al. assessed morphologic MR phenotypes of tumors that correlated with NAC response [25]. However, the detection of these phenotypes was based on subjective and visual interpretation. Park et al. reported that pre-treatment values of mean apparent diffusion coefficient of responders were lower than that of non-responders [26].
The majority of the abovementioned methods are able to predict the NAC response only after at least a couple of treatment cycles. Among the methods that predict response based on pre-treatment imaging, the approach of Esserman et al. [25] is based on subjectively assessed morphologic phenotypes, while the method of Park et al. [26] uses an aggregate measure such as the mean apparent diffusion coefficient of the tumor. Breast tumors have been shown to be highly heterogeneous lesions [27,28], and tumor heterogeneity is emerging as one of the major challenges in prognostication and successful treatment [27]. Breast cancer heterogeneity manifests in almost all aspects of the disease including histopathologic, molecular, and functional characteristics [28]. Traditional MRI analysis have mainly focused on aggregate kinetic measures [29–32] or aggregate diffusion measures [25]. However, such aggregate measures fall short of capturing the intratumor heterogeneity that is a crucial aspect of tumor characterization [27].
In this paper, we propose to explore heterogeneities in the contrast uptake within a breast tumor to predict response to NAC based on pre-treatment imaging. Our motivation to take this approach is based on reports suggesting that aggressive tumors have heterogeneous contrast uptake distribution perhaps due to inhomogeneous vascularization and angiogenesis [33–35]. The conventional kinetic descriptors either focus on aggregate kinetic measures or subsample the tumor, making little use of the information revealed by heterogeneities in the kinetic behavior. For instance, Bhooshan et al. [36] derive a single characteristic kinetic curve (CKC) and compute only one set of kinetic features from that curve. Similarly, Loiselle et al. [37] employ the maximum peak enhancement (MPE) as a single metric for the entire tumor. However, it has been suggested that heterogeneities in the contrast agent uptake may reflect important phenotypic aspects of underlying molecular intratumor heterogeneity [38–41]. Here, we propose to tap into this potentially rich set of information for the task of predicting response to neoadjuvant chemotherapy.
Material and Methods
Study Population
The study population consisted of a subset of patients from the ACRIN 6657 ISPY trial [33], imaged at our institution between 2002 and 2006. Local institutional review board (IRB) approval was obtained before the study, and signed informed consent was obtained from all patients before enrollment. All patients presented with biopsy-proven T2 to T3 stage tumors of ductal carcinoma. The patients underwent standard neoadjuvant chemotherapy, which at the time of the study consisted of four cycles of adriamycin/cytoxan, followed by four cycles of taxotere. Core biopsy and serum samples were collected at comparable times to the MRI scans and obtained pre-treatment, between 24 and 96 hours after the start of treatment, between treatment regimens (optional), and pre-surgery. The patients were declared as complete responders or partial responders after evaluating pathologic response [33]. pCR was defined as no invasive tumor present in either breast or axillary lymph nodes. The subset population consisted of 15 patients: 8 complete responders and 7 non- complete responders.
Imaging Parameters
The imaging parameters for ISPY-1 trial have been described before elsewhere [22]. We reproduce the imaging details for completeness. MRI was performed with a 1.5-T imaging unit by using a dedicated breast radiofrequency coil. Before the start of imaging, an intravenous catheter was inserted into each patient; patients were imaged in the prone position. The MRI protocol included a localization acquisition and T2-weighted sequence, followed by a DCE series. For T2-weighted imaging, a fast spin-echo sequence with fat suppression was used in the sagittal orientation over the symptomatic breast only (two-dimensional spin echo; field of view, 1620 cm; section thickness, 3 mm; fat saturation; echo train length, 8 to 16; one echo; effective echo time, 80–140 milliseconds; repetition time, 4000–6000 milliseconds). For the contrast-enhanced series, high-spatial resolution (in-plane spatial resolution ≤ 1 mm) three-dimensional fat-suppressed T1-weighted imaging of the symptomatic breast was performed by using a gradient-echo sequence with a repetition time of 20 milliseconds or less, an echo time of 4.5 milliseconds, a flip angle of 45° or less, a 16- to 18-cm field of view, a minimum matrix of 256 × 3 × 192, and 64 sections with a thickness of 2.5 mm or less. Imaging time for the T1-weighted sequence ranged from 90 to 100 seconds, with one data set acquired before injection of a gadolinium-based contrast agent and repeated at least two times immediately after injection. The contrast agent was administered at a dose of 0.1 mmol/kg body weight over 15 seconds, followed by a 10-ml saline flush over 15 seconds. The resulting temporal sampling of the center of k-space for the first contrast-enhanced phase was between 2 minutes 15 seconds and 2 minutes 30 seconds, providing image contrast most representative of this time point. An interphase delay between the first and the second contrast-enhanced phase was used as needed to result in temporal sampling of the second contrast-enhanced phase between 7 minutes 15 seconds and 7 minutes 45 seconds.
DCE-MRI Kinetic Features
For each patient, we selected the DCE-MRI exam done before the commencement of the treatment. Lesions were segmented in a semi-automated way by seeding an active contour snake [42]. Typically, DCE-MRI acquisition includes a pre-contrast image (captured before the injection of a contrast agent) and a number of post-contrast images, captured at different time points after the injection of the contrast agent [43]. The uptake of the contrast agent by different tissues manifests itself in the form of contrast enhancement in post-contrast MR images, and the enhancement patterns have been suggested to be useful for tumor characterization [36,43].
A common way to quantify the enhancement pattern is to compute the relative enhancement as compared to the pre-contrast image [44,43]. By computing the relative enhancement on a pixel-by-pixel basis, we can construct pixel-wise maps of the relative contrast enhancement as follows:
| (1) |
where I(u, v, t) represents the intensity of pixel (u, v) captured at time t and t0 is the pre-contrast time instant. For a particular pixel, the relative enhancement plotted as a function of time is defined as the kinetic curve [43]. In the literature (e.g., [44,43]), a number of basic features can be computed from this kinetic curve as illustrated in Figure 1A. On the basis of these features, we can derive a rich kinetic feature set by computing the pixel-wise map for each feature as follows:
-
•Peak enhancement (PE):
which represents the peak relative enhancement for every pixel as computed over all post-contrast time points.(2) -
•Time to peak (TTP):
which represents the time at which peak enhancement is achieved.(3) -
•Wash-in slope (WIS):
which is a measure of the initial uptake rate of the contrast agent for every pixel.(4) -
•Wash-out slope (WOS):
where tM is the last post-contrast time instant. The wash-out slope captures the drop in the uptake rate of the contrast agent after the peak enhancement is achieved.(5)
Figure 1.
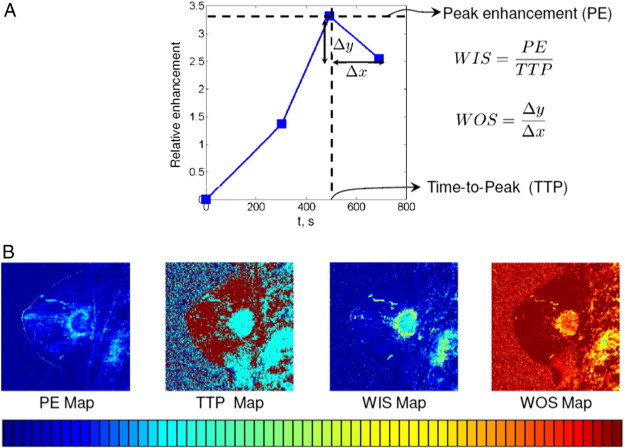
(A) Illustration of basic kinetic features for a single pixel. (B) Pixel-wise maps.
Sample pixel-wise maps of above features are depicted in Figure 1B.
Kinetic Statistic Features
To capitalize fully on the richness of the abovementioned pixel-wise kinetic feature maps, we propose to explore the contrast agent uptake heterogeneities within each of these feature maps. We draw our motivation from the fact that aggressive tumors tend to have heterogeneous contrast uptake distribution due to heterogeneous vascularization and angiogenesis [33,34]. One way to tap into the kinetic heterogeneity of a tumor is to divide the tumor pixels into clusters of homogeneity and look for patterns in feature statistics within every cluster. Specifically, we propose to partition the tumor pixels according to their kinetic behavior and compute statistics of kinetic feature maps within these partitions.
We extract these kinetic statistics in a two-phase process: In the first phase, the time to peak (TTP) for every pixel within the tumor is computed. We then cluster the pixels based on their TTP values. This step partitions the pixels into as many sets as the number of post-contrast time points, i.e., set i consists of pixels that achieve their peak enhancement at the ith post contrast time point. Figure 2 illustrates these partitions for a sample case.
Figure 2.
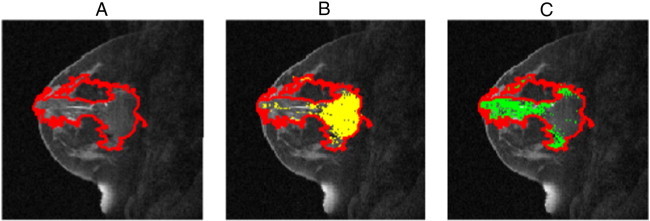
Illustration of kinetic pixel partitioning for two post-contrast time points. (A) Segmented lesion, (B) set 1 pixels that achieve peak enhancement at the first post-contrast time point (highlighted in yellow), and (C) set 2 pixels that achieve peak enhancement at the second post-contrast time point (highlighted in green).
In the second step, pixel-wise maps of the following features are computed: peak enhancement (PE), wash-in slope (WIS), and wash-out-slope (WOS) (Figure 1). On the basis of these pixel groupings, we compute partition-wise kinetic statistics as follows: Let M be the pixel partitioning such that Mk represents the membership mapping of pixel k to its respective set. Given M, one can derive the following set-wise statistics:
-
•Posterior probability of observing set i given the partition M:
where δ(Mk = i) is an indicator function that equals 1 when Mk = i, and zero otherwise. N is the total number of pixels. These N pixels may come from an arbitrarily shaped segmentation mask specifying the lesion.(6) -
•Mean value of feature map j for set i:
where fj(k) is the value of the jth feature map for kth pixel, and the feature map can be any of those shown in Figure 1B.(7) -
•Variance of feature map j for set i:
(8)
On the basis of the above definitions, m pixel partitions and n feature maps would result into a total of m(2n + 1) features. We aim to investigate the utility of these partition-wise kinetic statistics for the task of predicting response to neoadjuvant chemotherapy for breast cancer.
For feature extraction, the most representative slice in an image sequence was chosen as the slice for which the lesion area was maximized. The selection of the representative slice was confirmed by a board-certified radiologist. Given the representative slice, we computed the kinetic statistics as defined in the Results section. For this data set, we had two post-contrast time points, and on the basis of the TTP values, the pixels were partitioned into two sets (m = 2). Within these partitions, we computed statistics for three feature maps (n = 3), i.e., PE, WIS, and WOS. This resulted in m(2n + 1) = 14 kinetic statistics. As DCE-MRI morphologic features (e.g., tumor size and shape) have also been shown to be associated with different tumor grade [40], in our feature vector we also included tumor area and perimeter to measure tumor size and ellipticity and convexity to capture the shape of the tumor [45,46]. Therefore, in total we had 14 kinetic features and 4 morphologic features.
Classification Experiments
To evaluate the performance of individual features, we trained a leave-one-out single feature logistic regression classifier using each of the features individually. Receiver operating characteristic (ROC) analysis was performed, and the area under the ROC curve (AUC) was computed. To evaluate the collective performance of our features, we also trained a multivariate logistic regression classifier with leave-one-out cross-validation. For each leave-one-out loop, we performed sequential forward feature selection using the training examples for the current loop, i.e., all examples but the currently left out case. Using the selected features, a logistic regression classifier was learned on the basis of the training set and was tested on the unseen left out test example. The process was then repeated for all leave-one-out loops. ROC analysis was done to assess the performance of multivariate classifiers. To assess the importance of features, selection frequencies of features over all cross-validation folds were evaluated.
Comparison with Previous Work
We compare the predictive value of our features against the following commonly used MRI features:
-
•
Kinetic features of the CKC [36,47]: On the basis of this method, kinetic curves were computed for all the tumor pixels, and each kinetic curve was represented as an M dimensional vector, where M is the number of time points. Fuzzy C means clustering was then run on these M dimensional vectors to group similar kinetic curves, and the centroid of each cluster was termed as a prototype kinetic curve. The number of centroids was selected using the same approach as Chang et al. [47], in which the authors set the number of centroids to either N/160 or 2, whichever is greater, where N is the number of tumor pixels. From among the prototype kinetic curves, the curve with the maximum initial uptake was chosen as the CKC, and the following kinetic features for the CKC were computed: peak enhancement, time to peak, wash-in slope, and wash-out slope. A leave-one-out logistic regression classifier similar to the one for multifeature classification scheme as described above was trained.
-
•
Hotspot SER [43]: SER at every pixel was computed as , where S0, S1, and S2 are the signal intensities at the pre-contrast, first post-contrast, and second post-contrast time points. A hotspot SER value was defined as the highest eight-connected voxel average over the tumor volume, and a leave-one-out logistic regression classifier was trained using hotspot SER values.
-
•
MPE [37]: Kinetic curves for all the pixels were first computed, and the peak enhancement for each curve was evaluated. The MPE value for each lesion was then detected and a leave-one-out logistic regression classifier based on MPE was trained.
-
•
Longest diameter [14]: The longest diameter of a tumor is a standard metric that forms the basis of the RECIST [14]. A leave-one-out logistic regression classifier was trained on the basis of the longest diameter values.
-
•
Pooled conventional features: Finally, we trained a classifier model with leave-one-out feature selection by pooling all the conventional features described in this section (i.e., CKC, SER, MPE, and longest diameter).
Results
AUC under ROCs for single feature classifiers are shown in Table 1. Single feature classifiers for 12 of 14 kinetic statistics perform with AUCs ranging from 0.73 to 0.81, while two of the kinetic features and all the morphologic features perform close to chance. The best single feature performance (AUC = 0.81) was given by the mean peak enhancement for set 2 pixels, μ(2, PE). This analysis suggests that partition-based kinetic statistics potentially possess univariate discriminatory power to predict responders versus non- complete responders from their pre-treatment images.
Table 1.
Performance of Single Feature Classifiers. Column 2 Shows Feature Names Following the Notation of Equations (6) to (8), e.g., μ(1, PE) Represents the Mean Feature Map Value of Peak Enhancement for Set 1 Pixels. Column 3 Shows the AUC under the ROC for Each Feature
| No. | Feature | ROC-AUC |
|---|---|---|
| 1 | P(Set = 1|M) | 0.76 |
| 2 | P(Set = 2|M) | 0.76 |
| 3 | μ(1, PE) | 0.77 |
| 4 | μ(2, PE) | 0.81 |
| 5 | σ2(1, PE) | 0.78 |
| 6 | σ2(2, PE) | 0.73 |
| 7 | μ(1, WIS) | 0.77 |
| 8 | μ(2, WIS) | 0.81 |
| 9 | σ2(1, WIS) | 0.78 |
| 10 | σ2(2, WIS) | 0.73 |
| 11 | μ(1, WOS) | 0.77 |
| 12 | μ(2, WOS) | 0.53 |
| 13 | σ2(1, WOS) | 0.75 |
| 14 | σ2(2, WOS) | 0.54 |
| 15 | Ellipticity | 0.52 |
| 16 | Circularity | 0.51 |
| 17 | Perimeter | 0.53 |
| 18 | Area | 0.51 |
The ROC curve for multivariate classifier based on the proposed features along with a comparison against previously used features is shown in Figure 3. Classifier based on the proposed features has an AUC of 0.84 (SE = 0.088, P = .015) under the ROC curve. Comparison of statistical significance, standard errors, and 95% confidence intervals for the AUCs corresponding to classification models based on proposed features and previously used standard features is given in Table 2. The comparison against commonly used approaches shows that the classifier based on our proposed kinetic statistics outperforms classifiers using conventional descriptors as well as the classifier based on pooling all the conventional descriptors.
Figure 3.
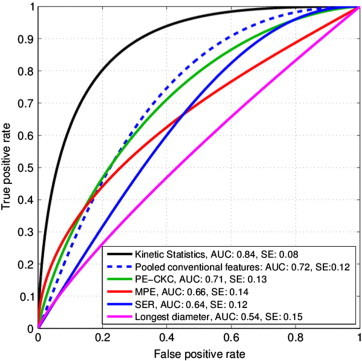
ROC comparison with standard features. The classifier based on our proposed kinetic statistics outperforms standard kinetic descriptors and the longest diameter that form the basis of the RECIST criterion. The dotted blue ROC represents the case when all the conventional features were pooled together.
Table 2.
Comparison of Statistical Significance, Standard Errors, and 95% Confidence Intervals for the AUCs Corresponding to Classification Models Based on Proposed Features and Previously Used Standard Features
| Features | AUC | Standard Error | P Value | 95% Confidence Interval |
|
|---|---|---|---|---|---|
| Lower Bound | Upper Bound | ||||
| Kinetic statistics | 0.84 | 0.088 | .015 | 0.697 | 1.000 |
| Pooled conventional features | 0.72 | 0.125 | .154 | 0.455 | 0.994 |
| PE-CKC | 0.71 | 0.132 | .165 | 0.436 | 0.992 |
| MPE | 0.66 | 0.144 | .355 | 0.332 | 0.954 |
| SER | 0.64 | 0.122 | .563 | 0.271 | 0.908 |
| Longest diameter | 0.54 | 0.152 | .728 | 0.243 | 0.864 |
Selection frequencies of features over all cross-validation folds are given in Table 3. Most frequently selected features included mean peak enhancement for set 2 pixels, variance in peak enhancement for set 1 pixels, and mean wash-out slope for set 1 pixels. Representative contrast uptake patterns for the selected features along with their corresponding box plots are shown in Figure 4. A visualization matrix of squared correlation coefficients (R2) between features is shown in Figure 5.
Table 3.
Selection Frequencies of Features over All Leave-One-Out Classification Loops. Column 2 Shows Feature Names Following the Notation of Equations (6) to (8), e.g., μ(1, PE) Represents the Mean Feature Map Value of Peak Enhancement for Set 1 Pixels. Column 3 Shows the Selection Frequency of Each Feature. Frequencies ≥ 50% Are Shown in Bold
| No. | Feature | Selection Frequency (%) |
|---|---|---|
| 1 | P(Set = 1|M) | 0/15 (0.0%) |
| 2 | P(Set = 2|M) | 0/15 (0.0%) |
| 3 | μ(1, PE) | 2/15 (13.3%) |
| 4 | μ(2, PE) | 14/15 (93.3%) |
| 5 | σ2(1, PE) | 12/15 (80.0%) |
| 6 | σ2(2, PE) | 1/15 (6.7%) |
| 7 | μ(1, WIS) | 0/15 (0.0%) |
| 8 | μ(2, WIS) | 0/15 (0.0%) |
| 9 | σ2(1, WIS) | 0/15 (0.0%) |
| 10 | σ2(2, WIS) | 0/15 (0.0%) |
| 11 | μ(1, WOS) | 12/15 (80.0%) |
| 12 | μ(2, WOS) | 0/15 (0.0%) |
| 13 | σ2(1, WOS) | 0/15 (0.0%) |
| 14 | σ2(2, WOS) | 0/15 (0.0%) |
| 15 | Ellipticity | 0/15 (0.0%) |
| 16 | Circularity | 0/15 (0.0%) |
| 17 | Perimeter | 0/15 (0.0%) |
| 18 | Area | 0/15 (0.0%) |
Figure 4.
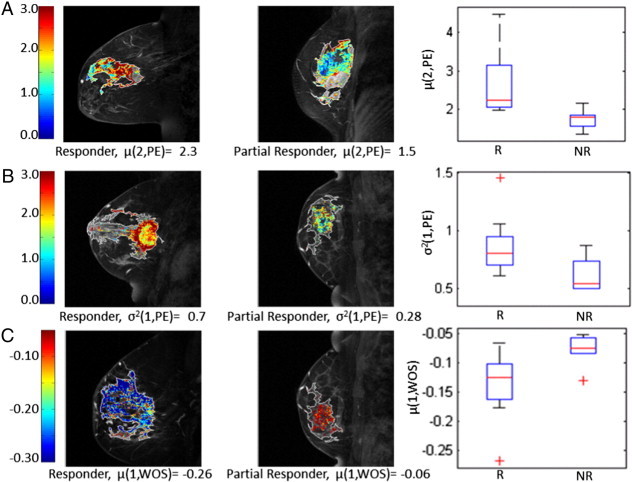
Representative contrast uptake patterns for the selected features. (A) Examples for pixel-wise maps of peak enhancement (PE) for set 2 pixels (TTP = second post-contrast time point). Complete responders have higher values of PE (i.e., red), causing the mean PE within set 2 pixels, μ(2, PE) to be higher than that of partial responders as depicted in the box plot for μ(2, PE). (B) Examples for pixel-wise maps of PE for set 1 pixels (TTP = first post-contrast time point). Complete responders have more variance in their set 1 PE values as depicted in the box plot for σ2(1, PE). (C) Examples for pixel-wise maps of wash-out slope (WOS) for set 1 pixels (TTP = first post-contrast time point). Complete responders have more rapid WOS (i.e., more negative shown as blue), compared to partial responders.
Figure 5.
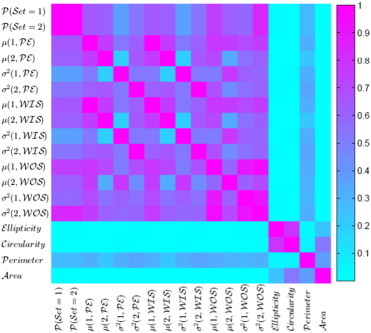
Visualization of the matrix of squared correlation coefficients (R2) between features.
Discussion
In this paper, we have presented preliminary results showing that heterogeneity kinetic statistics derived from DCE-MRI feature maps (peak enhancement, wash-in slope, and wash-out slope) are significant predictors of response to neoadjuvant chemotherapy. We have shown that these statistics have predictive ability when derived from a DCE-MRI exam done before the commencement of the treatment. Most existing methods [16,1,48] become predictive after at least two cycles of neoadjuvant treatment. The ability to predict response before the start of the treatment can help in selecting the patients that are expected to benefit the most from the treatment, while routing the anticipated non-responders and partial responders to alternative therapies. Moreover, the classifier based on our proposed kinetic statistics outperforms the classifiers using standard kinetic descriptors. Our proposed statistics capitalize on the heterogeneities in the contrast agent uptake within the tumor and the improvement is in line with studies suggesting the importance of kinetic heterogeneities for tumor characterization [43], as they can be potential markers of the underlying molecular intratumor heterogeneity [38–41].
Our results also indicate that different contrast uptake patterns exist for completely responding and partially responding tumors, including more pronounced enhancement, rapid washout, and heterogeneous uptake for the responding tumors (Figure 4), suggesting a more aggressive tumor phenotype, potentially due to higher vascularity and/or more progressed neo-angiogenic properties. For instance, the visualization and box plot in Figure 4A show that responding tumors have higher values of mean peak enhancement for set 2 pixels. The second row of Figure 4 shows that responding tumors have higher variance in the peak enhancement of their rapidly enhancing regions (i.e., TTP = 1). In Figure 4C, we show how washout characteristics differ between complete responders and partial responders. Specifically, responding tumors have a more steeper washout slope for their rapidly enhancing regions. This analysis suggests that tumors with pronounced and heterogeneous enhancement as well as rapid washout are more likely to respond to neoadjuvant chemotherapy. These results are in agreement with current oncologic literature [33,34], indicating that more biologically aggressive tumors have better response to neoadjuvant treatment.
While the majority of kinetic statistics (12 of 14) had univariate discriminatory capacity to predict responders versus partial responders, we should note that only three were consistently selected by the feature selection step, leading to a sparse classification model. This is primarily due to correlations among the extracted kinetic features. On the basis of the visualization of squared correlation coefficients between features in Figure 5, it can be seen that there are strong correlations between the corresponding kinetic statistics (mean and variance) of peak enhancement and wash-in slope. Since wash-in slope is a scalar multiple of peak enhancement (WIS = PE/TTP), it is straightforward to show that their respective statistics are also scalar multiples of each other (i.e., μ(i, WIS) = μ(i, PE)/TTP) and σ2(i, WIS) = σ2(i, PE)/TTP2)), and normalizing the features would lead to perfect correlations between them as represented in Figure 5.
Compared to the kinetic features, morphologic descriptors demonstrated poor performance. We must note, however, that morphologic features have little or no correlation with kinetic features as illustrated by the visualization of the inter-feature correlations (Figure 5). This perhaps highlights the point that while their information might not be helpful for the particular task of pre-treatment therapy response prediction, morphologic features capture different information compared to kinetic features. In this paper, we have focused on images captured before the initiation of the treatment begins. As the treatment progresses, changes in the morphology during the actual treatment process, rather than the a priori imaging, can represent a measure of response as has been explored in previous studies. Moreover, while RECIST longest diameter is traditionally used to evaluate the response to therapy, we also intended to investigate if tumor diameter before the initiation of the treatment could be a predictor of response as well, and an ROC-AUC of 0.5 suggests that it is not.
Important limitations of the current work must also be noted. First, although promising, our analysis has been done on a relatively small data set (15 patients), which has almost equal number of complete responders and partial responders, whereas in a standard NAC treatment regimen, the expected number of complete responders is around 25% [33], and therefore larger studies are warranted to confirm generalizability of our findings. Nevertheless, we have employed cross-validation in our experiments to assess generalization, and the selected features appear to be fairly consistent across different cross-validation loops. We should note that the temporal resolution of images used in this study is low with only three time points (i.e., one pre-contrast and two post-contrast). However, we would like to highlight that the proposed methodology is independent of the temporal resolution and the number of post-contrast time points. For future studies, images are being captured at higher temporal resolution. In addition, the features are currently extracted from a representative two-dimensional slice of the primary lesion. Kinetic partitioning of the entire three-dimensional volume of the lesion could potentially lead to richer statistics, especially in the case of multifocal tumors, which may further improve the prediction of therapy response in the future. As mentioned earlier, pCR was assessed on the basis of no invasive cells in the excised tumor at the time of the surgery, which is the norm for other NAC studies. However, foci for ductal carcinoma in-situ (DCIS) might still be present, which should be investigated in future studies. Finally, integrating proposed imaging biomarkers with T2-weighted and diffusion-weighted imaging as well as with tumor histopathology and molecular subtypes holds the promise for better therapy response prediction and improved clinical decision making for individual patients and tumor subtypes.
Conclusions
In this paper, we have investigated the role of heterogeneity kinetic statistic features derived from breast DCE-MRI images for predicting neoadjuvant treatment response as assessed from imaging exams done before the treatment. We train a leave-one-out logistic regression classifier, which when tested on unseen test cases performs with AUC = 0.84 under the ROC curve. This analysis is based on a leave-one out feature selection and we show that kinetic statistics capturing the extent of contrast enhancement, uptake heterogeneity, and washout characteristics are among consistently selected features across cross-validation folds. We compare the predictive value of our features against that of commonly MR features including kinetics of CKC, hotspot SER, MPE, and longest diameter, which give lower AUCs of 0.71, 0.66, 0.64, and 0.54, respectively. These findings suggest that DCE-MRI heterogeneity kinetic statistics can be used to improve candidate patient selection even before the start of the neoadjuvant treatment. Larger studies are warranted to validate our findings in independent populations.
Acknowledgements
We thank the I-SPY-1 TRIAL team for the permission to use the I-SPY trial data and useful discussions on this research work.
Footnotes
This work was supported by a pilot grant from the University of Pennsylvania Center for Biomedical Image Computing and Analytics.
References
- 1.Loo C.E., Teertstra H.J., Rodenhuis S., van de Viver D.A., Hannemann J., Muller D.A., Peteters M.J., Gilhuijs K.G. Dynamic contrast-enhanced MRI for prediction of breast cancer response to neoadjuvant chemotherapy: initial results. AJR Am J Roentgenol. 2008;191:1331–1338. doi: 10.2214/AJR.07.3567. [DOI] [PubMed] [Google Scholar]
- 2.Le-Petross H.C., Hylton N. Role of breast MR imaging in neoadjuvant chemotherapy. Magn Reson Imaging Clin N Am. 2010;18(2):249–258. doi: 10.1016/j.mric.2010.02.008. [DOI] [PubMed] [Google Scholar]
- 3.Rastogi P., Anderson S.J., Bear H.D., Geyer C.E., Kahlenberg M., Robidoux A., Margolese R., Hoehn J., Vogel V., Dakhil S. Preoperative chemotherapy: updates of National Surgical Adjuvant Breast and Bowel Project Protocols B-18 and B-27. J Clin Oncol. 2008;26:778–785. doi: 10.1200/JCO.2007.15.0235. [DOI] [PubMed] [Google Scholar]
- 4.Bonadonna G., Valagussa P., Brambilla C., Ferrari L., Moliterni A., Terenziani D.A., Zambetti M. Primary chemotherapy in operable breast cancer: eight-year experience at the Milan Cancer Institute. J Clin Oncol. 1998;16:93–100. doi: 10.1200/JCO.1998.16.1.93. [DOI] [PubMed] [Google Scholar]
- 5.Bear H.D., Anderson S., Brown A., Smith R., Mamounas E., Fisher B., Margolese R., Theoret H., Soran A., Wickerham D. The effect on tumor response of adding sequential preoperative docetaxel to preoperative doxorubicin and cyclophosphamide: preliminary results from National Surgical Adjuvant Breast and Bowel Project Protocol B-27. J Clin Oncol. 2003;21:4165–4174. doi: 10.1200/JCO.2003.12.005. [DOI] [PubMed] [Google Scholar]
- 6.Makris A., Powles T.J., Ashley S.E., Chang J., Hickish T., Tidy V.A., Nash A.G., Ford H.T. A reduction in the requirements for mastectomy in a randomized trial of neoadjuvant chemoendocrine therapy in primary breast cancer. Ann Oncol. 1998;9:1179–1184. doi: 10.1023/a:1008400706949. [DOI] [PubMed] [Google Scholar]
- 7.Smith I.C., Heys S.D., Hutcheon A.W., Miller I., Payne S., Gilbert F., Ah-See A., Eremin O., Walker L., Sarkar T. Neoadjuvant chemotherapy in breast cancer: significantly enhanced response with docetaxel. J Clin Oncol. 2002;20:1456–1466. doi: 10.1200/JCO.2002.20.6.1456. [DOI] [PubMed] [Google Scholar]
- 8.Cuzick J., Sestak I., Pinder S.E., Ellis I.O., Forsyth S., Bundred N.J., Forbes J.F., Bishop H., Fentiman I.S., George W.D. Effect of tamoxifen and radiotherapy in women with locally excised ductal carcinoma in situ: long-term results from the UK/ANZ DCIS trial. Lancet Oncol. 2011;21(1):21–29. doi: 10.1016/S1470-2045(10)70266-7. [DOI] [PMC free article] [PubMed] [Google Scholar]
- 9.Correa C., McGale P., Taylor C., Wang Y., Clarke M., Davies C., Peto R., Bijker N., Solin L., Darby S. Overview of the randomized trials of radiotherapy in ductal carcinoma in situ of the breast. J Natl Cancer Inst Monogr. 2010;41:162–177. doi: 10.1093/jncimonographs/lgq039. [DOI] [PMC free article] [PubMed] [Google Scholar]
- 10.Thoeny H.C., Ross B.D. Predicting and monitoring cancer treatment response with diffusion-weighted MRI. J Magn Reson Imaging. 2010;32(1):2–16. doi: 10.1002/jmri.22167. [DOI] [PMC free article] [PubMed] [Google Scholar]
- 11.Chen J.H., Bahri S., Mehta R.S., Kuzucan A., Yu H.J., Carpenter P.M., Feig S.A., Lin M., Hsiang D.J., Lane K.T. Breast cancer: evaluation of response to neoadjuvant chemotherapy with 3.0-T MR imaging. Radiology. 2011;261(3):735–743. doi: 10.1148/radiol.11110814. [DOI] [PMC free article] [PubMed] [Google Scholar]
- 12.McLaughlina R., Hylton N. MRI in breast cancer therapy monitoring. NMR Biomed. 2011;24:712–720. doi: 10.1002/nbm.1739. [DOI] [PMC free article] [PubMed] [Google Scholar]
- 13.Arlinghaus L.R., Li X., Levy M., Smith D., Welch E.B., Gore J.C., Yankeelov T.E. Current and future trends in magnetic resonance imaging assessments of the response of breast tumors to neoadjuvant chemotherapy. J Oncol. 2010:919620. doi: 10.1155/2010/919620. [DOI] [PMC free article] [PubMed] [Google Scholar]
- 14.Therasse P., Arbuck S.G., Eisenhauer E.A., Wanders D.A., Kaplan R.S., Rubinstein D.A., Verweij J., Glabbeke D.A., van Oosterom A.T.A.T., Christian M.C. New guidelines to evaluate the response to treatment in solid tumors. J Natl Cancer Inst. 2000;92(3):205–216. doi: 10.1093/jnci/92.3.205. [DOI] [PubMed] [Google Scholar]
- 15.Marinovich M.L., Sardanelli D.A., Ciatto S., Mamounas D.A., Brennan M., Macaskill D.A., Irwig L., von Minckwitz D.A., Houssami N. Early prediction of pathologic response to neoadjuvant therapy in breast cancer: systematic review of the accuracy of MRI. Breast. 2012;21(5):669–677. doi: 10.1016/j.breast.2012.07.006. [DOI] [PubMed] [Google Scholar]
- 16.Ah-See M.L.W., Makris A., Taylor N.J., Harrison M., Richman P., Burcombe R., Stirling J., d’Arcy J.A., Collins D.J., Pittam M.R. Early changes in functional dynamic magnetic resonance imaging predict for pathologic response to neoadjuvant chemotherapy in primary breast cancer. Clin Cancer Res. 2008;14(20):6580–6589. doi: 10.1158/1078-0432.CCR-07-4310. [DOI] [PubMed] [Google Scholar]
- 17.Li X., Arlinghaus L., Ayers G.D., Chakravarthy A.B., Abramson D.A., Abramson V.G., Atuegwu N., Farley J., Mayer I.A., Kelley M.C. DCE-MRI analysis methods for predicting the response of breast cancer to neoadjuvant chemotherapy: pilot study findings. Magn Reson Med. 2014;71(4):1592–1602. doi: 10.1002/mrm.24782. [DOI] [PMC free article] [PubMed] [Google Scholar]
- 18.Etxano J., Insausti L.P., Elizalde A., López-Vega D.A., Plazaola A., Martínez P. Analysis of the changes induced by bevacizumab using a high temporal resolution DCE-MRI as prognostic factors for response to further neoadjuvant chemotherapy. Acta Radiol. 2014 doi: 10.1177/0284185114556098. Oct 27. [pii: 0284185114556098, Epub ahead of print] [DOI] [PubMed] [Google Scholar]
- 19.Li X., Abramson R.G., Arlinghaus L.R., Kang H., Chakravarthy A.B., Abramson D.A., Farley J., Mayer D.A., Kelley M.C., Meszoely D.A. Multiparametric magnetic resonance imaging for predicting pathological response after the first cycle of neoadjuvant chemotherapy in breast cancer. Invest Radiol. 2015;50(4):195–204. doi: 10.1097/RLI.0000000000000100. [DOI] [PMC free article] [PubMed] [Google Scholar]
- 20.Cha S., Yang L., Johnson G., Lai A., Chen M.H., Tihan T., Wendland M., Dillon W. Comparison of microvascular permeability measurements, Ktrans, determined with conventional steady-state T1-weighted and first-pass T2*-weighted MR imaging methods in gliomas and meningiomas. AJNR Am J Neuroradiol. 2006;27:409–417. [PMC free article] [PubMed] [Google Scholar]
- 21.Tofts P.S., Brix G., Buckly D.L., Evelhoch J.L., Henderson E., Knopp M.V., Larsson H.B., Lee T.Y., N.A N.A.M., Parker G.J. Estimating kinetic parameters from dynamic contrast-enhanced T1-weighted MRI of diffusable tracer: standardized quantities and symbols. J Magn Reson Imaging. 1999;10:223–323. doi: 10.1002/(sici)1522-2586(199909)10:3<223::aid-jmri2>3.0.co;2-s. [DOI] [PubMed] [Google Scholar]
- 22.Hylton N.M., Blume J.D., Bernreuter W.K., Pisano D.A., Rosen M.A., Morris D.A., Weatherall P.T., Lehman C.D., Newstead G.M., Polin S. Locally advanced breast cancer: MR imaging for prediction of response to neoadjuvant chemotherapy—results from ACRIN 6657/I-SPY TRIAL. Radiology. 2012;263(3):663–672. doi: 10.1148/radiol.12110748. [DOI] [PMC free article] [PubMed] [Google Scholar]
- 23.Tateishi U., Miyake M., Nagaoka T., Terauchi T., Kubota K., Kinoshita T., Daisaki H., Macapinlac D.A. Neoadjuvant chemotherapy in breast cancer: prediction of pathologic response with PET/CT and dynamic contrast-enhanced MR imaging—prospective assessment. Radiology. 2012;263(1):53–63. doi: 10.1148/radiol.12111177. [DOI] [PubMed] [Google Scholar]
- 24.Rieber A., Zeitler H., Rosenthal H., Gorich J., Kreienberg R., Brambs H.J., Tomczak R. MRI of breast cancer: influence of chemotherapy on sensitivity. Br J Radiol. 1997;70(833):452–458. doi: 10.1259/bjr.70.833.9227225. [DOI] [PubMed] [Google Scholar]
- 25.Esserman L., Kaplan E., Partridge S., Tripathy D., Rugo H., Park J., Hwang S., Kuerer H., Sudilovsky D., Lu Y. MRI phenotype is associated with response to doxorubicin and cyclophosphamide neoadjuvant chemotherapy in stage III breast cancer. Ann Surg Oncol. 2001;8(6):549–559. doi: 10.1007/s10434-001-0549-8. [DOI] [PubMed] [Google Scholar]
- 26.Park S.H., Moon W.K., Cho N., Song I.C., Chang J.M., Park I.A., Han W., Noh D.Y. Diffusion-weighted MR imaging: pretreatment prediction of response to neoadjuvant chemotherapy in patients with breast cancer. Radiology. 2010;257(1):56–63. doi: 10.1148/radiol.10092021. [DOI] [PubMed] [Google Scholar]
- 27.Marusyk A., Polyak K. Tumor heterogeneity: causes and consequences. Biochim Biophys Acta. 2010;1805(1):105–117. doi: 10.1016/j.bbcan.2009.11.002. [DOI] [PMC free article] [PubMed] [Google Scholar]
- 28.Almendro V., Fuster G. Heterogeneity of breast cancer: etiology and clinical relevance. Clin Transl Oncol. 2011;13:767–773. doi: 10.1007/s12094-011-0731-9. [DOI] [PubMed] [Google Scholar]
- 29.Chen W., Giger M.L., Lan L., Bick U. Computerized interpretation of breast mri: investigation of enhancement-variance dynamics. Med Phys. 2004;31:1076–1082. doi: 10.1118/1.1695652. [DOI] [PubMed] [Google Scholar]
- 30.Lee S.H., Kim J.H., Cho N., Park J.S., Yang Z., Jung Y.S., Moon W.K. Multilevel analysis of spatiotemporal association features for differentiation of tumor enhancement patterns in breast DCE-MRI. Med Phys. 2010;37 doi: 10.1118/1.3446799. [DOI] [PubMed] [Google Scholar]
- 31.Zheng Y., Englander S., Baloch S., Zacharaki E.I., Fan Y., Schnall M.D., Shen D. STEP: spatiotemporal enhancement pattern for MR-based breast tumor diagnosis. Med Phys. 2009;37(7):3192–3204. doi: 10.1118/1.3151811. [DOI] [PMC free article] [PubMed] [Google Scholar]
- 32.Agner S., Soman S., Libfeld E., McDonald M., Thomas K., Englander S., Rosen M.A., Chin D., Nosher J., Madabhushi A. Textural kinetics: a novel dynamic contrast-enhanced (DCE)-MRI feature for breast lesion classification. J Digit Imaging. 2011;24(3):446–463. doi: 10.1007/s10278-010-9298-1. [DOI] [PMC free article] [PubMed] [Google Scholar]
- 33.Esserman L.J., Berry D.A., Cheang M.C.U., Yau C., Perou C.M., Carey L., DeMichele A., Gray J.W., Conway-Dorsey K., Lenburg D.A. Chemotherapy response and recurrence-free survival in neoadjuvant breast cancer depends on biomarker profiles: results from the I-SPY 1 TRIAL (CALGB 150007/150012; ACRIN 6657) Breast Cancer Res Treat. 2012;132(3):1049–1062. doi: 10.1007/s10549-011-1895-2. [DOI] [PMC free article] [PubMed] [Google Scholar]
- 34.Loo C.E., Straver M.E., Rodenhuis S., Muller S.H., Wesseling J., Peeters D.A., Gilhuijs K.G. Magnetic resonance imaging response monitoring of breast cancer during neoadjuvant chemotherapy: relevance of breast cancer subtype. J Clin Oncol. 2011;29:660–666. doi: 10.1200/JCO.2010.31.1258. [DOI] [PubMed] [Google Scholar]
- 35.Weinstein S., Rosen M. Breast MR imaging: current indications and advanced imaging techniques. Radiol Clin North Am. 2010;48(5):1013–1042. doi: 10.1016/j.rcl.2010.06.011. [DOI] [PubMed] [Google Scholar]
- 36.Bhooshan N., Giger M.L., Jansen S.A., Li H., Lan L., Newstead G.M. Cancerous breast lesions on DCE MR images: computerized characterization for image based prognostic markers. Radiology. 2010;254(3):680–690. doi: 10.1148/radiol.09090838. [DOI] [PMC free article] [PubMed] [Google Scholar]
- 37.Loiselle C.R., Eby P.R., Peacock S., Kim J.N., Lehman C.D. Dynamic contrast-enhanced magnetic resonance imaging and invasive breast cancer: primary lesion kinetics correlated with axillary lymph node extracapsular extension. J Magn Reson Imaging. 2011;33(1):96–101. doi: 10.1002/jmri.22389. [DOI] [PubMed] [Google Scholar]
- 38.Szabó B.K., Aspelin P., Kristoffersen M.W., Tot T., Boné B. Invasive breast cancer: correlation of dynamic MR features with prognostic factors. Eur Radiol. 2003;13(11):2425–2435. doi: 10.1007/s00330-003-2000-y. [DOI] [PubMed] [Google Scholar]
- 39.Tse G.M., Chaiwun B., Wong K.T., Yeung D.K., Pang A.L., Tang A.P., Cheung H.S. Magnetic resonance imaging of breast lesions—a pathologic correlation. Breast Cancer Res Treat. 2007;103(1):1–10. doi: 10.1007/s10549-006-9352-3. [DOI] [PubMed] [Google Scholar]
- 40.Tozaki M. Interpretation of breast MRI: correlation of kinetic and morphological parameters with pathological findings. Magn Reson Med Sci. 2004;3(4):189–197. doi: 10.2463/mrms.3.189. [DOI] [PubMed] [Google Scholar]
- 41.Ashraf A.B., Daye D., Gavenonis S., Mies C., Feldman M., Rosen M., Kontos D. Identification of intrinsic imaging phenotypes for breast cancer tumors: Preliminary associations with gene expression profiles. Radiology. 2014;272(2):374–384. doi: 10.1148/radiol.14131375. [DOI] [PMC free article] [PubMed] [Google Scholar]
- 42.Kass M., Witkin A., Terzopoulos D. Snakes: active contour models. Int J Comput Vis. 1988;1(4):321–331. [Google Scholar]
- 43.Hylton N. MR imaging for assessment of breast cancer response to neoadjuvant chemotherapy. Magn Reson Imaging Clin N Am. 2006;14(3):383–389. doi: 10.1016/j.mric.2006.09.001. [DOI] [PubMed] [Google Scholar]
- 44.Lee S.H., Kim J.H., Cho N., Park J.S., Yang Z., Jung Y.S., Moon W.K. Multilevel analysis of spatiotemporal association features for differentiation of tumor enhancement patterns in breast DCE-MRI. Med Phys. 2010;37:3940. doi: 10.1118/1.3446799. [DOI] [PubMed] [Google Scholar]
- 45.Stojmenovic M., Nayak A. Proceedings of the 2nd Pacific Rim Conference on Advances in Image and Video Technology. Springer-Verlag; Berlin/Heidelberg, Germany: 2007. Direct ellipse fitting and measuring based on shape boundaries; pp. 221–235. (PSIVT’07). [Google Scholar]
- 46.Chang R.F., Wu W.J., Moon W.K., Chen D.R. Automatic ultrasound segmentation and morphology based diagnosis of solid breast tumors. Breast Cancer Res Treat. 2005;89(2):179–185. doi: 10.1007/s10549-004-2043-z. [DOI] [PubMed] [Google Scholar]
- 47.Chen W., Giger M.L., Bick U., Newstead G.M. Automatic identification and classification of characteristic kinetic curves of breast lesions on DCE-MRI. Med Phys. 2006;33:2878–2887. doi: 10.1118/1.2210568. [DOI] [PubMed] [Google Scholar]
- 48.Partridge S.C., Vanantwerp D.A., Doot R.K., Chai X., Kurland B.F., Eby P.R., Specht J.M., Dunnwald L.K., Schubert E.K., Lehman C.D. Association between serial dynamic contrast-enhanced MRI and dynamic 18F-FDG PET measures in patients undergoing neoadjuvant chemotherapy for locally advanced breast cancer. J Magn Reson Imaging. 2010;32(5):1124–1131. doi: 10.1002/jmri.22362. [DOI] [PMC free article] [PubMed] [Google Scholar]