Abstract
N-Glycanase 1, encoded by NGLY1, catalyzes the deglycosylation of misfolded N-linked glycoproteins retrotranslocated into the cytosol. We identified nine cases with mutations in NGLY1. The patients show developmental delay, seizures, peripheral neuropathy, abnormal liver function and alacrima (absence of tears). The mutations in NGLY1 resulted in the absence of N-glycanase 1 protein in patient-derived fibroblasts. Applying a recently established cellular deglycosylation-dependent Venus fluorescence assay, we found that patient fibroblasts had dramatically reduced fluorescence, indicating a pronounced reduction in N-glycanase enzymatic activity. Using this assay, we could find no evidence of other related activities. Our findings reveal that NGLY1 mutations destroy both N-glycanase 1 protein and enzymatic activity.
Keywords: deglycosylation-dependent venus (ddVenus) fluorescence assay, N-glycanase 1 deficiency, Z-VAD
Introduction
N-Glycanase 1, encoded by NGLY1, catalyzes the deglycosylation of misfolded N-glycosylated proteins by cleaving the β-aspartyl glycosylamine linkage of the glycan and the amide side chain of asparagine (Asn), converting Asn to aspartic acid (Asp) (Takahashi 1977; Blom et al. 2004; Katiyar et al. 2004). This glycoamidase, also called peptide-N-glycosidase (PNGase), is highly conserved across species (Plummer et al. 1984; Suzuki et al. 2000; Xin et al. 2008; Funakoshi et al. 2010; Masahara-Negishi et al. 2012). PNGase orthologs share a catalytic transglutaminase domain that is essential for PNGase activity (Suzuki 2007). In higher eukaryotes, the orthologs also have an N-terminal PUB domain [binding to a p97 involved in endoplasmic–reticulum-associated protein degradation (ERAD)] (Suzuki et al. 2001; Allen et al. 2006) and a C-terminal mannose-binding domain, which contributes to the oligosaccharide-binding specificity of PNGase (Zhou et al. 2006).
It has been shown that the deglycosylation activity of PNGase plays critical roles in protein quality control by the mechanism of ERAD owing to the fact that N-glycanase 1 cleavage of the attached N-glycans precedes proteasomal degradation (Hirsch et al. 2003, 2004). In addition, cytosolic PNGase-mediated deglycosylation is also required for class I major histocompatibility complex antigen presentation (Altrich-VanLith et al. 2006; Kario et al. 2008). Using whole-genome and -exome sequencing, we recently identified nine cases with mutations in NGLY1. Patients have global developmental delay, movement disorder, hypotonia, alacrima and moderately elevated liver transaminases (Enns et al. 2014). We analyzed patient-derived fibroblasts for RNA and protein using multiple biochemical assays and a newly developed assay for N-glycanase 1 activity.
Results and discussion
N-Glycanase 1 deficiency in patient fibroblasts
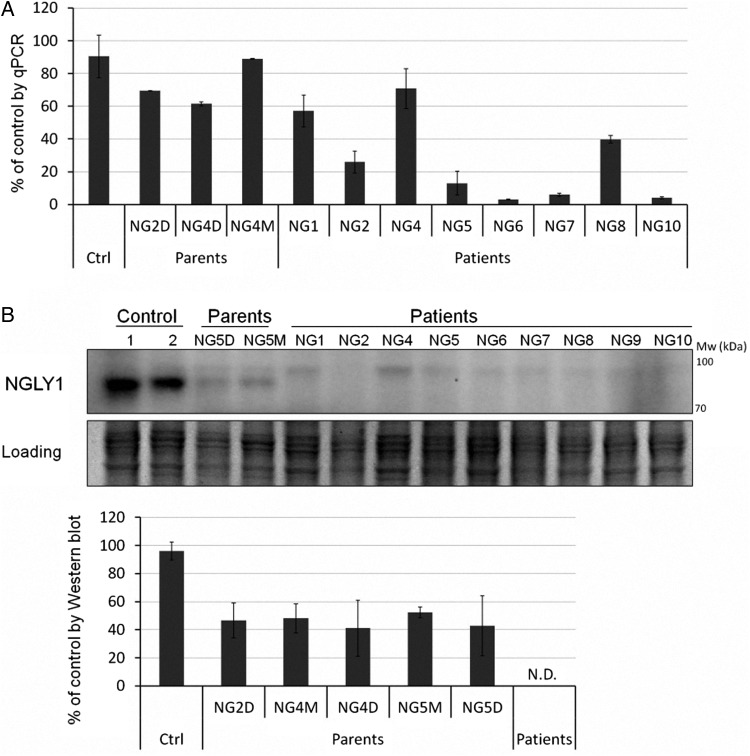
The NGLY1 mutations in nine patients are summarized in Table I. Clinical description of six patients (NG1, 2, 4, 5, 6 and 7) were reported previously (Enns et al. 2014; Caglayan et al. 2015). We cultured dermal fibroblasts derived from nine patients, five parents of three patients (NG2, 4 and 5) and four healthy controls. mRNA of NGLY1 was reduced by 30–97% in all patient cells (Figure 1A). Among the mutations, the homozygous nonsense mutation R401X (in patient NG5, NG6 and NG7) is the most detrimental, reducing mRNA by 87–97%, consistent with the expected nonsense-mediated mRNA decay (NMD) (Mendell and Dietz 2001). And this nonsense mutation leads to the absence of NGLY1 protein in patients bearing this mutation compared with 40–50% reduction in parent cells (Figure 1B). Overexpression of NGLY1 in HEK293 cells confirmed the identity of the protein band (data not shown). Surprisingly, the other mutations also result in the absence of detectable NGLY1 protein (Figure 1B). The greatest discrepancy between mRNA and protein levels was seen in patients NG1 and NG4 (Figure 1), suggesting that the heterozygous frameshift (NG1) and the single amino acid deletion (NG4) may cause protein misfolding and degradation. However, NGLY1 protein was not restored by treating cells with proteosome inhibitor, MG132 for 8 h (data not shown). This result suggests that the mutations lead to defective translation.
Table I.
Mutations in N-glycanase 1
| Patient | Mutations |
|---|---|
| NG1 (Enns et al. 2014) | Exon 8: c.1201A>T (p.R401X) Exon 12: c.C1891del (p.Q631fs) |
| NG2 (Caglayan et al. 2015) | Exon 12: homozygous 4 bp deletion c.1533_1536delTCAA, leading to premature termination (p.N511KfsX51) |
| NG4 (Enns et al. 2014) | Exon 8: c.1205_1207del (R402del) Exon 11: c.1570C>T (p.R524X) |
| NG5 (Enns et al. 2014) | Exon 8: Homozygous c.1201A>T (p.R401X) |
| NG6a (Enns et al. 2014) | Exon 8: Homozygous c.1201A>T (p.R401X) |
| NG7a (Enns et al. 2014) | Exon 8: Homozygous c.1201A>T (p.R401X) |
| NG8 | Exon 5: c.730T>C (p.W244R) Exon 6: c.931G>A (p.E311K) |
| NG9a | Exon 4: c.622C>T (p.Q208X) Exon 6: c.930C>T (p.G310G near splice site) |
| NG10a | Exon 4: c.622C>T (p.Q208X) Exon 6: c.930C>T (p.G310G near splice site) |
aPatients NG6, 7 and NG9, 10 are siblings.
Fig. 1.
NGLY1 mRNA and protein levels are decreased in patient fibroblasts. (A) qPCR analysis of NGLY1 mRNA. Total RNA was extracted from control, patients' parents and patients’ fibroblasts followed by cDNA synthesis. Specific primer pairs (Table II) targeting human NGLY1 gene and human housekeeping gene HPRT were used in qPCR reactions to amplify the target gene (see Materials and methods). For each sample, dual replicates were run. Each error bar in the histogram represents SD of at least three independent assays. (B) Western blot analysis of N-glycanase 1. Total lysates were harvested from control, patients’ parents and patients’ fibroblasts followed by western blot analysis (top panel). Protein Coomassie blue stain serves as loading control. The lower graphs were plotted based on the quantification of western blot data. Gray intensity of N-glycanase 1 band was divided by that of the loading control to normalize the N-glycanase 1 level. The normalized N-glycanase 1 value of each cell is divided by that of the control to obtain the relative value for each individual fibroblast line. Each error bar in the histogram represents SD of 3–4 independent assays. Individual NG2D is dad of patient NG2. NG4D and NG4M are dad and mom of patient NG4, respectively. NG5D and NG5M are dad and mom of patient NG5, respectively. ND, not detected.
Cellular deglycosylation-dependent assay shows absence of N-glycanase 1 enzymatic activity in patient fibroblasts
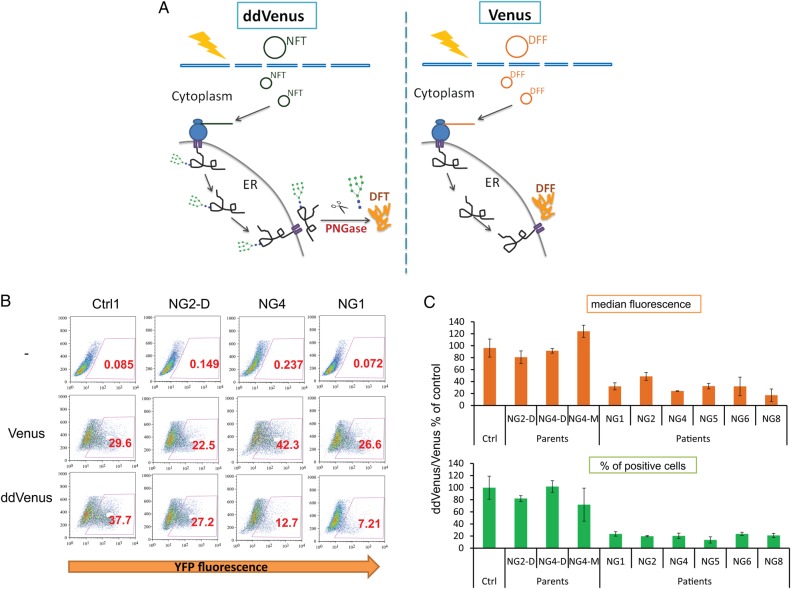
We recently reported the development of a system to analyze ERAD based on mutants of split or intact Venus fluorescent protein, in which fluorescence requires N-glycosylation in ER and subsequent deglycosylation in the cytosol (Grotzke et al. 2013). We adopted the intact Venus reporter system as an NGLY1 assay (Figure 2A). The patient fibroblasts were transfected with plasmids containing deglycosylation independent Venus and deglycosylation-dependent Venus (ddVenus) followed by MG132 treatment to prevent degradation of the fluorescent protein. The ddVenus constructs containing an N-glycosylation site (N-F-T) only become fluorescent when they are first glycosylated in the ER and subsequently deglycosylated after retrotranslocation because the enzymatic reaction converts an Asn to Asp. In contrast, fluorescence of Venus without the glycosylation site (D-F-F) does not depend on the glycosylation and deglycosylation (Figure 2A). Hence, Venus was used as a control to normalize transfection efficiency, which varied among different lines. We used the ratio of ddVenus/Venus median fluorescence or percentage of positive cells to indirectly reflect deglycosylation activity in vivo. As shown in Figure 2B and C, flow cytometry analysis showed that patient fibroblasts had dramatically reduced ddVenus/Venus ratios (by 50–85%) compared with control and parent fibroblasts, indicating a marked reduction of deglycosylation activity in NGLY1-deficient fibroblasts.
Fig. 2.
Cellular deglycosylation-dependent assay shows reduced N-glycanase 1 enzymatic activity in patient fibroblasts. (A) Schematic depiction of deglycosylation-dependent fluorescence assay. The ddVenus constructs containing an N-glycosylation site (NFT) only become fluorescent when they are first glycosylated in the ER and subsequently deglycosylated after retrotranlocation, where the asparagine is deamidated to aspartic acid (left panel). The fluorescence of Venus without glycosylation site (DFF) does not depend on the glycosylation and deglycosylation (right panel). (B) The patient fibroblasts were transfected with plasmids containing deglycosylation independent Venus (Venus) and deglycosylation dependent (ddVenus) by electroporation. Two days later, the cells were treated with 10 µM MG132 for 6 h. Then the cells were trypsinized and the YFP fluorescence was analyzed by flow cytometry. The cells with positive fluorescence were gated and the numbers in red color indicate the percentage. (C) The relative ddVenus/Venus median fluorescence (upper panel) and positive cell percentage (lower panel) ratios. The median fluorescence or percentage of positive cell for Venus and ddVenus was first calculated after subtract autofluorescence without transfection background. The ddVenus/Venus ratios representing the enzymatic activity of N-glycanase 1 for each line were plotted, and the error bars in the histogram represent SD of three independent assays or value range of two independent assays. This figure is available in black and white in print and in color at Glycobiology online.
Inhibition of N-glycanase 1 reduces ddVenus fluorescence
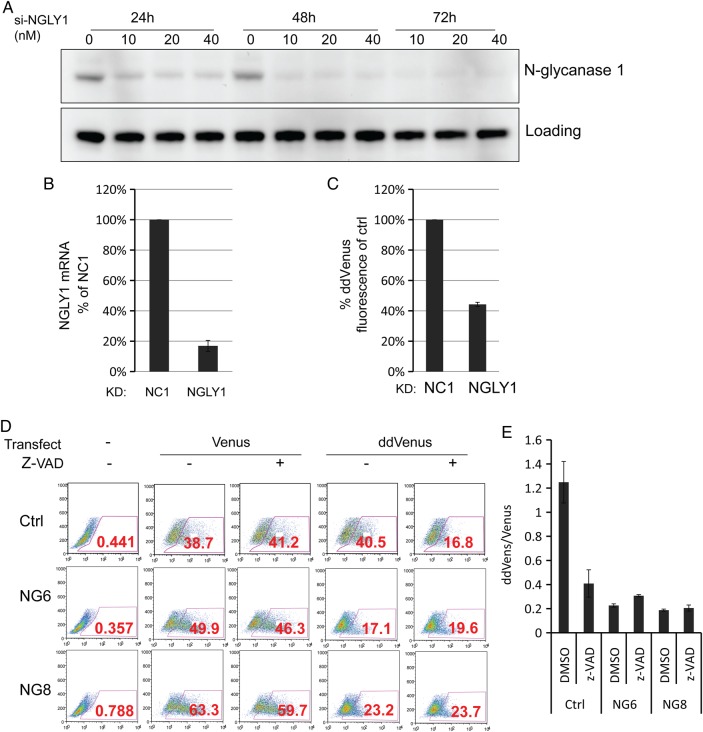
We also used siRNA duplexes targeting N-glycanase 1. The ability to silence the transcripts and protein was analyzed by qPCR and western blot separately (Figure 3A and B). The N-glycanase 1 transcripts and protein were knocked down by nearly 80%, which results in the ddVenus fluorescence reduction by 60% (Figure 3C). Z-VAD irreversibly inactivates PNGase enzymatic activity (Misaghi et al. 2004). We found Z-VAD could dramatically reduce ddVenus fluorescence in control fibroblasts to nearly that seen in patients (Figure 3D and E). These data suggest that the intensity of the ddVenus fluorescence can reflect the N-glycanase 1 enzymatic activity.
Fig. 3.
Inhibition of N-glycanase 1 reduces ddVenus fluorescence. (A) siRNA knockdown of NGLY1 followed by western blot analysis. Ten nanomolar of scrambled siRNA (NC1), 10, 20 and 40 nM N-glycanase 1 siRNA Smartpool were delivered to HEK293 cells. The total lysates were harvested 24, 48 and 72 h after transfection followed by western blot analysis of NGLY1 knockdown. (B and C) siRNA knockdown of NGLY1 and ddVenus transfection followed by qPCR (B) and flow cytometry (C) analysis. Ten nanomolar of scrambled siRNA (NC1) and NGLY1 siRNA Smartpool were delivered to HEK293 cells. Forty-eight hours after siRNA knockdown, ddVenus plasmids were transfected for 24 h followed by 10 μM MG132 treatment for another 6 h. The mRNA level of NGLY1 in knockdown groups was calculated relative to that of scrambled siRNA (NC1) transfection group, which was designated as 100%. Each error bar in the histogram represents value range of two independent assays. For flow cytometry analysis, the cells with positive fluorescence were gated and the median fluorescence of gated cells was divided by that of scrambled siRNA (NC1). The relative values were plotted, and the error bars in the histogram represents value range of two independent assays. (D) After transfection, cells were treated with 30 μM Z-VAD in the presence of 5 μM MG132 for 6 h and analyzed by flow cytometry as described in Figure 2B. (E) The relative ddVenus/Venus median fluorescence ratios were plotted as described in Figure 2C. This figure is available in black and white in print and in color at Glycobiology online.
Wild type but not mutant NGLY1 restores the ddVenus fluorescence
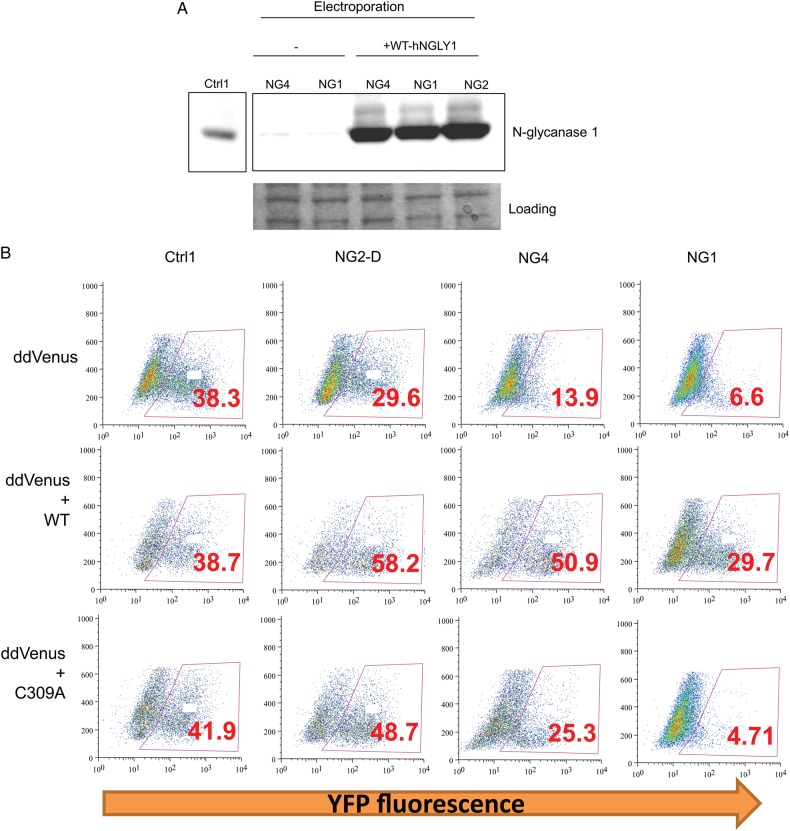
To test if the ddVenus fluorescence can be restored by wild-type human NGLY1 in N-glycanase 1 defective cells, patient cells were co-transfected with ddVenus and WT-hNGLY1 plasmids. The transient transfection dramatically increased N-glycanase 1 protein level (Figure 4A), which completely restored ddVenus fluorescence (Figure 4B, 2nd row). We then made NGLY1 mutant, C309A, which was proven to completely abolish N-glycanase 1 enzymatic activity (Hirsch et al. 2003). The C309A mutant failed to rescue the ddVenus fluorescence after co-transfection with the ddVenus plasmid (Figure 4B, 3rd row). These data suggest ddVenus reporter is a robust system that reflects N-glycanase 1 enzymatic activity in vivo and can be used to confirm the N-glycanase 1 deficiency in patient-derived cells.
Fig. 4.
Wild type but not mutant NGLY1 restores the ddVenus fluorescence. (A) Western blot analysis of hNGLY1 overexpression by electroporation in fibroblasts. Protein Coomassie blue stain serves as loading control. (B) Patient fibroblasts were transfected with ddVenus together with the same amount of plasmids containing human wild-type NGLY1 (hNGLY1) or human NGLY1 mutant C309A. This figure is available in black and white in print and in color at Glycobiology online.
ddVenus fluorescence N-glycanase 1 activity by high content screening analysis
Although no N-glycanase 1 protein was detected by western blot in patient cells, we calculated nearly 20% residual activity as measured by ddVenus assay. This could be caused by the sensitivity limit of the assay itself or by activities from other enzyme(s) with PNGase-like deglycosylation activity.
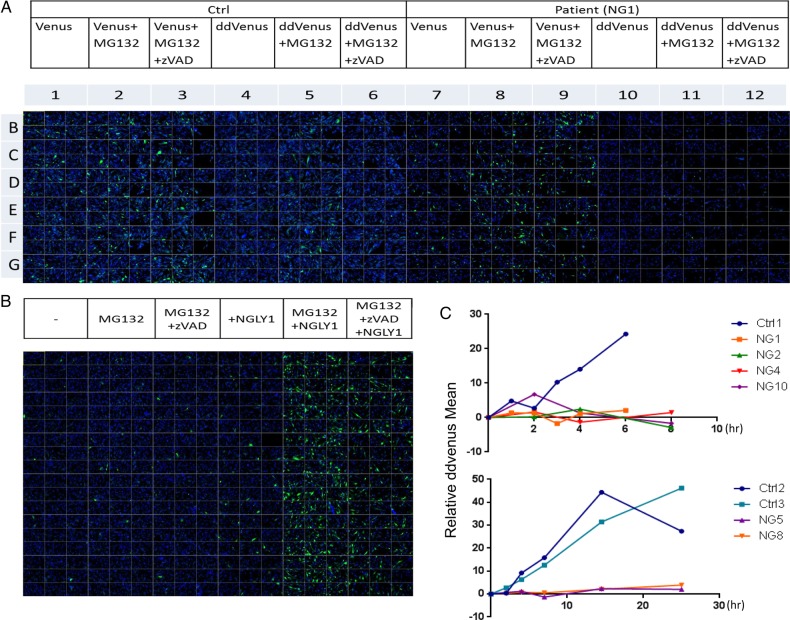
HCS platform combines automated fluorescence microscopy and computational analysis to a cell-based assay to enable the collection of multiple cellular readouts from a single experiment (Quintavalle et al. 2011). Using HCS imaging platform, we analyzed the residual ddVenus fluorescence in NGLY1-deficient cells. Consistent with the flow cytometry data shown in Figure 2B, we found the ddVenus fluorescence was dramatically reduced in NGLY1-deficient fibroblasts by HCS analysis (Figure 5A). The WT-hNGLY1 could restore the ddVenus fluorescence, which was partially prevented by Z-VAD treatment (Figure 5B). Further, we monitored ddVenus fluorescence at various times after MG132 treatment. As shown in Figure 5C, the fluorescence accumulated steadily after MG132 treatment in control fibroblasts, whereas it remained unchanged in all the patient cells. These data indicate that >95% of ddVenus fluorescence in fibroblasts stems from the N-glycanase 1 activity.
Fig. 5.
MG132 does not increase the ddVenus fluorescence accumulation in patient fibroblasts. (A) Control and patient fibroblasts were electroporated with ddVenus or Venus plasmid followed by 5 μM MG132 or DMSO treatment in the presence or absence of 30 μM Z-VAD for 6 h. After fixation and nuclei staining with Hoechst 33342, 96-well plates were imaged on high content imaging system. (B) NG1 patient fibroblasts were transfected with ddVenus and WT hNGLY1 plasmids followed by MG132 treatment in the presence or absence of Z-VAD. (C) Control and patient fibroblasts were electroporated with ddVenus followed by MG132 or DMSO treatment for shorter (upper graph) and longer (lower graph) duration. At each time point, the plates were imaged and ddVenus fluorescence intensity was quantified by Acapella software (see methods for detail). The relative ddVenus fluorescence mean value was obtained by subtracting DMSO-treated cells from the MG132-treated cells and then plotted in the graph. This figure is available in black and white in print and in color at Glycobiology online.
The nonsense mutation R401X was the most common deleterious allele in the NGLY1 patients (Enns et al. 2014). Nonsense mutation results in premature translational termination and promotes mRNA destabilization by NMD (Mendell and Dietz 2001). Aminoglycoside antibiotics (such as gentamicin, G418 and amikacin) and nonaminoglycosides (such as PTC124 and RTC14) can induce ribosomes to read through PTC mutations and thus promote production of the respective missing full-length proteins (Bidou et al. 2012). To test therapeutic potential of PTC compounds to read-through, we treated NGLY1 patients fibroblasts carrying homozygous (NG5 and NG6) and compound heterozygous (NG1) R401X mutation with various concentrations of gentamicin, G418 and PTC124 alone or in combination. We did not observe induction of N-glycanase 1 protein by any of these agents (data not shown).
The mutations in NGLY1 cause the first “congenital disorder of deglycosylation”. The comprehensive biochemical characterization of patient fibroblasts reveals that the mutations abolish N-glycanase 1 protein and enzymatic activity. We also adopted a reliable fluorescent cellular assay to monitor N-glycanase 1 activity. While some may argue that NGLY1 deficiency is disorder involving degradation, it does not resemble lysosomal storage disorders such as mucopolysaccharidoses, oligosaccharidosis. N-Glycanase 1 is indeed only responsible of cleaving the intact glycan from N-linked glycoproteins, which then allows the protein and glycan to be degraded further. Claiming NGLY1 deficiency as a disorder of de-glycosylation links it more closely to the ERAD pathway than to lysosome-based disorders of degradation. The mechanism by which N-glycanase 1 deficiency causes the clinical phenotypes is under investigation.
Materials and methods
Most of the reagents were purchased from Sigma-Aldrich (St. Louis, MO). Dermal fibroblasts derived from healthy controls were obtained from Coriell Institute for Medical Research (Camden, NJ). Dulbecco's modified Eagle's medium (DMEM) was obtained from Mediatech, Inc. (Manassas, VA). Fetal bovine serum (FBS) was obtained from Hyclone Laboratories (Logan, UT). MG132 was purchased from Tocris Bioscience (Bristol, UK). Z-VAD-FMK was purchased from R&D Systems (Minneapolis, MN). SuperFect Transfection Reagent, RNeasy Plus Mini Kit and QuantiTect Reverse Transcription Kit were purchased from Qiagen (GmbH, Germany). Power SYBR® Green PCR Master Mix, Lipofectamine™ RNAiMAX, Hoechst 33342 and NuPAGE Novex Bis-Tris Mini Gels were purchased from Life Technologies (Carlsbad, CA). Cell Lifter was purchased from Corning Life Sciences (Tewksbury, MA). BCA Protein Assay kit was purchased from Pierce Protein Biology (Thermo Scientific, Pittsburgh, PA). Complete Protease Inhibitor Cocktail Tablets were purchased from Roche Applied Science (Indianapolis, IN). Horseradish peroxidase conjugated second antibodies were purchased from KPL, Inc. (Gaithersburg, MA). Immun-Star WesternC Kit was purchased from Bio-Rad (Hercules, CA). Polyvinylidene difluoride membrane was purchased from Whatman (Dassel, Germany). pCMV6-AC vector was purchased from Origene (Rockville, MD). Quickchange site-directed mutagenesis kit was obtained from Agilent Technologies (Santa Clara, CA). Amaxa nucleofector II device and Amaxa® Human Dermal Fibroblast Nucleofector® Kit were purchased from Lonza (Walkersville, MD). Ninety-six-well black/clear imaging plates were purchased from BD Biosciences (Franklin Lakes, NJ). ON-TARGETplus N-glycanase 1 siRNA Smartpool was designed and synthesized by Dharmacon (Thermo Scientific, Pittsburgh, PA). PNGase F was prepared in our laboratory. Glyko 2-AB (glucose homopolymer) standard was purchased from Prozyme (Hayward, CA).
Cell culture
Control and patient fibroblasts were cultured in DMEM (with 1 g/L glucose) with 10% FBS. HEK 293 cells were maintained in DMEM (with 4.5 g/L glucose) with 10% FBS. All cells were maintained in recommended media at 37°C and 5% CO2.
Total RNA purification and cDNA synthesis
The cells were grown to nearly 80% confluence. RNeasy Plus Mini Kit was used to extract total RNA following the manufacture's instruction. Equal amounts of RNA (0.3–2 μg) were reversely transcribed using QuantiTect Reverse Transcription Kit according to the manufacture's protocol.
Quantitative PCR
Primer pairs targeting the human NGLY1 and housekeeping genes (ACTB, 36B4 and HPRT) were designed using IDT website built-in software (Table II). qPCR reactions were performed with Power SYBR® Green PCR Master Mix. The following standardized cycle conditions for qPCR runs were applied in Applied Biosystems 7900HT Fast Real-Time PCR System: 95°C for 7 min to activate DNA polymerase and for template amplification, 40 cycles of denaturation at 95°C for 15 s, annealing of primers to template at 60°C for 5 s, and elongation at 72°C for 10 s. For dissociation analysis, denaturation at 95°C for 15 s, annealing at 60°C for 15 s, and melting at 95°C for 15 s. For each sample, dual replicates were run. A negative water control reaction was added to assess for a possible contamination in the system. SDS2.3 software was used to analyze expression data of reference genes. The mRNA expression of NGLY1 was calculated relative to the expression of control fibroblasts, which was designated as 100%.
Table II.
Nucleotide sequence of primers SYBR green qPCR assays
| Primers | Nucleotide sequence | Position | Amplicon length (bp) |
|---|---|---|---|
| hNGLY1-F | GGTTTGAAGCTCGCTATGTTTGGGATTAC | 1079 | 113 |
| hNGLY1-R | CTTGTCACAGACATCTTCACATGCATCAC | 1192 | |
| hACTB-F | AGTCCTGTGGCATCCACGAAACTA | 893 | 145 |
| hACTB-R | AGTGATCTCCTTCTGCATCCTGTCG | 1038 | |
| h36B4-F | GGTGTTCGACAATGGCAGCATCTA | 750 | 183 |
| h36B4-R | AGACAAGGCCAGGACTCGTTTGTA | 933 | |
| hHPRT-F | CCTGGCGTCGTGATTAGTGATGATGAA | 183 | 187 |
| hHPRT-R | AGCACACAGAGGGCTACAATGTGA | 370 |
Cell protein preparation
The cells were scraped by Cell lifters, and the cell pellets were resuspended with total lysis buffer (62.5 mM Tris–HCl, 2% SDS, 10% glycerol, pH 6.8) and boiled for 5 min. Protein concentration was measured by BCA protein assay according to manufacturer's protocol.
Western blot
As described by Jones et al. (2012). Briefly, 4–12 or 3–8% NuPAGE Novex Bis-Tris Mini Gels were used for electrophoresis followed by electrotransfer for N-glycanase 1 analysis. Anti-NGLY1 Ab (HPA036825, Sigma-Aldrich) was 1 : 1000 diluted in 1% BSA. For other proteins, either self-made SDS–PAGE or precast gels were used. Immun-Star WesternC Kit was used as ECL substrate. The images were captured by Bio-Rad CCD imaging system. The gray intensity of bands was calculated by Image Lab 3.0.1 (Beta 2) software designed by Bio-Rad.
Plasmids
The Venus and ddVenus fluorescent proteins were cloned into in pcDNA3.1 vector (Grotzke et al. 2013). Wild-type human NGLY1 gene (WT hNGLY1) was cloned into pCMV6-AC vector at EcoRI and XhoI sites. N-Glycanase 1 mutant C309A was generated by Quikchange site-directed mutagenesis kit.
Electroporation
Fibroblasts were grown to 90% confluence, trypsinized and resuspended at 3–5 × 10⁵ cells per 100 μL Resuspension Solution for electroporation using 2–3 μg plasmids. Electroporation was performed with Amaxa® Human Dermal Fibroblast Nucleofector® Kit and Amaxa nucleofector II device according to manufacturer's instructions using Nucleofector® Program 2.9 U-023. Then, cells were transferred immediately into 60-mm dish or 96-well plate containing DMEM (with 1 g/L glucose) with 20% FBS and cultured for 48 h. For Venus and ddVenus transfection, cells were treated with 5 μM MG132 for another 6 h to prevent protein proteasomal degradation followed by flow cytometry or HCS analysis.
SiRNA knock-down and transfection
Lipofectamine™ RNAiMAX reagent was used to deliver 10 nM scrambled siRNA and N-glycanase 1 siRNA Smartpool (siGENOME) into the HEK293 according to the manufacturer protocol. Forty-eight hours after knock-down, cells were transfected with Venus and ddVenus for 24 h by SuperFect Transfection Reagent according to the manufacturer's instruction. Cells were then treated with 5 μM MG132 for another 6 h prior to flow cytometry analysis.
Flow cytometry
Flow cytometry was performed with a BD Biosciences FACSCalibur analyzer (San Jose, CA) and analyzed with FlowJo software (Version 10.0.6). The values of yellow fluorescent protein (YFP) median fluorescence of Venus and ddVenus transfection were first subtracted from background (without transfection). For each cell line, the corrected ddVenus/Venus median fluorescence ratio represents the enzymatic activity of N-glycanase 1.
HCS and data analysis
Ninety-six-well plates were imaged on the IC 200 (Vala Sciences Inc.) high content imaging system using a 10× (0.5 NA) objective. Six fields were acquired throughout each well at two wavelengths. ddVenus YFP and Hoechst 33342 channels were acquired using 485/20 and 379/34 nm light engine excitation lines (Lumencor); 525/30 and 440/40 emission filters; and 100 and 12 ms exposure times, respectively. Acquired images were analyzed with a customized Acapella 2.6 (PerkinElmer, Inc.) building block sequence. Briefly, nuclear detection was performed on the Hoechst channel using Acapella Nuclear Detection A followed by cytoplasm detection on the Hoechst 33342 channel using Acapella Cytoplasm Detection B routine. R-Ag within the whole cell region (nucleus and cytoplasm) were then identified by image thresholding and subsequently quantified for fluorescence average pixel intensity. The values for all cells were aggregated (mean) on a per-well basis with an average of ∼1000 cells per-well.
Funding
The work is supported by the Bertrand Might Research Fund. Use of HCS Shared Resource was supported by the NCI Cancer Center Support Grant CA30199. G.M.E. and H.J.-N. are supported by the Grace Wilsey Foundation.
Abbreviations
Asn, asparagine; Asp, aspartic; ddVenus, deglycosylation-dependent Venus; DMEM, Dulbecco's modified Eagle's medium; ERAD, endoplasmic–reticulum-associated protein degradation; FBS, fetal bovine serum; HCS, high content screening; NMD, nonsense-mediated mRNA decay; PNGase, peptide-N-glycosidase; YFP, yellow fluorescent protein.
Conflict of interest
None declared.
Acknowledgements
We appreciate NGLY1 families for their cooperation. We acknowledge technical support provided by Neal Nathan, Larry Nguyen, Jamie Smolin and Jonathan Wong. We thank Dr. Virginia Kimonis, University of California Irvine for fibroblasts from patients NG 9 and 10.
References
- Allen MD, Buchberger A, Bycroft M. 2006. The PUB domain functions as a p97 binding module in human peptide N-glycanase. J Biol Chem. 281:25502–25508. [DOI] [PubMed] [Google Scholar]
- Altrich-VanLith ML, Ostankovitch M, Polefrone JM, Mosse CA, Shabanowitz J, Hunt DF, Engelhard VH. 2006. Processing of a class I-restricted epitope from tyrosinase requires peptide N-glycanase and the cooperative action of endoplasmic reticulum aminopeptidase 1 and cytosolic proteases. J Immunol. 177:5440–5450. [DOI] [PubMed] [Google Scholar]
- Bidou L, Allamand V, Rousset JP, Namy O. 2012. Sense from nonsense: therapies for premature stop codon diseases. Trends Mol Med. 18:679–688. [DOI] [PubMed] [Google Scholar]
- Blom D, Hirsch C, Stern P, Tortorella D, Ploegh HL. 2004. A glycosylated type I membrane protein becomes cytosolic when peptide: N-glycanase is compromised. EMBO J. 23:650–658. [DOI] [PMC free article] [PubMed] [Google Scholar]
- Caglayan AO, Comu S, Baranoski JF, Parman Y, Kaymakcalan H, Akgumus GT, Caglar C, Dolen D, Erson-Omay EZ, Harmanci AS, et al. 2015. NGLY1 mutation causes neuromotor impairment, intellectual disability, and neuropathy. Eur J Med Genet. 58:39–43. [DOI] [PMC free article] [PubMed] [Google Scholar]
- Enns GM, Shashi V, Bainbridge M, Gambello MJ, Zahir FR, Bast T, Crimian R, Schoch K, Platt J, Cox R, et al. 2014. Mutations in NGLY1 cause an inherited disorder of the endoplasmic reticulum-associated degradation pathway. Genet Med. 16:751–758. [DOI] [PMC free article] [PubMed] [Google Scholar]
- Funakoshi Y, Negishi Y, Gergen JP, Seino J, Ishii K, Lennarz WJ, Matsuo I, Ito Y, Taniguchi N, Suzuki T. 2010. Evidence for an essential deglycosylation-independent activity of PNGase in Drosophila melanogaster. PLoS ONE. 5:e10545. [DOI] [PMC free article] [PubMed] [Google Scholar]
- Grotzke JE, Lu Q, Cresswell P. 2013. Deglycosylation-dependent fluorescent proteins provide unique tools for the study of ER-associated degradation. Proc Natl Acad Sci USA. 110:3393–3398. [DOI] [PMC free article] [PubMed] [Google Scholar]
- Hirsch C, Blom D, Ploegh HL. 2003. A role for N-glycanase in the cytosolic turnover of glycoproteins. EMBO J. 22:1036–1046. [DOI] [PMC free article] [PubMed] [Google Scholar]
- Hirsch C, Misaghi S, Blom D, Pacold ME, Ploegh HL. 2004. Yeast N-glycanase distinguishes between native and non-native glycoproteins. EMBO Rep. 5:201–206. [DOI] [PMC free article] [PubMed] [Google Scholar]
- Jones MA, Ng BG, Bhide S, Chin E, Rhodenizer D, He P, Losfeld ME, He M, Raymond K, Berry G, et al. 2012. DDOST mutations identified by whole-exome sequencing are implicated in congenital disorders of glycosylation. Am J Hum Genet. 90:363–368. [DOI] [PMC free article] [PubMed] [Google Scholar]
- Kario E, Tirosh B, Ploegh HL, Navon A. 2008. N-linked glycosylation does not impair proteasomal degradation but affects class I major histocompatibility complex presentation. J Biol Chem. 283:244–254. [DOI] [PubMed] [Google Scholar]
- Katiyar S, Li G, Lennarz WJ. 2004. A complex between peptide:N-glycanase and two proteasome-linked proteins suggests a mechanism for the degradation of misfolded glycoproteins. Proc Natl Acad Sci USA. 101:13774–13779. [DOI] [PMC free article] [PubMed] [Google Scholar]
- Masahara-Negishi Y, Hosomi A, Della Mea M, Serafini-Fracassini D, Suzuki T. 2012. A plant peptide: N-glycanase orthologue facilitates glycoprotein ER-associated degradation in yeast. Biochim Biophys Acta. 1820:1457–1462. [DOI] [PubMed] [Google Scholar]
- Mendell JT, Dietz HC. 2001. When the message goes awry: disease-producing mutations that influence mRNA content and performance. Cell. 107:411–414. [DOI] [PubMed] [Google Scholar]
- Misaghi S, Pacold ME, Blom D, Ploegh HL, Korbel GA. 2004. Using a small molecule inhibitor of peptide: N-glycanase to probe its role in glycoprotein turnover. Chem Biol. 11:1677–1687. [DOI] [PubMed] [Google Scholar]
- Plummer TH, Jr., Elder JH, Alexander S, Phelan AW, Tarentino AL. 1984. Demonstration of peptide:N-glycosidase F activity in endo-beta-N-acetylglucosaminidase F preparations. J Biol Chem. 259:10700–10704. [PubMed] [Google Scholar]
- Quintavalle M, Elia L, Price JH, Heynen-Genel S, Courtneidge SA. 2011. A cell-based high-content screening assay reveals activators and inhibitors of cancer cell invasion. Sci Signal. 4:ra49. [DOI] [PMC free article] [PubMed] [Google Scholar]
- Suzuki T. 2007. Cytoplasmic peptide:N-glycanase and catabolic pathway for free N-glycans in the cytosol. Sem Cell Dev Biol. 18:762–769. [DOI] [PubMed] [Google Scholar]
- Suzuki T, Park H, Hollingsworth NM, Sternglanz R, Lennarz WJ. 2000. PNG1, a yeast gene encoding a highly conserved peptide:N-glycanase. J Cell Biol. 149:1039–1052. [DOI] [PMC free article] [PubMed] [Google Scholar]
- Suzuki T, Park H, Till EA, Lennarz WJ. 2001. The PUB domain: a putative protein-protein interaction domain implicated in the ubiquitin-proteasome pathway. Biochem Biophys Res Commun. 287:1083–1087. [DOI] [PubMed] [Google Scholar]
- Takahashi N. 1977. Demonstration of a new amidase acting on glycopeptides. Biochem Biophys Res Commun. 76:1194–1201. [DOI] [PubMed] [Google Scholar]
- Xin F, Wang S, Song L, Liang Q, Qi Q. 2008. Molecular identification and characterization of peptide: N-glycanase from Schizosaccharomyces pombe. Biochem Biophys Res Commun. 368:907–912. [DOI] [PubMed] [Google Scholar]
- Zhou X, Zhao G, Truglio JJ, Wang L, Li G, Lennarz WJ, Schindelin H. 2006. Structural and biochemical studies of the C-terminal domain of mouse peptide-N-glycanase identify it as a mannose-binding module. Proc Natl Acad Sci USA. 103:17214–17219. [DOI] [PMC free article] [PubMed] [Google Scholar]


