Abstract
We review variable-temperature, transport critical-current (Ic) measurements made on commercial superconductors over a range of critical currents from less than 0.1 A to about 1 kA. We have developed and used a number of systems to make these measurements over the last 15 years. Two exemplary variable-temperature systems with coil sample geometries will be described: a probe that is only variable-temperature and a probe that is variable-temperature and variable-strain. The most significant challenge for these measurements is temperature stability, since large amounts of heat can be generated by the flow of high current through the resistive sample fixture. Therefore, a significant portion of this review is focused on the reduction of temperature errors to less than ±0.05 K in such measurements. A key feature of our system is a pre-regulator that converts a flow of liquid helium to gas and heats the gas to a temperature close to the target sample temperature. The pre-regulator is not in close proximity to the sample and it is controlled independently of the sample temperature. This allows us to independently control the total cooling power, and thereby fine tune the sample cooling power at any sample temperature. The same general temperature-control philosophy is used in all of our variable-temperature systems, but the addition of another variable, such as strain, forces compromises in design and results in some differences in operation and protocol. These aspects are analyzed to assess the extent to which the protocols for our systems might be generalized to other systems at other laboratories. Our approach to variable-temperature measurements is also placed in the general context of measurement-system design, and the perceived advantages and disadvantages of design choices are presented. To verify the accuracy of the variable-temperature measurements, we compared critical-current values obtained on a specimen immersed in liquid helium (“liquid” or Ic liq) at 5 K to those measured on the same specimen in flowing helium gas (“gas” or Ic gas) at the same temperature. These comparisons indicate the temperature control is effective over the superconducting wire length between the voltage taps, and this condition is valid for all types of sample investigated, including Nb-Ti, Nb3Sn, and MgB2 wires. The liquid/gas comparisons are used to study the variable-temperature measurement protocol that was necessary to obtain the “correct” critical current, which was assumed to be the Ic liq. We also calibrated the magnetoresistance effect of resistive thermometers for temperatures from 4 K to 35 K and magnetic fields from 0 T to 16 T. This calibration reduces systematic errors in the variable-temperature data, but it does not affect the liquid/gas comparison since the same thermometers are used in both cases.
Keywords: critical current, helium gas flow, magnesium-boride, niobium-tin, niobium-titanium, superconducting wire, transport current, variable temperature
1. Introduction
Variable-temperature measurements (VTM) are needed to determine the temperature margin of superconducting strands. The temperature margin is defined as the difference between the operating temperature and the temperature at which the operating current equals the critical current (Ic). When a magnet is operating, transient excursions in magnetic field (H) or current (I) are not expected; however, many events or effects, such as wire motion, ac losses, and radiation, can cause transient excursions to higher temperatures (T). Hence, temperature margin is a key strand characteristic whether the application is immersed in a cryogen or is cryogen-free.
Many applications require each superconducting strand to carry 100 A or more under operating conditions, so this sets the typical desired current level for these measurements. VTM could be done on samples with cross-sectional areas smaller than needed for an application to reduce the maximum current needed for the characterization. However, there is no guarantee that the results will scale linearly with cross-sectional area, and there are cases where it is known that the properties do not scale. Characterizing the full-size strand over a wide range of magnetic field, temperature, and, in some cases axial strain, provides a data base that can be used to create accurate mathematical models or empirical parameterizations that are needed for magnet design and operation [1].
General descriptions of Ic measurements made with the sample immersed in a liquid cryogen are found in [2,3]. This paper will focus on the additional concerns for high-current VTM, and some basic information will be provided to put the VTM into context. For both Ic measurement systems presented, the sample voltage-tap pairs were separated by about 8 cm. Three pairs of voltage taps are placed along the active portion of the sample, and they cover three adjacent segments of the sample. The active length of the sample between the current contacts is at least 30 cm. The relatively long sample reduces current-transfer voltages [4], which makes the acquired voltage-current (V-I) curves more reliable. The long separation of voltage taps, and the placement of the taps a distance of at least 30 wire diameters from the current contacts, allows the determination of the Ic from the V-I curve at an electric-field-strength criteria (Ec) as low as 0.01 μV/cm. All Ic data presented herein utilize a 0.1 μV/cm (10 μV/m) criterion. Typically, the sample steady-state voltage is zero until the current is near Ic; then the voltage increases rapidly with current. The region of the V-I curve near Ic can be approximated by V ∝ In, where n is a constant called the n-value. This power-law approximation indicates that the V-I curve is nearly linear when plotted on a full-logarithmic scale, and the slope of the data is the n-value. n-values range from 1, when the sample is in the normal state, to 30 or even 100 when the Ic is high and the wire is of good quality. The n-value is an indication of the steepness of the V-I curve and a figure of merit for a superconducting wire.
The total time interval necessary to accumulate a full set of VTM is a factor in how data are acquired. A full data set over a 2-dimensional matrix of magnetic field and temperature can take two days to acquire for one sample. A full data set over a 3-dimensional matrix (H, T, strain) can take several weeks for one sample. The parameter easiest to change is the magnetic field. The ramp speed of superconducting magnets is limited and some settling time is needed. So, for example changing the field by 1 T can take two minutes. Changing the temperature by 1 K can take 15 minutes or more. So typically, the temperature is set and the magnetic field is ramped through the range where the Ic is measurable. It can take 1 h to sweep through the fields at one temperature. Changing strain can have a fatiguing effect on the sample, so it is usually changed the least often of the parameters.
Our computer program has evolved to the point where it can autonomously acquire V-I curves at various magnetic fields as long as the Ic is less than 300 A or 400 A and the sample has good thermal stability. The program uses pre-determined voltage and heater targets, settling times for H and T, and guesses for Ic and n-value. VTM at higher currents are typically done in a more manual mode, as are studies of various heater values at a given field. Because of all of these time factors, we try to limit the time to acquire a V-I curve to about 1 minute, including finding the current range of interest for the curve.
Having a high-current capability only increases the field range and measurement time interval. In addition, the higher the current, the more likely it is that the sample will quench (sample abruptly reverting to the normal state), necessitating a waiting period for the temperature controllers to settle before the next measurement attempt. Even without a quench, the higher the current, the longer is the wait after a V-I curve for the temperature controllers to settle. Because of these time concerns, we often limit our VTM to around 600 A, even though we can measure up to 1000 A.
The superconductor community has learned that careful measurement methods are needed to obtain consistent results on superconductors because subtle differences in methods can lead to unacceptable measurement biases. Two key international inter-laboratory comparisons of Ic measurements with the sample in liquid helium have been conducted by Versailles Project on Advanced Materials and Standards (VAMAS) [5–7]. In the first comparison, the coefficients of variation were 8.0 and 20.6 % for Ic and n-value, respectively, on a Nb3Sn sample at 12 T. The most significant influence quantity in the first comparison was the strain state of the sample. A standard procedure was introduced into the second comparison and the coefficients of variation were reduced to 2.2 and 7.1 % for Ic and n-value, respectively, on a Nb3Sn sample at 12 T. The most significant influence quantity in the second comparison was the magnetic field calibration. There has not been a similar comparison of variable-temperature Ic measurements, but the increased temperature uncertainty of VTM is expected to be significant.
Ic measurements can be very deceptive; one can obtain a very repeatable result that is still incorrect. It is a myth that the highest Ic is always correct. High values that are incorrect can often be the case for VTM as will be shown in this paper. Inconsistent results can lead to problems including: a mistrust of the results of others, unfair advantages in commerce, erroneous feedback in the optimization of conductor performance, and an application not meeting its designed target. In addition, as state-of-the-art low-temperature superconductor (LTS) and high-temperature superconductor (HTS) wires continue to improve and exceed their previous limits, the engineering limits of Ic measurement procedures are likewise being pushed. So we approach these VTM with a degree of respect and humility.
High-current, variable-temperature measurements have many experimental challenges. Ic measurements less than a few amperes are discussed beginning in Sec. 4.1. High currents cause variable heating and temperature gradients. Heat will flow down the high-current leads, even if they are vapor cooled. Heat is generated along the current path in the cryostat depending on the local resistance and joints. For resistive portions of the current path, the power goes up as current squared. Voltage drop along the sample causes self-heating when the current is near or above the critical current. It is necessary to raise the current to these levels to measure the critical current, unlike applications that typically try to operate with the current always below the critical current.
Samples are typically 0.5 mm to 0.85 mm in diameter, and the active length between the current contacts is at least 30 cm. For this sample length, it is hard to measure the average or effective temperature of the sample. If a thermometer is mounted next to a portion of the sample, it is hard to thermally anchor the thermometer to the sample. Moreover, during the measurement itself, the local cooling of the sample may change, so the temperature difference between the sample and the thermometer will not be constant. Both of these discrepancies can make the measured temperature not representative of the average temperature over the length of the sample.
Numerous choices need to be made when designing a variable-temperature system, and the choices described here may not be the best in all circumstances. We focused on the problem of measuring LTS such as Nb-Ti [8] and Nb3Sn [9], where the temperature dependence of the critical current requires a temperature uncertainty of about 50 mK or less. Measurements on HTS can typically tolerate higher temperature uncertainties. We view our system as a complex platform that can provide valuable reference data for modeling, important performance verifications, and comparisons with other VTM systems. We discuss other custom and commercial VTM systems in a later section of this paper (Sec. 4).
A key part of our approach to VTM is a comparison of Ic values obtained on a specimen immersed in liquid helium (“liquid” or Ic liq) at 5 K to those measured on the same specimen and on the same probe in flowing helium gas (“gas” or Ic gas) at the same temperature. For the rest of this paper, these two cases will be referred to as liquid (“Liq” for short in figures) and gas. These comparisons indicate the temperature control of the superconducting wire over the length between the voltage taps is effective. Based on our search of the literature for VTM performed on other laboratories’ systems, no other laboratory reports a liquid/gas comparison. Our liquid/gas comparisons were used to study the VTM protocol that was necessary to obtain the “correct” critical current, which we assume to be the Ic liq since the measurement results with the sample in liquid is more reliable. The protocol for the gas measurements includes the overall cooling power (related to the gas flow rate) and heater powers near the sample that can be controlled to be independent of each other and independent of critical current and temperature. With the sample immersed in liquid helium, we expect the difference between the temperature measured by the thermometers and the sample temperature to be minimal. The high-gas-flow design of the apparatus also allows us to make measurements at 5 K with the sample cooled by helium gas flow. The normal boiling point of liquid helium is 4.22 K. So it is difficult to use helium gas to cool a sample near this temperature, but many cryostats can use helium to cool a sample to 5 K in gas. At our test site, the reduced atmospheric pressure lowers the boiling point to about 4.03 K, which makes it slightly easier to make measurements at 5 K in helium gas. The critical temperature of liquid helium is 5.195 K, so 5 K is about the highest temperature at which liquid/gas comparisons can be made.
A key feature of our VTM system is what we call a pre-regulator that converts a flow of liquid helium to gas and heats the gas to a temperature close to the target sample temperature. The pre-regulator is not in close proximity to the sample, and it is controlled independently of the sample temperature. This allows us to independently control the total cooling power and the local sample cooling power at any sample temperature. The total cooling power is controlled by the liquid helium flow rate that is converted into a helium gas flow. The pre-regulator is strategically placed to use the probe’s steady-state heat load to boil some of the helium and to utilize the heat generated by the upper part of the current leads during high-current testing to heat the helium, replacing some or all of the heater power of the pre-regulator. We will show that the value of critical current measured in gas (Ic gas) will depend on the amount of heater power applied in the local region near the sample. Higher heater power near the sample is correlated with more sub-cooling of the sample relative to the thermometers and a higher measured Ic gas. So we conducted a systematic study of measured Ic gas with different heater powers. This type of study may have direct implications only for our specific apparatus, indicating the protocol (heater values, gas flow rates, etc.) that gives us the agreement between the average sample temperature and the temperatures of the two thermometers. However, this study also suggests an implication for all variable temperature measurements, because in principle they must all be cooled by an overall gas flow or some other large thermal sink external to the sample locale. Simply stated, the implication is: the higher the heater power near the sample, the higher the temperature gradients will be. It is expected that for many VTM systems the sample heater power will increase with sample temperature; and then temperature gradients, and potentially temperature biases, will systematically increase with temperature.
We show results from and compare two different sample probes in this paper. Both of these systems place the sample in the shape of a coil inside a 52-mm bore solenoid magnet with a field rating of 16.5 T at 4.2 K. One probe does only variable-temperature measurements (VTO probe) and the other probe has variable-temperature and variable-strain capability (VTS probe). The same general temperature-control philosophy is used in all of our variable-temperature systems, but adding another variable, such as magnetic-field angle or strain, forces compromises in design and results in some differences in operation and protocol. These aspects are analyzed to assess the extent to which the protocols for our systems might be generalized to other systems at other laboratories.
Most of the data presented in this paper were measured on two samples: one Nb-Ti wire and one Nb3Sn wire (Nb3Sn #1). Table 1 shows some of the parameters of each wire. All of the wires were commercially produced, multifilamentary wire. The Nb-Ti wire had a diameter of 0.76 mm and a non-Cu fraction of 0.435 (Cu/Nb-Ti ratio of 1.3). It had an Ic of 507 A and an n-value of 54 at 5 T and 4.0 K. Nb3Sn #1 had a diameter of 0.82 mm and a non-Cu fraction of 0.476 (Cu/non-Cu ratio of 1.1). It had an Ic of 279 A and an n-value of 61 at 12 T and 4.0 K. Nb3Sn #1 was made for the International Thermonuclear Experimental Reactor (ITER) fusion energy project. Ic(T) at various magnetic fields for these samples and two additional samples are shown in Figs. 1 (Nb-Ti), 2 (Nb3Sn #1), 3 (Nb3Sn #2), and 4 (MgB2). Ic(T) is fairly linear at a given magnetic field, except where the Ic approaches zero. Some Ic data points below a few amperes were removed to reduce overlap of the lines at each field. These plots cover most of the useful range of temperature and magnetic field for the respective samples, which are limited by the transition temperature and upper critical magnetic field. The limited thermal stability of two samples, identified as Nb3Sn #2 and MgB2 in Table 1, limited the higher current measurements for these samples even though they were soldered to the Cu-Be spring of the VTS probe.
Table 1.
Sample identification and wire parameters
| Sample | Wire diameter (mm) | Fraction non-Cu | Ic(A) at 4 K and 5 T | Ic(A) at 4 K and 12 T | Applied strain in VTS |
|---|---|---|---|---|---|
| Nb-Ti | 0.76 | 0.435 | 510 | – | – |
| Nb3Sn #1 | 0.82 | 0.476 | 915 | 279 | 0.18% |
| Nb3Sn #2 | 0.70 | 0.538 | – | 464 | 0% |
| MgB2 | 0.83 | 0.16* | 70 | – | 0% |
For MgB2 fill factor is shown instead of fraction non-Cu
Fig. 1.
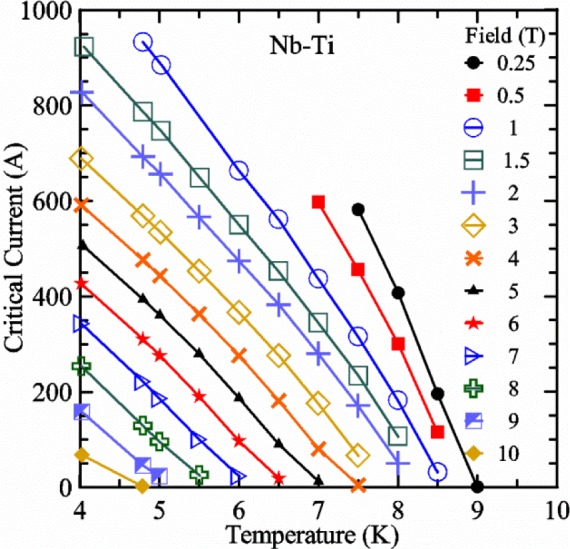
Critical current versus temperature at various magnetic fields for a 0.76 mm diameter Nb-Ti sample.
Fig. 2.
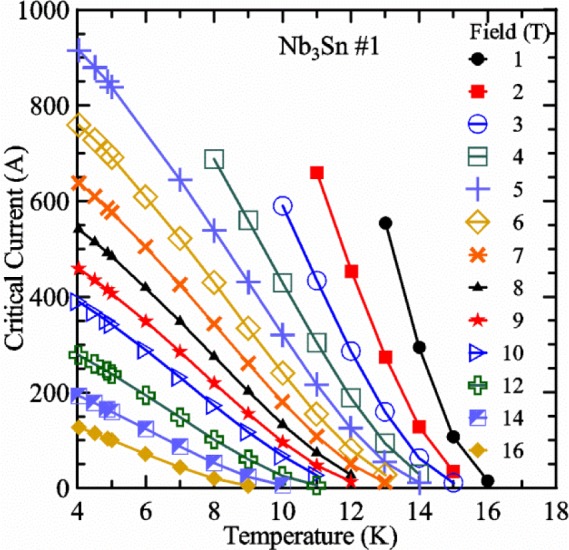
Critical current versus temperature at various magnetic fields for 0.818 mm diameter Nb3Sn sample #1.
Fig. 3.
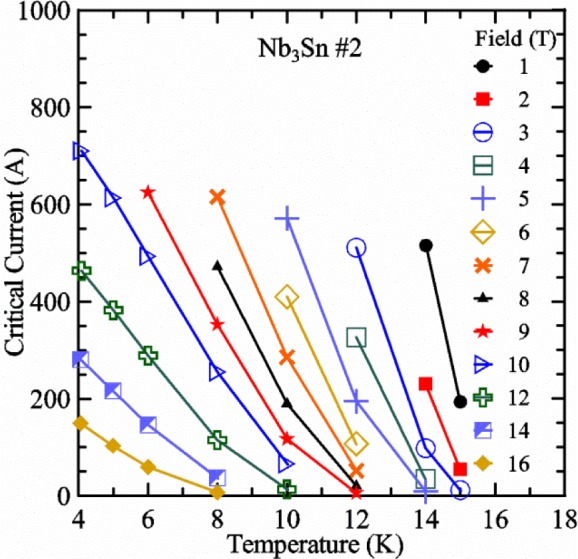
Critical current versus temperature at various magnetic fields for 0.70 mm diameter Nb3Sn sample #2.
Fig. 4.
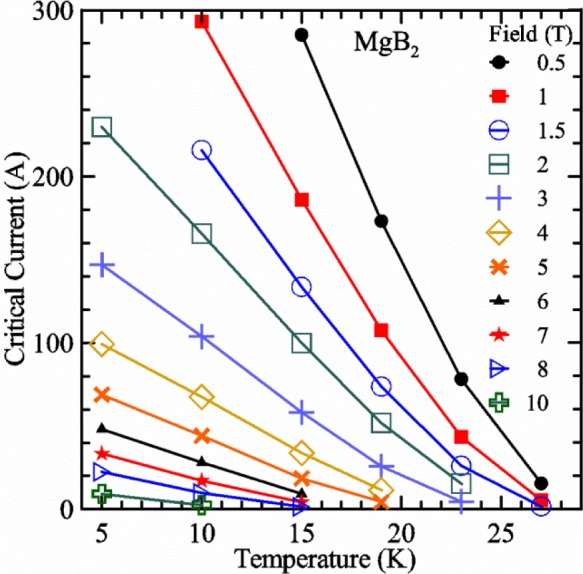
Critical current versus temperature at various magnetic fields for a 0.83 mm diameter MgB2 sample.
It is useful to compare the slope of Ic(T) for all of the samples near 5 K since this is where we will be making liquid/gas comparisons. Figure 5 shows the slope of Ic(T) in units of A/K versus Ic at 5 K for all four samples. For Nb3Sn wires Ic(H, T) also changes significantly with applied strain [1], so data are shown for two different applied strains. A semi-logarithmic plot of the absolute value of the slope of Ic(T) in units of %Ic/K versus Ic at 5 K is shown in Fig. 6. The transition temperature is one parameter that determines the Ic sensitivity to T, which is why the Nb-Ti sample is more sensitive than the other two types of superconductors. The two Nb3Sn wires have nearly the same transition temperature, but Nb3Sn #2 has a higher critical-current density than Nb3Sn #1, which causes a bigger change in Ic with T. Because the transition temperature of MgB2 is about 39 K, the slope of Ic(T) is much lower at all measured critical currents. HTS materials such as YBa2Cu3O7-δ (YBCO) would have even lower slopes of Ic(T) than MgB2 at 5 K. Because of these lower slopes and, in some cases, critical currents that vary more with time and magnetic field history, HTS samples are not as appropriate for making liquid/gas comparisons at 5 K.
Fig. 5.
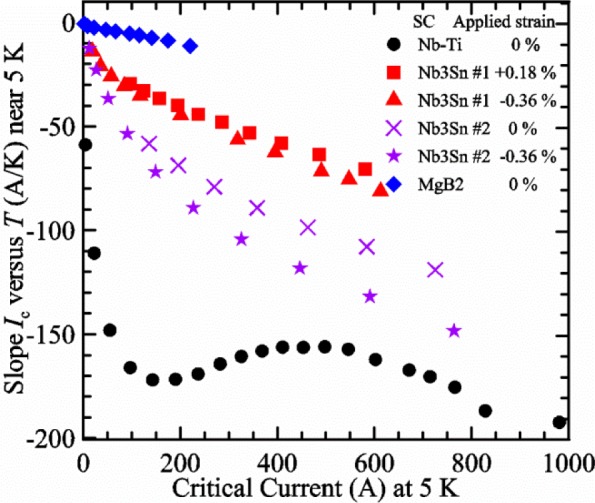
Slope of critical current versus temperature near 5 K plotted versus critical current at 5 K for various samples and applied strains.
Fig. 6.
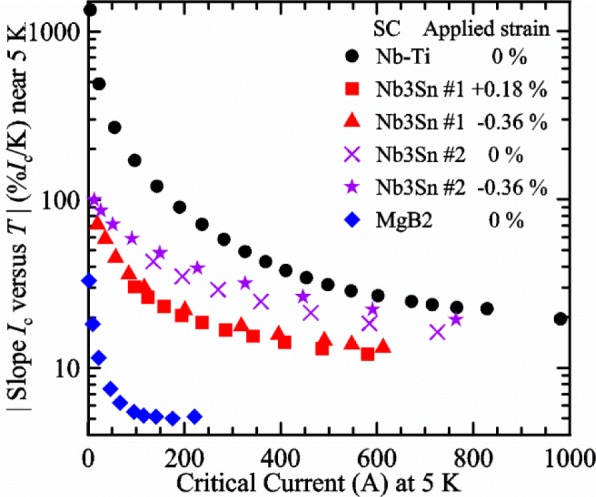
Absolute value of the slope of critical current versus temperature near 5 K plotted versus critical current at 5 K on a semi-logarithmic scale for various samples and applied strains.
For a given wire, the temperature sensitivity in units of %Ic/K increases with decreasing Ic, which means that temperature errors can be a bigger problem in the regions of low Ic. The region where Ic is less than 5 A is typically not useful for most applications for wires with diameters larger than 0.5 mm. To illustrate these points, consider the change in Ic for the Nb-Ti sample when the 5 K temperature is changed by 0.05 K at different magnetic fields. At 5 T, where the Ic is 369 A, a 0.05 K change would change the Ic by about 7.9 A or 2.1 %. At 8 T, where the Ic is 97 A, a 0.05 K change would change the Ic by about 8.3 A or 8.6 %. At 9 T, where the Ic is 23 A, a 0.05 K change would change the Ic by about 5.5 A or 24 %.
The following estimates of uncertainty are based on critical current measurements on stable Nb-Ti and Nb3Sn wires with diameters from 0.5 mm to 0.85 mm. Due to our limited experience with MgB2 wires, we do not have an uncertainty estimate for this sample. A conservative estimate of the standard uncertainty of the Nb-Ti critical-current measurements with the sample in liquid helium due to systematic effects is 1 % +1 A, and that due to random effects is 0.2 % + 0.2 A. A conservative estimate of the standard uncertainty of the Nb3Sn critical-current measurements within the reversible strain region [10] and with the sample in liquid helium due to systematic effects is the larger of 2.5 % +2 A or the effect of changing the strain by 0.03 %, and that due to random effects is the larger of 0.6 % + 0.5 A or the effect of changing the strain by 0.01 %. For measurements done in flowing helium gas in the VTO probe, the additional critical-current uncertainty due to systematic effects is the equivalent of a temperature change of 0.03 K, and that due to random effects is the equivalent of a temperature change of 0.01 K. For measurements done in flowing helium gas in the VTS probe, the additional critical-current uncertainty due to systematic effects is the equivalent of a temperature change of 0.06 K, and that due to random effects is the equivalent of a temperature change of 0.02 K.
2. Experimental Details
2.1 Re-entrant Dewar and Control Loops
2.1.1 Philosophy of Temperature Control in Gas
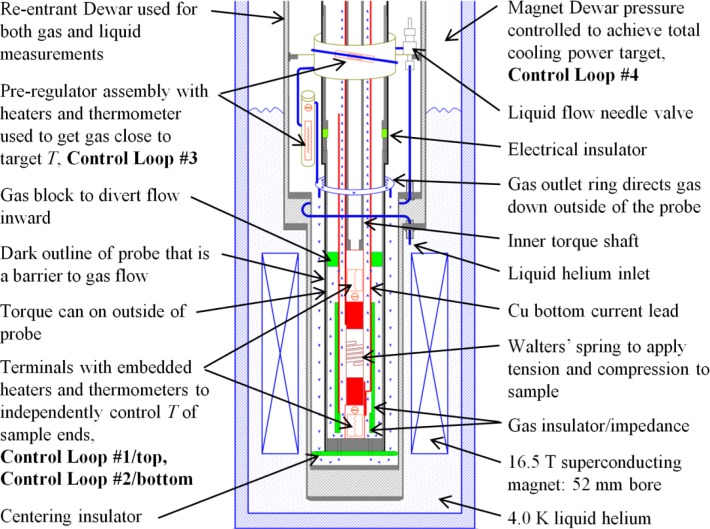
A schematic diagram of the lower part of our variable temperature measurement system is shown in Fig. 7. The sample probe is inserted into a re-entrant dewar (also known as a variable-temperature insert), which is inserted into a dewar with a superconducting magnet. Some of the system is built into the re-entrant dewar and it is used by multiple sample probes. This schematic is shown with the VTS probe. The differences between the VTO and VTS probes will be described later. The horizontal gaps between many components are exaggerated for clarity. The re-entrant dewar has a vacuum and super-insulated space with a liquid helium transfer tube that goes from the outside to the inside. The transfer tube is a thin-walled stainless-steel tube with an outer diameter of about 3.2 mm. It is coiled for one turn around the vacuum space of the re-entrant dewar, which accommodates thermal contraction and is easier to weld in place than a bellows feed-through that was used in an earlier design. The transfer tube allows liquid helium to flow from the magnet dewar to the middle of the re-entrant dewar.
Fig. 7.
A schematic diagram of the lower part of our variable temperature measurement system shown with variable-temperature, variable-strain probe. The horizontal gaps between many components are exaggerated for clarity.
The variable temperature system has four separate control loops that work together to provide the necessary cooling power for the sample and the sample current leads. There are many long time-constant interactions between the four control loops, and the main computer program needs to keep the system stable. The reason for the four control loops will not become apparent until we examine the protocol necessary to achieve the “correct” critical-current measurements under flowing helium gas conditions at high current levels. The four control loops and the protocol attempt to create a relatively uniform temperature over the length of the sample and a predictable relationship between the average thermometer temperature and the average sample temperature. We use many control loops to control pressure, gas flow, heater powers, and temperatures. Most of these control loops use the very common proportional-integral-derivative (PID) control algorithm.
To control temperature during our VTM we need (a) a cooling power that is provided by a flow of cold helium gas and (b) an electric heater with a controller that adjusts the heating power to obtain a constant temperature. If the heater power goes to zero, the temperature control is lost. The liquid-helium flow from the magnet dewar is determined by control loop #4. This helium flow is converted to gas and warmed somewhat by the pre-regulator, which is control loop #3. In order to exit the re-entrant dewar, this gas has to flow down the outside of the sample probe (outlined with two dark lines) and then up the inner part of the sample probe, over the bottom current contact and control loop #2 (heater power H2), over the sample coil, and finally to the top current contact and control loop #1 (heater power H1). From there, the gas continues up the inside of the sample probe and exits out the vapor-cooled current leads. This gas continues to intercept heat that is flowing down the sample probe and current leads as it exits the re-entrant dewar. Flow meters at room temperature are used to monitor this gas flow. One can consider that control loops #3 and #4 provide the coarse temperature control and control loops #1 and #2, which are downstream from #3 and #4, provide the fine temperature control.
In the schematic shown in Fig. 7, we show that some of the gas flow up the VTS probe bypasses control loop #2 (bottom of the sample) and re-enters the main gas flow near control loop #1 (top of the sample). This bypass flow is intended to provide more cooling power for control loop #1, which is otherwise only downstream from control loop #2. With both of these control loops having the same temperature set point, one would expect that the heating power necessary for loop #1 would be zero or very low without some independent cooling flow for the VTS probe. In contrast, the VTO probe was designed to have more even cooling of these two control loops, so the bypass flow was not necessary for this probe. The design trade-offs between these two probes will be described later.
2.1.2 Coarse Temperature Control in Gas
Control loop #4 adjusts the pressure set point of the magnet dewar in order to ultimately control the total heater power of the other three control loops. The rate of helium flow is controlled by the impedance of a needle valve and the rest of the flow path, and the pressure difference between the two dewars. A “butterfly” valve with a PID pressure controller is located on the helium gas exhaust line of the magnet dewar to control the pressure. The pressure controller uses a PID algorithm to adjust the opening of the valve so that the dewar pressure is close to the set point. The difference between the dewar pressure and the pressure set point is the error signal for the valve PID. The main computer program has a target value for the total heater power (pre-regulator power plus sample heater powers H1 and H2). This total heater power target depends on the expected maximum current, Imax, of the V-I curve. The program determines this power target by using an interpolation table of total heater power target values at various Imax values, which the user can easily modify in real time. Within the computer program we have a second control algorithm (not a PID) that operates to reduce the error signal that is the difference between the actual total heater power and the target. Depending on the magnitude and sign of this error signal, the pressure set point is changed unless the error is within some tolerance. So, control loop #4 needs two separate control algorithms. The computer program control algorithm needs to have special features to reduce the chance of oscillation with the other three control loops and not to over-correct when there is a high sample current that reduces the total heater power. This algorithm is customized to increment the set point by an amount proportional to the error every 20 s or so, but the absolute value of the increment is clipped so that there is never a big increment. If the sample current is on, the increment is clipped to an even smaller value even if the error signal becomes very large in order to limit windup of the controller that would cause overshooting when the current is brought back to zero.
An alternative set point selection for control loop #4 is the helium gas-flow rate out of the re-entrant dewar instead of the total heater power of the other three control loops. Manually switching to control the gas-flow rate is a better feedback choice when the sample temperature is high (>25 K) and the system thermal time constants are longer. At higher temperatures it takes longer for the heater powers to reach equilibrium than it does for the gas flow.
The typical magnet dewar differential pressure ranges from 2 kPa (15 torr) to 8 kPa (60 torr) in order to have enough liquid helium transferred from the magnet dewar to the re-entrant dewar. Because of the low atmospheric pressure at our test site, the magnet temperature is still well below 4.2 K so we can operate the superconducting magnet at its full-rated field. The other approach to forcing liquid helium to transfer between the dewars is to pump on the re-entrant dewar. This could be done by increasing the impedance of the flow control valve and transfer line; however, this would reduce the helium gas pressure in the re-entrant dewar to nearly a vacuum that would not have the desired effect of improving the cooling and temperature uniformity of the sample. It would be better to put a pressure controller or manostat between the pump and the re-entrant dewar so that the pressure of the helium gas flow is only slightly less than one atmosphere.
Control loop #3 adjusts the temperature set point of the pre-regulator in order to ultimately control the heater power of one of the sample heaters, either H1 or H2. Typically, the power level of H1 is controlled because it is the farthest along the path of the helium gas, and thus is likely to be closer to zero power. We want to operate with H1 at 3 mW to 50 mW, depending on Imax, but we do not want to lose temperature control. The pre-regulator will typically operate between 0 W and 2 W. The pre-regulator and liquid flow needle valve are built into the re-entrant dewar. After the needle valve, the helium flows through four tubes that are soldered to a cylinder that fits around the sample probe. The cylinder provides a thermal coupling between the helium flow and the heat flowing down the probe, which will convert some of the liquid to gas. Half of the pre-regulator heater is also on this cylinder and the other half is on a liquid trap that has the control thermometer for loop #3 inside the tubing with the gas flow. The pre-regulator is strategically placed to use the probe’s steady-state heat load to boil some of the helium and to use as much of the heat generated during high-current testing as possible to heat the helium, replacing the heater power of the pre-regulator. After the liquid trap, the gas flows down to the outlet ring where there are a number of outlets that direct the gas down the tail of the re-entrant dewar on the outside of the probe and then, up the inside of the probe over control loop #2, the sample, and control loop #1.
Control loop #3 has two parts similar to that of control loop #4. The first part is a typical PID temperature controller that adjusts the heater power to control the pre-regulator temperature. The second part is a customized PID algorithm within the main computer program that typically monitors the heater power of control loop #1, H1. The target heater power for H1 depends on the expected Imax. The program determines this target by using an interpolation table of H1 target values at various Imax values, which the user can easily modify in real time. The difference between H1 and the H1 target value is the error signal for the customized PID algorithm, which slowly adjusts the pre-regulator temperature set point to attempt to reduce this error signal. It is important to notice that the pre-regulator temperature set point varies with time and is typically less than, but is close to the sample temperature. As with part of control loop #4, the custom algorithm in loop #3 has to take small steps to reduce the chance of oscillation and to limit windup when the sample current is on. Another unique problem is that when the H1 target is low, for example 0.005 W, the largest-magnitude error signal below the target is −0.005 W, because the heater power cannot go below zero. This creates an asymmetric error signal around the target that can produce a loss of control and error signals too small to re-gain control. Several customized modifications were needed to attempt to address this unique problem; however, we make no claims about the effectiveness or general applicability of our solutions. One modification is to automatically multiply the negative error signal by 1, 2, or 4, depending on the original magnitude of the error signal. A multiplier of 1 is used if H1 is within some tolerance of the target, which has the desired effect of not over-correcting. As H1 approaches zero, factors of 2 and then 4 are used to make more aggressive changes to the pre-regulator temperature set point. Another custom modification to the algorithm is that the error in the temperature of loop #1 is scaled appropriately and added to the heater error. This has the effect of providing an appropriately increasing error signal as control loop #1 loses temperature control because its heater power, H1, has gone to zero. Both of these modifications help provide a more symmetric error signal around the target and make it more likely that the system will automatically settle near the target. These are some of the many custom features of the VTM system that were deemed necessary for better control of the complex system.
The computer-program parts of control loops #3 and #4 have manually adjustable limits and total manual operational modes. The manual modes are sometimes needed when changing sample temperature or when the sample temperature is high (>25 K) and the system thermal time constants are longer. A manual software limit is set for the magnet dewar pressure so that loop #4 does not exceed the expected range needed for control. A manual limit is set for the pre-regulator heater power to reduce potential oscillations in control loop #3, and if it is over the power limit, the pre-regulator temperature set point is reduced regardless of the error signal. Another case is when the pre-regulator heater power is below 0.01 W, the pre-regulator set point is increased regardless of the error signal. This keeps the pre-regulator near the temperature where it can provide heating when necessary.
The computer program is very complex and many routines take different actions depending upon many variables. In order to help the operator follow the program logic in real time, we created a “case list” that identifies and creates a list of the ten (rows) most recent cases (column 1) with an indicator of how many consecutive times each case occurred (column 2). A hypothetical pre-regulator case list example is shown in Fig. 8. The case list is a two column by 10 row table with the most recent case on top. Notice that if a new case occurs, it is listed at the top of the table and the count starts over again at one, even if the case was listed in an earlier row. There are separate case lists for each of the complex routines in the program and they are displayed in various tabs on the program front panel.
Fig. 8.
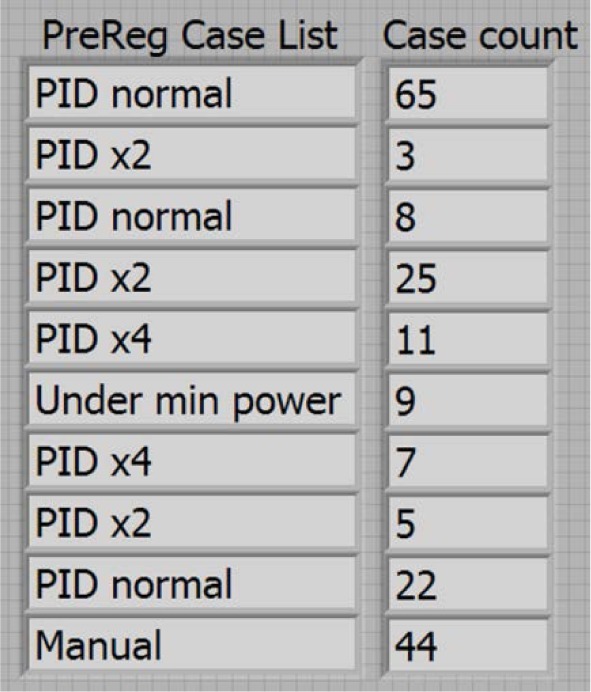
Hypothetical example pre-regulator case list that shows the ten (rows) most recent computer program logic cases (column 1) with an indicator of how many consecutive times each case occurred (column 2).
2.1.3 Fine Temperature Control in Gas
Control loops #1 and #2 use conventional, PID temperature controllers with temperature set points that are fixed for a given magnetic field. The resistive thermometers in these control loops do have magnetoresistance and we calibrate each thermometer over a matrix of temperatures and magnetic fields. This calibration is detailed in the next section. The computer program uses these calibrations and also takes into account where the thermometers are located within the magnetic field profile. When the computer program sets a new magnetic field, it estimates the magnetoresistance correction for each thermometer and sends an appropriate temperature set point to each controller so that the desired target temperature is reached. Typically the two temperature targets, T1 for loop #1 and T2 for loop #2, are the same. However, in some cases with the VTS probe, T1 is set 0.03 K (or more) higher than T2 to accommodate the relative thermometer calibration errors (including magnetoresistance effects) between the two thermometers that may vary with temperature and magnetic field. The relative thermometer calibration errors are unavoidable and, if the actual T1 is lower than the actual T2, it can be impossible to control T1 in the VTS probe because loop #1 has mostly downstream cooling.
2.1.4 Measurements in Liquid and Comparing Liquid to Gas
For measurements in liquid, our re-entrant dewar can be sealed, filled with liquid helium, pressurized, and the liquid heated to 5 K. Because the outside shell of the probe is fairly well sealed, another exit path for the gas is needed so that the gas pressure does not force the liquid helium up the inside of the probe. There is a port on the sample probe near the inlet to the vapor-cooled leads (above the view shown in Fig. 7) that can be manually opened to allow gas to exit the re-entrant dewar above the liquid level. It is important to deliver at least some heat to the liquid at the bottom of the dewar because cold helium is more dense and the temperature will stratify in the dewar. It is actually fairly difficult to heat helium to equilibrium temperature at 5 K without boiling all of the liquid away and without taking a long time to asymptotically approach equilibrium. We start by heating to a target temperature of about 5.04 K while holding the pressure (207 kPa, 1553 torr) at the equivalent of liquid helium at about 5.08 K. Having an initial target of 5.04 K helps reduce the asymptotic approach to equilibrium, and the higher-pressure target reduces the boil-off during the heating process. It takes an energy equivalent to 10 W for about 15 minutes to heat the liquid helium (7 to 10 liters) in the re-entrant dewar from 4.0 to 5.0 K. The total power starts at 10 W for about 10 minutes from the pre-regulator, H1, and H2, and then decreases towards zero over the next 30 to 40 minutes. Then, when the temperature is close to equilibrium at 5.04 K, we turn off the heaters and monitor the temperature drop over time. If the temperature drops below 5.02 K, the heaters are turned back on and we check again after a few minutes. If the temperature stays above 5.02 K, we drop the pressure to 194.5 kPa (1459 torr) to achieve equilibrium boiling near 5 K. Stratification is not a concern when the pressure is decreased. It typically takes about 1 hour to get the liquid helium into equilibrium at 5 K.
For both liquid and gas data, the same resistive thermometers are used to determine the sample temperature. Thus, the thermometer calibration errors, including errors in magnetoresistance, will be essentially cancelled in the liquid/gas comparisons at 5 K. When the thermometers are in liquid helium and in thermal dynamic equilibrium with the system pressure, we can compare the temperature readings of the thermometers with each other and with that determined from the system pressure. Typically, these comparisons are within 0.02 K.
For measurements in gas, the apparatus is capable of a wide range of helium gas flow rates, 0.008 g/s to 0.12 g/s (0.05 L/s to 0.7 L/s at STP), to provide the necessary cooling for testing currents between 1 A and 1000 A. We will systematically study how Ic gas will depend on the amount of heater power near the sample at 5 K and higher temperatures. Because of the placement of H2 and the direction of the gas flow, H2 is an indicator of the cooling power of the gas flow just before the gas flows over that sample. Higher H2 will be correlated with more sub-cooling of the sample relative to the thermometers and a higher measured Ic gas.
2.2 Thermometry
The accurate measurement of temperature in high magnetic fields has always been challenging. Capacitance thermometers are the least affected by magnetic field; however, they cannot be calibrated because they often shift between thermal cycles and they drift after each temperature change. Thus, they are used only to control the temperature while the magnetic field is changed. This allows them to be used to calibrate the magnetoresistance of resistive thermometers. Some resistive thermometers (metal oxy-nitride resistors) with a low magnetoresistance effect are available [11]; however, using the general literature values would lead to a temperature uncertainty of more than 0.1 K in our region of interest due just to magnetoresistance. Thus, we decided to calibrate our specific resistive thermometers to reduce the overall uncertainty and bias of the temperature measurement.
The magnetoresistance calibration was performed using a simple probe inside the same re-entrant dewar and pre-regulator as the VTM system. The probe had only one heater on an oxygen-free, high-conductivity (OFHC) copper block that had four resistive thermometers and two capacitance thermometers. The two capacitance thermometers were wired in parallel to give a larger signal. The pre-regulator was used to keep the thermometer block heater power low, typically less than 0.02 W, and thus reduce the temperature gradients within the block and between the thermometers. This low thermometer block-heater power is close to the lowest powers for H1 and H2 during Ic measurements.
We calibrated the magnetoresistance effect of our resistive thermometers for temperatures from 1.63 to 30 K and magnetic fields from 0 to 16 T. The experimental protocol for these measurements was to set the temperature in zero magnetic field by using a calibrated resistive thermometer, then switch to control using a capacitance thermometer, then ramp the magnetic field to 16 T, hold for 60 s at 16 T, and then return to zero field. The maximum ramp rate for our 16 T superconducting magnet is 1.28 T/s and somewhat slower at the higher fields, so it takes about 30 minutes to complete the ramp up and down. Curves at 5 K and below were taken in liquid helium where the temperature was controlled by controlling the system pressure. Where possible, there was good agreement between the magnetoresistance determined using the capacitance thermometer and the temperature determined by using the equilibrium pressure of the liquid helium. Data were recorded on all thermometers throughout this process. This protocol removed the shifting problem that capacitance thermometers have with thermal cycling and allowed for an approximate correction for the slight drifting problem inherent to capacitance thermometers. The initial temperature was held constant for 30 minutes or longer to reduce drift during the field cycle. Holding the field at 16 T and comparing the calibration of the ramp up and down segments verified that there were no significant field-ramping effects. Calibrated resistive thermometers allowed future variable-temperature measurements to be performed without the special protocol needed to accommodate the shifting and drifting problems of capacitance thermometers.
The magnetoresistance effect for one resistance thermometer is shown in Fig. 9. The x-axis is the magnetic field and the y-axis is the apparent change in temperature, ΔT, due to magnetoresistance. Each of the ten curves on Figs. 9(a) and 9(b) were taken at various temperatures. There are more than 2000 readings of temperature along each curve and symbols are plotted only every 100 readings. In some cases, a slight temperature (a few millikelvins) hysteresis can be observed between the increasing and decreasing field segments of the curves. If the ΔT is positive, the apparent temperature is higher than the real temperature. The ΔT at a given field varies slowly with temperature. It is most positive at 1.63 K and 16 T and most negative at 8 K and 16 T. Above 8 K, the ΔT increases with temperature and is again positive at 30 K and 16 T. These data were divided into two plots to reduce the overlap of the curves. Curves at temperatures of 1.7, 4.5, and 11 K were omitted from Fig. 9 for clarity. Linear interpolation between curves at adjacent temperatures can be used for intermediate temperatures. A forth-order polynomial was used to fit the apparent change in temperature versus magnetic field. These curves were used to correct the measured temperature for each thermometer during the Ic measurements.
Fig. 9.
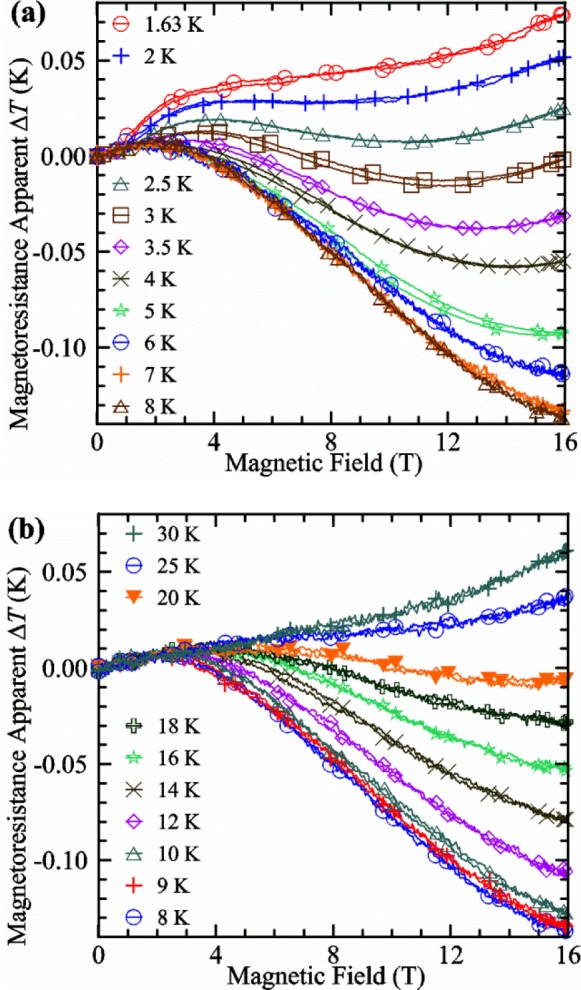
Apparent change in temperature due to magnetoresistance versus magnetic field for various temperatures from (a) 1.63 to 8 K and (b) 8 to 30 K. All of the readings are plotted, but the symbols are plotted only on every 100th point.
When we purchase thermometers for a given probe, we have them selected from the same batch with nearly the same resistance (within 10 %) at 4 K. With this selection, we have found that the magnetoresistance effects are nearly identical, which reduces systematic effects. The family of curves shown in Fig. 9 is very typical for the thermometers we have characterized. Figure 10 shows the ΔT at one magnetic field, 12 T, versus temperature for 11 different thermometers. The two thermometers illustrated with the first two symbols in the legend (solid circle and solid square) were from our first batch of thermometers. The three batches of three thermometers that we have procured since then have very similar magnetoresistance effects with temperature and with magnetic field.
Fig. 10.
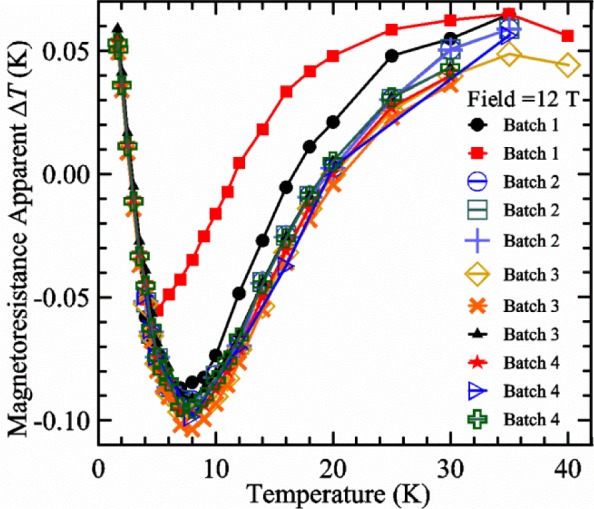
Apparent change in temperature due to magnetoresistance versus temperature at a magnetic field of 12 T for 11 resistive thermometers from four batches.
Once we have the approximate ΔT (H, T) for a given resistive thermometer, we can use it to control the temperature during the field sweep of the magnetoresistance calibration rather than using the capacitive thermometer for control. A resistive thermometer for temperature control has the advantage of higher sensitivity to temperature, which leads to better control than with a capacitive sensor. The capacitive sensor is still recorded and used to estimate the temperature during the field sweep. The computer program monitors the magnetic field and changes the temperature set point of the resistive thermometer appropriately as the field sweeps. The program uses the current value of the magnetic field and the measured field ramp rate to forecast the field and the appropriate temperature set point 6 s into the future. A new set point is sent to the controller if the appropriate temperature has changed by more than 2 mK or it has been more than 3 s since the last change in set point. These two conditions for changing the set point keep the program from constantly updating and over-running the controller, but allow the temperature to track the field sweep.
2.3 Variable-Temperature Only (VTO) Probe
The sample is mounted on a thin-walled, coil mandrel with OFHC copper current-contact lugs on each end, as shown in Fig. 11. The coil mandrel can be made of either a non-magnetic stainless steel or an oxidized Ti-6Al-4V (percent by mass, Ti-6-4, also known as Grade 5 Titanium) alloy. If the mandrel is stainless steel, we have the option of soldering the sample to the mandrel with non-superconducting solder to keep the specimen from moving and to provide some extra thermal stability. For both mandrel types, the mandrel diameter is about 32 mm with a 90° spiral groove with a pitch of 3.2 mm and 3 turns between the current contacts. Two bolts clamp the current lugs to the coil mandrel. The bolts are insulated from one lug so that they do not provide a parallel electrical path for the sample current. The Ic measured when the sample is normal is less than 0.03 A, indicating that the shunted current in the mandrel and solder is quite low. Three twisted pairs of voltage-tap wires are soldered along the sample to provide the main sample V-I characteristics. Each of the main sample voltage-tap pairs measure adjacent, 8-cm segments of the sample. Additional pairs of voltage taps are placed along the entire current path to allowing monitoring of the voltage drop along all portions of the sample and current leads within the probe. The current bus bars are connected to each copper lug so that the sample can be soldered to this sample test fixture separate from the VTO probe. The bus bar that delivers current to the right (bottom when in use) lug goes through and is insulated from the left lug. This bottom lead has an extra joint (extra resistance) as it transitions to the surface of the right lug. The test fixture can be bolted into the probe. The current contacts are made between the probe’s current leads and the sample current bus bars at a distance selected so that the test fixture does not need to be heated again.
Fig. 11.

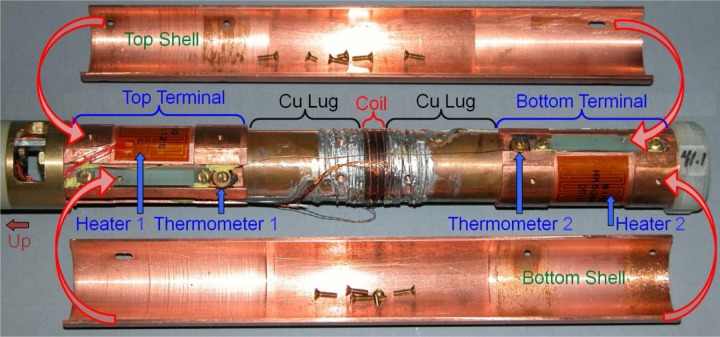
Picture of sample test fixture for variable temperature only (VTO) probe. The active 3 turns of the coil sample are wound on the oxidized Ti-6Al-4V mandrel (center 0.95 cm long) with Cu lugs on each end and current bus bars. In operation, the left direction is up.
The lower part of the VTO probe is shown in Fig. 12 with the test fixture bolted between the top and bottom terminals. In operation, the left direction is up (see arrow on left end of figure). There are slots (not shown) in the terminals into which the current bus bar slips. The top and bottom terminals each have a thermometer and heater. The two heaters are aluminum-backed, low-inductance, Kapton-foil heaters with a resistance of about 29.5 Ω and dimensions of 0.27 mm × 32 mm × 57 mm. The heaters are fastened to the terminals with epoxy. We refer to the temperatures and heater powers as T1 and H1, and T2 and H2 for the top and bottom, respectively. The top and bottom copper shells are two halves of a cylinder. The top copper shell is greased (with special high-thermal conductive, cryogenic grease) and screwed (four screws) to the top terminal so that they are in electrical and thermal contact. The lower part of the top shell is screwed (two screws through two slotted holes) to two fiber-glass epoxy insulators that are connected to the bottom terminal. The bottom copper shell is connected to the terminals in the opposite manner. Follow the assembly arrows from the shells to the terminals to see how the two shells fit around the test fixture and terminals. There is a gap between the two shells so that they are not electrically connected. Polyester electrical tape is used to seal the gaps so that the gas must flow down the outside (to the right) of the two shells and then up the inside over the bottom terminal, the sample, and top terminal.
Fig. 12.
Picture of exploded view of the lower part of the variable temperature only (VTO) probe. The test fixture is bolted between the top and bottom terminals. In operation, the left direction is up. Each terminal has a thermometer and heater. The top and bottom copper shells are two halves of a cylinder. Follow the assembly arrows from the shells to the terminals to see how the two shells fit around the test fixture and terminals.
The two copper shells provide more thermal mass and cooling surface to each terminal. But, more importantly, they provide more symmetric cooling for the two current contacts since the gas flows over these shells in a more symmetric manner than it does over the two terminals and current lugs. The gas that flows over the outside of the top shell provides some cooling for the top terminal before that gas flows over the bottom heater. This provides some “up-stream” cooling for the top of the sample. The shells also provide an isothermal shield for the sample. There is an insulating spacer below the bottom terminal made of fiberglass-epoxy. The spacer prevents the tail of the probe from shorting to the inside wall of the re-entrant dewar. The spacer has some flat segments around its circumference to allow gas to flow past it. There are holes through the spacer to allow liquid to drain out or gas to flow through. Gas can also flow through a 1-mm gap between the bottom of the shells and the top of the spacer. There are flat regions, smaller diameter sections, and slots in both terminals to allow gas to flow up the inside of the shells and over the sample. Only certain portions of the terminals have the same outer diameter as the inner diameter of the shells, and these portions are where the shells are greased and screwed to the terminals. The outer diameter of the Cu lugs and the sample mandrel is less than the inner diameter of the shells, with enough gap for the sample wire and solder.
The VTO probe was the first coil-sample geometry probe we designed to fit into a re-entrant dewar that fits into a 52-mm bore magnet. We have made measurements to temperatures as high as 90 K with the VTO probe and up to 65 K with the VTS probe (introduced in the next section). There is no reason that the VTS probe could not be operated at a temperature as high as the VTO probe. The VTO probe was also a prototype for the VTS probe. Our previous coil-geometry VTM system was designed to fit into an 86-mm bore magnet, which allowed more space around the sample. The advantage of the smaller bore magnet is the higher magnetic field capability that is important for more complete characterization of Nb3Sn samples. The challenge is fitting and electrically and mechanically connecting all of the components in the sample region, and having a less thermal mass near the sample. Most of the design of the VTO probe, other than the region around the sample, was duplicated in the VTS probe. The prototype probe allowed us to verify some of the new and smaller design components and visualize the structure needed to be compatible with the variable strain components.
2.4 Variable-Temperature and Variable-Strain (VTS) Probe
The variable-temperature and variable-strain (VTS) probe presented here was designed based on the combination of a low-current variable-temperature and variable-strain “Durham” probe [12] and the above introduced high-current VTO system. A Walters spring device [13] is used to apply a variable longitudinal strain (ε) to the sample. The spring is made from Cu-Be and has a T-section design with a wide elastic strain range between −1 % and +1 %. A worm gear is used to torque the top of the spring while the bottom of the spring is held fixed. The angular deflection of the spring (which has an operating range of about ±55°, corresponding to a sample longitudinal strain of about ±1 %) is read by use of a protractor and a pointer that are directly attached to the top and bottom of the spring, respectively. The protractor and pointer are inside a sealed space on the top of the cryostat that stays at room temperature. The angular deflection of the spring is read through a window in this sealed space. Strain applied to the sample is calibrated against the angular deflection of the spring. To read the angular deflection of the spring, to torque the top of the spring, and to hold the bottom of the spring, requires four concentric, mechanical connections to the sample test fixture. These four mechanical connections occupy space around the already complex and crowded region near the test sample.
Adding the variable strain feature to the VTO probe forced compromises: a smaller diameter working space, reduced thermal mass and reduced cooling surfaces of the current contacts, a longer sample length between the current contacts, larger distances between thermometers and the sample, and an off-balance of cooling power to each contact. In addition, we needed to be able to rotate one of the current leads by a total of about 110° as the Walters spring is rotated to deliver ±1 % strain to the sample. These compromises increased the challenges for making high-current VTM and required additional hardware and software changes. However, we maintained the ability to operate both the VTO and VTS probes in the same re-entrant dewar and pre-regulator, and with the same software.
The Cu-Be spring, OFHC Cu current contacts (Cu lugs), and current bus bar form a modular sample test fixture shown in Fig. 13. The Cu lugs are mechanically held to the Cu-Be spring with sets of pins, screws, and solder. The spring is 7.2 cm tall and 2.5 cm in diameter with 4 active turns in the center. Each end of the coil sample laps onto each lug and is soldered along its entire length. We typically add another coil sample segment in parallel with each end of the sample, outside the active portion of the spring. These extra coil segments act as splices around any potentially damaged portions of the sample ends and help carry the current to the active portion of the sample. Only the T-section of the spring is electrically and mechanically in parallel with the sample in the active region of the spring. The Ic measured when the sample is normal is less than 0.03 A, indicating that the shunted current in the spring and solder is quite low. The sample test fixture is soldered and instrumented before it is installed on the apparatus. The current bus bars are made of Cu strip and a number of layers of YBCO-coated conductors. The bus bars are imbedded in the Cu lugs and the current transfers from the YBCO to the helical sample over the length of the Cu lugs. The portion of the bus bar that extends past the Cu lug allows for the final current connection to be made between the current bus bars and bus bars in the sample probe. Two set screws for the tube that is connected to the protractor can be seen on the left end of the spring in Fig. 13. Two set screws for the rod that is connected to the pointer can be seen on the right end of the spring. The protractor tube and the pointer rod are not shown in Fig. 7, but they are inside the inner torque shaft that is shown. The protractor tube and the pointer rod each have an electrical isolation break along their lengths.
Fig. 13.

Picture of sample test fixture for variable-temperature and variable-strain (VTS) probe. The Cu-Be Walters spring is 7.2 cm tall and 2.5 cm in diameter with 4 active turns in the center. Cu lugs are screwed, pinned, and soldered to each end of the spring. Each lug has a current bus bar. Each end of the coil sample laps onto each lug and is soldered along its entire length. In operation, the left direction is up.
Two views (the probe is rotated about 180° between views) of the lower part of the VTS probe are shown in Fig. 14. The test fixture is bolted and pinned between the top and bottom Cu terminals. In operation, the left direction is up. The top terminal is pinned and screwed to the central torque shaft that is connected to the worm wheel at the top of the sample probe. Each terminal has a thermometer and heater. The two heaters are aluminum-backed, low-inductance, Kapton-foil heaters with a resistance of about 28.4 Ω and dimensions of 0.27 mm × 32 mm × 32 mm. The heaters are fastened to the terminals with epoxy. A current lead can be seen in the lower view as it attaches to the top current bus bar in a slot in the top terminal. The soldered current connection is made in the slot without significant heat transfer to the terminal or lug. A Cu cylinder with a current lead (not shown in Fig. 14, but shown in Fig. 7) slips over the lower part of the probe and is soldered to the bottom current bus bar in a slot in the bottom terminal (see upper view). The pins that stick out the bottom of the bottom terminal slip into a stainless-steel torque can (not shown in Fig. 14, but shown in Fig. 7) that slips over the lower part of the probe and couples the torque between the central shaft and the outer structure of the probe. A fiberglass-epoxy disk attaches to the bottom of the stainless-steel can that prevents the tail of the probe from shorting to the inside wall of the re-entrant dewar. Another fiberglass-epoxy disk electrically isolates the top of the stainless-steel can from the upper part of the sample probe as shown in Fig. 7. The heads of nylon screws in the top terminal prevent the Cu cylinder and bottom current lead from shorting to the top of the sample.
Fig. 14.
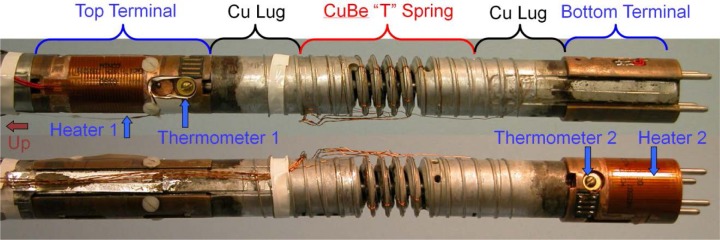
Picture of two views (probe rotated about 180° between views) of the lower part of the variable-temperature and variable-strain (VTS) probe. The test fixture is bolted and pinned between the top and bottom terminals. In operation, the left direction is up. Each terminal has a thermometer and heater. A current lead can be seen in the lower view as it attaches to the top current bus bar in a slot in the top terminal. A Cu cylinder current lead (not shown) slips over the lower part of the probe and solders to the bottom current bus bar in a slot in the bottom terminal (see upper view). The pins that stick out the bottom of the bottom terminal slip into a stainless-steel torque can that slips over the lower part of the probe.
Because the top terminal and current lug rotate a total of about 110° relative to the bottom terminal and current lug, we could not split Cu shells in the VTS probe like we did in the VTO probe. In addition, the outer stainless-steel can would cover any Cu shells, which would defeat the purpose of trying to provide more symmetric cooling and cooling surface for each current contact.
The current lead that carries current to the top of the sample is mounted on, and travels with, the lower part of the inner torque shaft and rotates a total of about 110°. This current lead transitions to a fixed, vapor-cooled lead about half way up the inner torque shaft. The inner torque shaft has an electrical break above this point. The transition from the rotating lead to the fixed, vapor-cooled lead is accomplished by a spiral of copper foils and superconductors.
The stainless-steel can has holes through the bottom to allow gas to enter the can from the bottom between the outer diameter of the bottom terminal and the inside diameter of the can, as shown by the gas flow arrows in Fig. 7. Once the gas is inside the can it has two paths: one outside and one inside the Cu tube/current lead. An insulating tube of fiberglass-epoxy covers the outside of the Cu tube so that the gas flow outside is not heated as much by the bottom heater. The outside gas flow path has to go through the holes in the Cu tube near the top terminal and lug because of the gas block, shown in Fig. 7, between the Cu tube and the inside of the stainless-steel can that is located above the top terminal. This outside gas flow path provides some cooling for the top of the sample that is somewhat decoupled from the bottom heater. Another insulating tube of fiberglass-epoxy fits inside the Cu tube to add some impedance for the inside gas flow to help balance the flow between these two paths. We expect that most of the gas flow is still up the inside of the Cu tube based on the relative impedances of the two paths.
Three twisted pairs of voltage-tap wires are soldered along the sample to provide the main sample V-I characteristics. Each of the main sample voltage-tap pairs measure adjacent, 8-cm segments of the sample, which is about one turn on the spring. Additional pairs of voltage taps are placed along the entire current path to allow monitoring of the voltage drop along all portions of the sample and current leads within the probe.
2.5 Data Acquisition
The Ic is determined from the measured V-I curve. The current signal and three sample voltages are measured simultaneously with four voltmeters. Figure 15 shows the current and one sample voltage (tap V1) versus time, t, for a Nb-Ti wire at 3 T and 5 K with the sample in liquid helium. There are about 4,100 readings of each the two signals in Fig. 15. Each of the four signals is recorded at a rate of about 50 readings per second with a one power-line cycle (60 Hz) integration period. These four voltmeters are on a communication bus separate from all of the other instruments and data are acquired by an independent computer program that shares its data with the main program using a common buffer system. This allows the optimal reading rate for the V-I curve acquisition regardless of what the main program is doing or which instruments it is communicating with. The main program has a matrix of estimated maximum current values, Imax, for various combinations of magnetic field and temperature. This program also has a maximum target sample voltage, Vmax, which is estimated based on Imax, the stability of the sample, and whether the sample is in liquid or gaseous helium. We interpolate values of Vmax at various Imax values by using a lookup table, which can easily be modified during the data run. The purpose of Vmax is to estimate how high the sample voltage can reasonably be and still avoid a thermal runaway situation that leads to a sample quench. We tend to conservatively estimate Vmax to reduce the number of sample quenches. Another programming parameter is Np, which is an estimated n-value that is estimated assuming it only depends on Imax. Again, we interpolate values of Np at various Imax values using a lookup table.
Fig. 15.
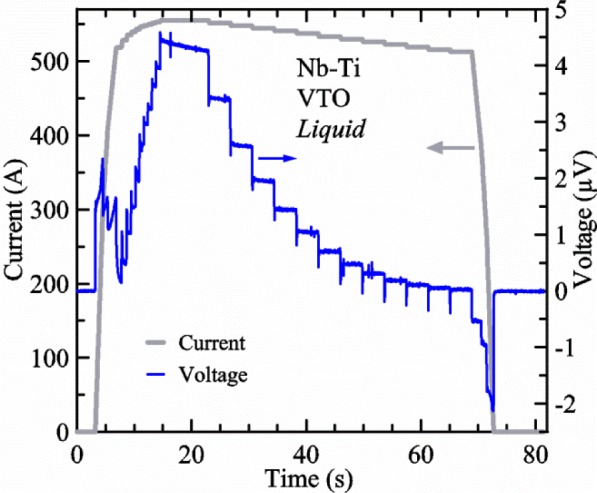
Sample current (left axis) and voltage (right axis) versus time measured on a Nb-Ti sample at 3 T and 5 K in liquid helium, and using the VTO probe. There are about 4,100 readings of each the two signals.
The main program controls and monitors the current and adjusts the ramp rate depending on the current and Imax. In Fig. 15, the three ramp rates are about 225, 126, and 75 A/s. The set of three ramp rates that are selected depends on the stability of the sample. If Imax is less than 200 A, then only the slowest ramp (finishing) rate is used. If Imax is between 200 A and 400 A, then the middle rate is used below 70 % of Imax and the slowest rate is used above that. If Imax is above 400 A, then the fastest rate is used below 50 % of Imax, the middle rate is used between 50 % and 70 % of Imax, and the slowest (finishing) rate is used above that. It is difficult to see the different slopes of I(t), but the inductive voltages of V(t) are more evident. Even though the current ramp rates are constant for each segment, the variable inductance of the voltage taps [14] causes the voltage to vary over each ramp segment. The inductive voltages are more constant over the downward ramp segments.
The parameter Np is used by the main program to determine how much to change the current during different parts of the V-I curve acquisition. The “p” in Np refers to the word “pattern.” Np determines the pattern of current steps in the V-I curve. We typically want the sample voltage points along the curve to be equally spaced on a logarithmic scale with about 6 points for every decade of voltage (example V: 0.1, 0.15, 0.22, 0.32, 0.46, 0.68, and 1.0). Then, given Np, the spacing of the corresponding currents can be estimated. If the Np = 20 and Imax =1000 A, some current set points would be 891, 909, 926, 944, 962, 981, and 1000 A. The desired step size is 1.9 % (about 19 A). If the Np = 57 and Imax = 1000 A, some current set points would be 960, 967, 973, 980, 987, 993, and 1000 A. The desired step size or quantum is about 0.67 % (~6.7 A). A higher Np means that the voltage will be increasing very quickly with current as Ic is approached, so the current needs to be incremented in smaller steps and the current quantum sets this scale.
Imax, Vmax, and Np are used by the main program during the first part of the acquisition to control the current and limit the sample voltage. We call this part of the acquisition the FIND, where the program hunts for the current that will result in a sample voltage near Vmax. In Fig. 15, the FIND occurs between 3 and 15 s of the waveform and the approximate parameters are Imax = 555 A, Vmax = 4 μV, Np = 57, and one current quantum is 3.7 A. The current waveform starts and ends at zero to allow for sample voltmeter offset and drift corrections. After the initial zero current, the current is ramped to the first set point that is lower than the Imax by a programmable undershoot value (typically 20 A) and six quanta of current (equivalent to one decade of voltage). During the FIND portion, the current is held for 0.5 s and the voltages recorded. Depending on how close voltage is to the target, the current is stepped by some multiple of the quantum, but never more than 5 quanta or less 0.25 quantum. The voltage is evaluated 0.5 s after each step and the number of quanta for the next step is conservatively estimated to approach the target from below without overshooting. If the voltage oscillates around the target, then the minimum step is reduced to 0.25 quantum. In Fig. 15, the FIND used the following sequence of quanta: 3, 2, 1, 1, 1, 0.5, 0.5, 0.5, 0.5, and 0.5. This process of stepping the current and evaluating the voltage continues with appropriately smaller steps until the voltage is within certain limits of Vmax and the FIND portion of the curve acquisition is completed. None of the measurements during the FIND portion are used to determine the V-I curve because the settling time periods are too short and in the case of measurements in gas, the heaters and temperature are still in a transient state.
The temperature of the two thermometers increases 5 or 6 mK and stabilizes by the time the FIND is complete in Fig. 15. Each thermometer is measured at a rate of about 2.5 readings per second. This slight temperature rise is due to the increased pressure in the re-entrant dewar that is caused by the increase in liquid helium boil-off and the resulting gas flow as the current is increased to 555 A. A manostat is used to control the pressure of the dewar when liquid helium is used and it has no remote pressure sense, making it somewhat sensitive to changes in gas flow rate. However, these changes in temperature are minor and easily measured by the thermometers.
A settling period of 6 s is used at the highest current and 3 s is used for each current step after that. Thirty-one readings (covering about 0.6 s) of current and each sample voltage are averaged after each settling time period and only these average values are used as the measured points along the V-I curve. From the highest current, the current is stepped down by 1 quantum increments. The current continues to be stepped down until the voltage is below some target value then the current is set to zero. This type of acquisition is backwards in some sense because the V-I curve is taken from high current to low current. We can acquire data with increasing current, but this requires that we separate the FIND and V-I curve with a ramp back to zero current, a settling time period, and then start the ramp back up. This takes longer and, especially at high current with the sample in gas, there is a transient in the heater and temperature when the current comes on. Another disadvantage of acquiring the V-I curve from low to high current is that if the sample quenches near the end of the curve, one loses more time. Moreover, the inductive voltages decay faster with time after the downward ramp segments compared with the upward ramp segments. We have compared results of different acquisition patterns with the sample in liquid (the most repeatable condition) and have observed only slight systematic differences (less than a few 0.1 % in Ic) between forwards and backwards acquisitions. This one of the many trade-offs that needs to be made for VTM.
A full-logarithmic scale plot of V-I curves is shown in Fig. 16 for three voltage taps at two temperatures. These curves are fairly linear over small regions indicating an approximately constant n-value. The V-I curves below 0.1 μV can be influenced by voltage noise and other subtle effects that create interfering voltage [3] including negative voltages [15]. The V-I curves are fairly stable to voltages of 3 to 4 μV at these currents with the sample in liquid helium. We use a linear fit of three V-I points to determine Ic at a given criterion. For example, the voltage equivalent to Ec = 0.1 μV/cm is 0.8 μV (8 cm tap spacing), which is indicated by the horizontal reference line in Fig. 16. Ic values at 5 K for each of the three taps, V1, V2, and V3 are 534.6 A, 536.2 A, and 538.6 A, respectively. The n-values near 0.1 μV/cm for the three taps are 53.8, 54.0, and 57.0, respectively. The slight Ic differences among the taps (a range of about 0.75 %) are very systematic as shown by the relative differences at 4.8 K being the same as at 5 K to within about 0.01 %. In some cases over an extended range of temperatures or magnetic fields, the relative order of the three sample segments can change in a smooth, continuous manner. Tap V1 covers the centermost portion of the sample and had the lowest Ic in this case, but did not seem to be damaged, as suggested by the n-value and low range of Ic values. So, we will just focus on Ic for tap V1.
Fig. 16.
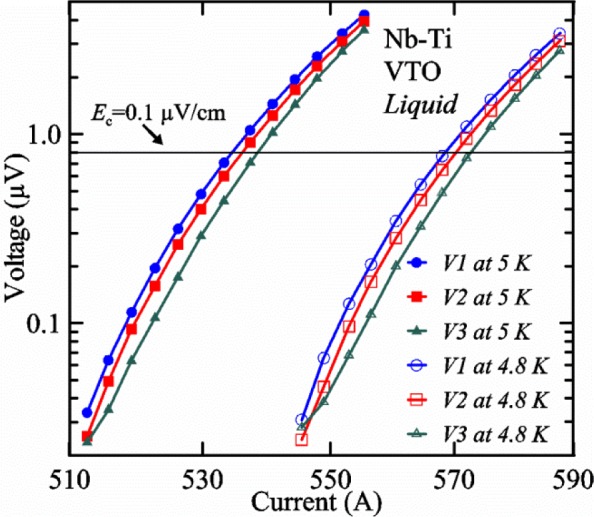
A full-logarithmic scale plot of V-I curves for three voltage taps at two temperatures in liquid helium measured on a Nb-Ti sample at 3 T using the VTO probe.
A superconductor near its Ic is an ultra-sensitive thermometer as illustrated in Fig. 16, where the voltage increases by a factor of over 30 at 550 A when the T is increased by 0.2 K (4.8 K to 5 K). The extreme sensitivity of the sample voltage to temperature is also evident in Fig. 15 at the highest voltage (around 20 s on the x-axis) where the sample voltage drifts down with time even though the current is constant and the sample is in liquid. Sample T changes (to lower T in this case) as small as a few millikelvins would account for this slight downward drift in voltage. In this part of the acquisition, the sample temperature is settling back down after the current was ramped up. This voltage drift is less evident at the lower voltage set points that are farther from the time of the current ramp. This type of sample voltage drift can be more significant for high-current measurements made in gas. The self-heating of the sample will also change significantly when the current is near Ic because the voltage drop changes quickly with current in this region. This change in self-heating can create systematic temperature changes with current that will tend to increase the measured n-value. The extreme sensitivity to T makes it difficult or impossible to accurately determine the n-value at high currents, especially for measurements made in gas. Thus, we will focus on getting the correct Ic, not on getting the correct n-value in VTM.
3. Verification of Variable Temperature Measurements
3.1 Verification Approach
We do not present thermodynamic models of the sample temperature relative to the temperatures of the thermometers. This is considered too difficult to completely model. In addition, many parameters depend on Ic and T. For example, the total heater power targets prior to the V-I curve change with Ic, which also means that the gas-flow rate changes. As a function of T, the gas-flow rate at a given total heater power, when the current is zero, decreases with increasing T because a larger fraction of the power is needed to heat the gas to a higher T (heat capacity) compared to most of the heater power providing the latent heat of vaporization when T = 5 K. The heat capacity of helium gas decreases slightly with increasing T from 4.2 to 30 K and then becomes almost constant for higher temperatures. In contrast, the heat capacity of most metals increases quickly with T and the approximate relationships are proportional to T3. The thermal conductivity of helium gas increases slowly with T, and the relationship is approximately proportional to T0.6.
Our approach is empirical. We will gradually make the case for H2 and T2 being key parts of the correct protocol for VTM and by implication, that H1 and T1 are less influential. We do not have space to present all of the observations that support this claim. The general premise of our VTM system with a high-flow rate of helium gas and a pre-regulator is that for low Ic, ideally H1 and H2 should be zero to get the correct Ic at any T. Here the limit of low Ic is determined by the contact resistance and sample self-heating, which in our case is about 150 A. As Ic increases, the correct H2 will increase to provide the needed additional cooling. The contact heating and any other heat flowing down the leads will decrease H1 and H2 as the sample I comes on, but H2 during the V-I curve needs to be finite, indicating that the gas has enough cooling power to balance the self-heating of the sample. One could argue that all of these empirical determinations of protocol are relevant only to our particular VTM system, but we will make the case that some of what we determined with careful liquid/gas comparisons has implications for most, if not all, VTM systems. The main implication is that high heater power near the sample can create T gradients that can lead to significant T differences between the sample and the thermometer.
3.2 Verification Measurements with the Variable-Temperature Only (VTO) Probe
Liquid/gas comparisons on a Nb-Ti sample mounted on Ti-6-4 mandrel, but not soldered to mandrel
Figures 15 and 16 (liquid) and the next 11 figures contain data that were taken using the VTO probe on the same tap V1 (except for Fig. 16 that shows all three taps), the same Nb-Ti wire mounted on a Ti-6-4 coil mandrel, and the sample was not soldered to the mandrel. We focus on this one set of data to provide the reader with a more complete comparison of liquid and gas measurements. We will start with temporal plots like Fig. 15, then look at V-I curves like Fig. 16, and finally compare Ic values. The next 11 plots, Figs. 17–27, will show that the thermometer readings, sample temperature, sample voltage, and V-I curves in gas are well defined and the resulting Ic values are not merely a product of chance, data selection, or clever averaging or fitting methods.
Fig. 17.
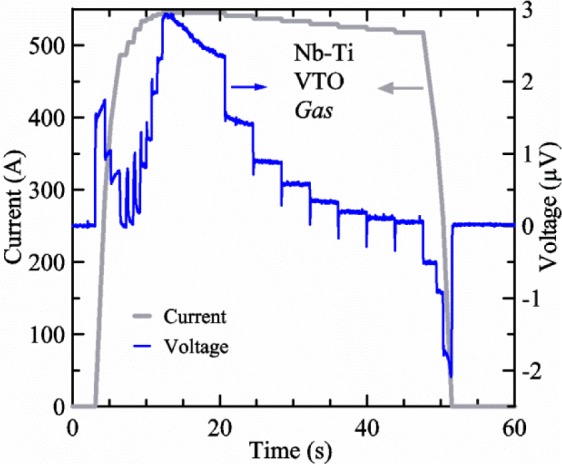
Sample current (left axis) and voltage (right axis) versus time measured on a Nb-Ti sample at 3 T and 5 K, in flowing helium gas, using the VTO probe. There are about 3,000 readings of each the two signals.
Fig. 18.
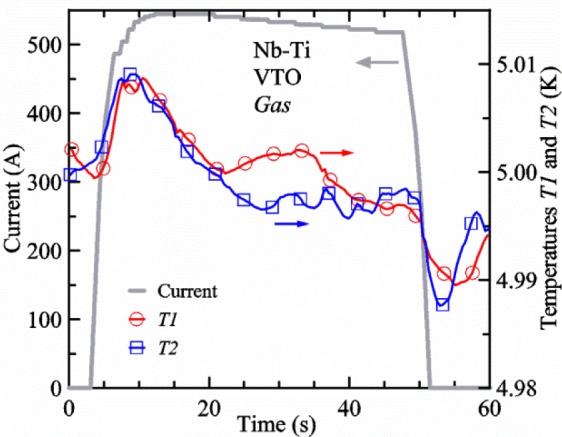
Sample current (left axis) and temperatures T1 and T2 (right axis) versus time measured on a Nb-Ti sample at 3 T and 5 K, in flowing helium gas, and using the VTO probe. All of the readings are plotted, but the symbols for the two temperatures are plotted only on every 10th point. These data were taken during the same curve as in Fig. 17.
Fig. 19.
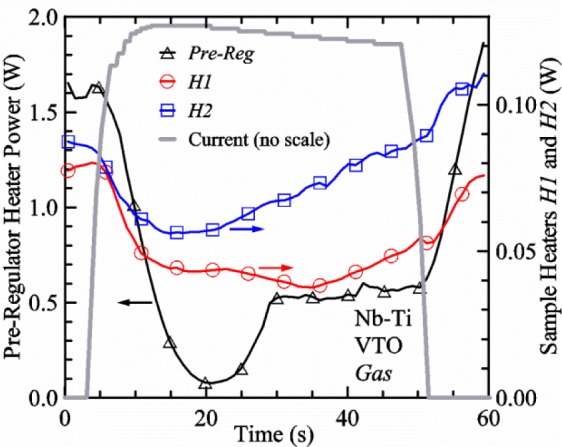
Pre-regulator heater power (left axis), sample heater powers H1 and H2 (right axis), and sample current (no scale) versus time measured on Nb-Ti sample at 3 T and 5 K, in flowing helium gas, and using the VTO probe. The symbols for the powers are plotted only on every 5th point. These data were taken during the same curve as in Figs. 17 and 18.
Fig. 20.
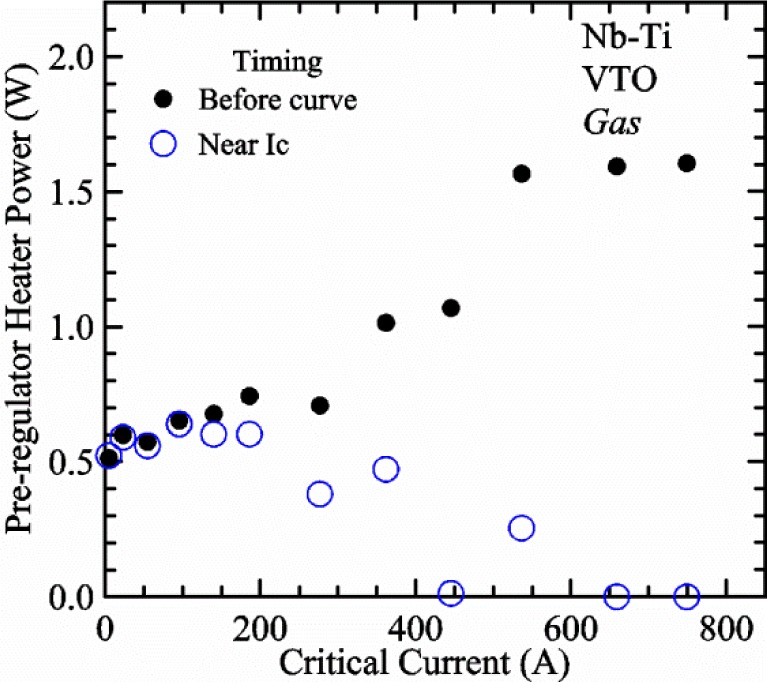
Pre-regulator heater power versus critical current for a set of measurements on a Nb-Ti sample at 5 K, in gas, and on the VTO probe. The solid circle symbols indicate the average heater power before each V-I curve was taken and the open circle symbols indicate the average heater power during the time that the sample current was near Ic.
Fig. 21.
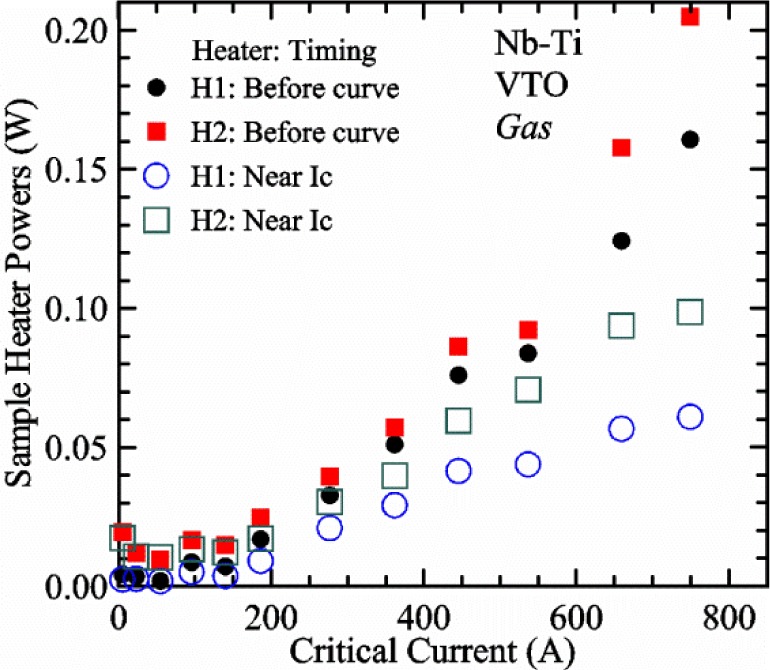
Sample heater powers H1 and H2 versus critical current for a set of measurements on a Nb-Ti sample at 5 K in gas, and on the VTO probe. The solid symbols indicate the average heater power before each V-I curve was taken and the open symbols indicate the average heater power during the time that the sample current was near Ic.
Fig. 22.
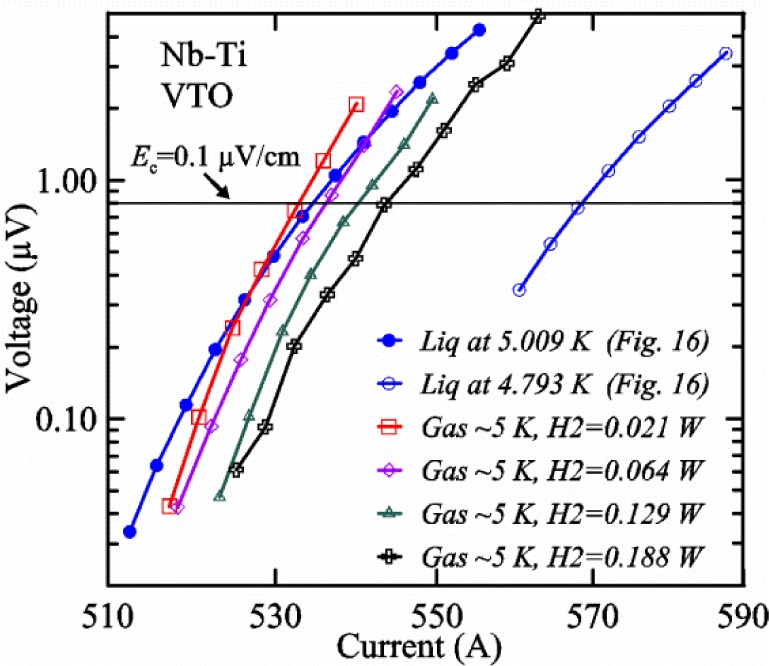
A full-logarithmic scale plot of V-I curves measured on a Nb-Ti sample in liquid and in gas with different H2 powers (average when I near Ic) using the VTO probe. Part of the curve at 4.8 K in liquid is covered by the legend.
Fig. 23.
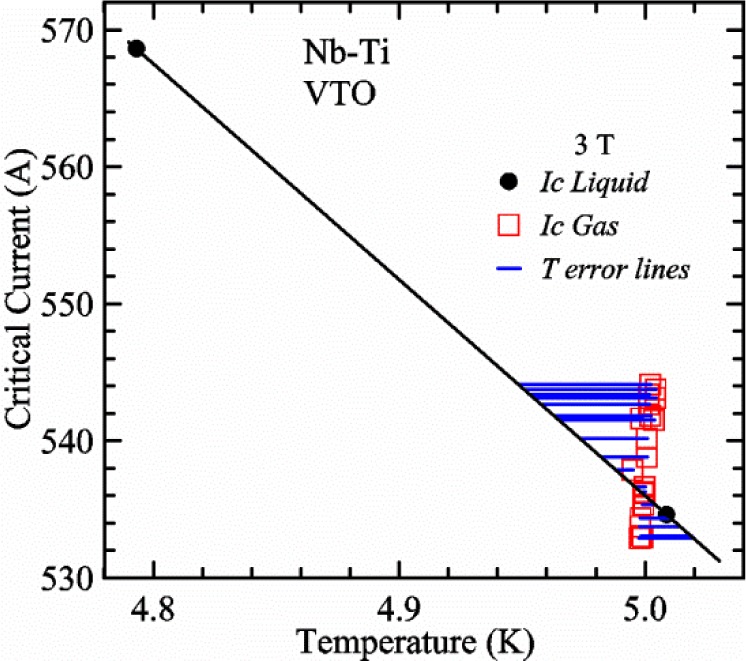
Critical current versus temperature on a Nb-Ti sample measured using the VTO probe in liquid helium and in flowing helium gas at 3 T. The solid black line indicates the expected linear dependence of Ic(T). The horizontal blue lines indicate the T error for the measurements in gas with different heater power levels.
Fig. 24.
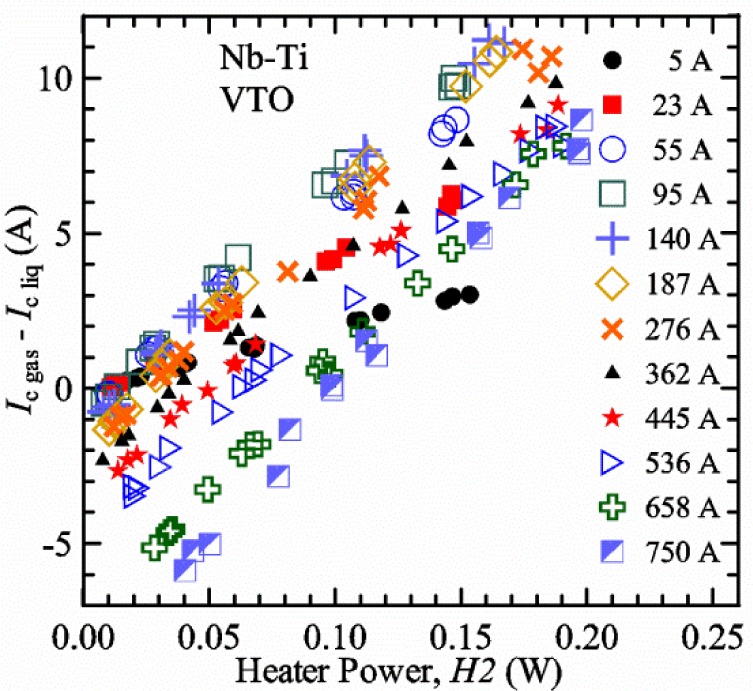
Difference Ic gas − Ic liq versus the average heater power of control loop #2 (H2) at various magnetic fields where Ic varies from 5 A to 750 A at 5 K for a Nb-Ti wire measured on the VTO probe. The measured Ic gas varies systematically with H2 heater power.
Fig. 25.
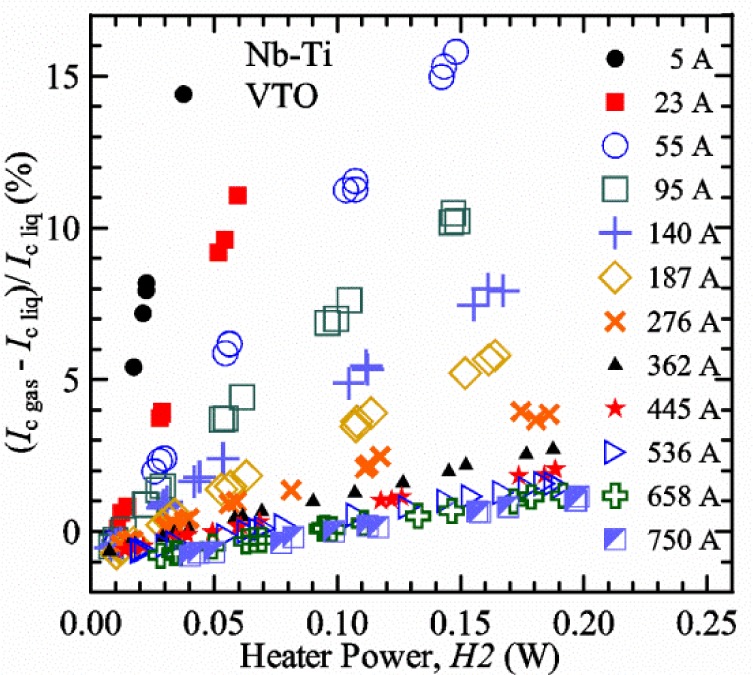
Percentage difference (Ic gas − Ic liq)/Ic liq versus the average heater power of control loop #2 (H2) at various magnetic fields where Ic varies from 5 A to 750 A at 5 K for a Nb-Ti wire measured on the VTO probe. The measured Ic gas varies systematically with H2 heater power.
Fig. 26.
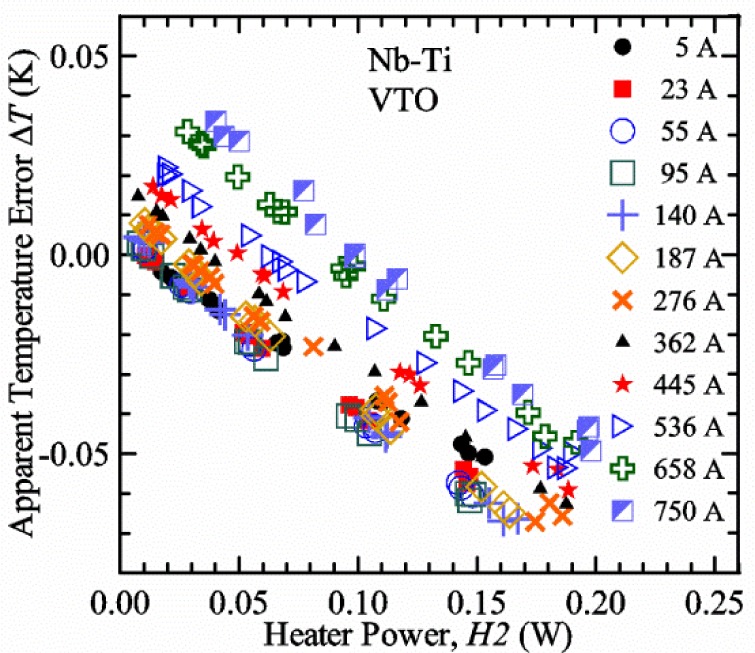
Apparent temperature error ΔT versus the average heater power of control loop #2 (H2) at various magnetic fields where Ic varies from 5 A to 750 A at 5 K for a Nb-Ti wire measured on the VTO probe. These data are from the same set shown on Figs. 24 and 25.
Fig. 27.
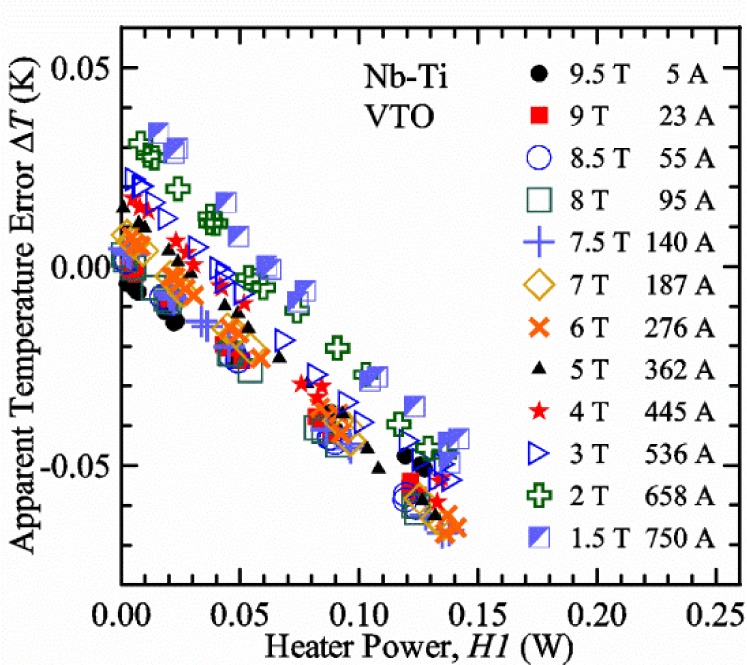
Apparent temperature error ΔT versus the average heater power of control loop #1 (H1) at various magnetic fields where Ic varies from 5 A to 750 A at 5 K for a Nb-Ti wire measured on the VTO probe. These data are from the same set shown on Figs. 24–26.
Figure 17 shows the current and one sample voltage (tap V1) versus time for a Nb-Ti wire at 3 T and 5 K with the sample in flowing helium gas. There are about 3,000 readings of each the two signals. This figure is comparable to Fig. 15. The only difference is that these data were taken with the sample immersed in liquid helium (liquid) in Fig. 15 and in flowing helium gas (gas) in Fig. 17. We try to compare liquid and gas measurements made on the same day to reduce the chance for small changes to the sample or the probe during the comparison. When we measure in gas with high-current, we cannot achieve the higher voltages on the V-I curve as when we measure in liquid; thus the target Vmax is lower and the curve takes less time to complete. In Fig. 17, the three current steps from about 22 s to 32 s are where the current is near Ic (V near 0.8 μV) and the averaged V and I readings near the end of each of these three steps are used to determine Ic at 0.1 μV/cm. The average readings of temperatures and heater powers over the same time period as these three V-I curve points are the most relevant for the measurement and we define these average readings as “near Ic.” The average readings prior to when each V-I curve was acquired (0 s to about 5 s in the figure, where the current is still zero) are also important and we define these averages as “before curve.”
Figure 18 shows sample temperature T1 and T2 data taken during the same curve as shown in Fig. 17 with a maximum current of about 550 A. T1 and T2 are each read at a rate of about 2.5 readings per second. All of the readings are plotted; however, the symbols are plotted only for every 10th point to identify the curves. The sample temperatures increase with current during the FIND portion of the curve because the heating from the current is increasing faster than the temperature controllers can decrease their heater powers. Then the temperatures returns closer to the target temperature 5 K. The three heater powers, Pre-Reg, H1, and H2 versus time are shown on Fig. 19. The heater power readings are 1 s averages and symbols are plotted only for every 5th point. The Pre-Reg (left axis) is about 1.6 W before the curve and drops to less than 0.1 W when the sample current is near its maximum. The Pre-Reg power returns to about 0.5 W during the latter half of the curve and jumps up over 1.7 W when the current is ramped to zero at the end of the curve. As can be seen by the large drop (about 1.6 W) in Pre-Reg power, the Pre-Reg intercepts much of the additional heat generated by the large sample current through the leads and soldered contacts. The starting Pre-Reg power can be thought of in two ways: it represents a dynamic reserve of cooling power that can easily be accessed to offset the heating from the sample current, or the starting Pre-Reg power can be replaced in whole or in part by the heating from the sample current. Most of the drop in Pre-Reg power is due to the heating from the sample current rather than the lowering of the Pre-Reg temperature set-point because H1 is below its target. Sample heater powers H1 and H2 (right axis) start at about 0.08 W, dip down slightly (less than 0.05 W), but do not go to zero when the current comes on, and then increases when the current is ramped to zero. Figures 18 and 19 illustrate the typical dynamic response of heater powers and temperatures during a high-current (up to about 550 A in this case) V-I curve.
Figure 20 shows the average Pre-Reg power just before each V-I curve was acquired (solid circles) and the average power during the time when the current is near Ic (open circles) as a function of Ic for a Nb-Ti sample at 5 K in gas. We varied the applied magnetic field to increase Ic from about 5 A at 9.5 T to 750 A at 1.5 T. The minimum target Pre-Reg is about 0.5 W, which allows the Pre-Reg to have enough reserve power to control H1 and, because H2 is typically greater than H1, this keeps H2 above zero and also in temperature control. For Ic below 100 A, the two Pre-Reg powers are nearly the same. As Ic increases above 100 A, the change in Pre-Reg power increases to more than 1.6 W. The target Pre-Reg power is increased with the expected Ic in order to intercept the heat generated by the higher currents. The heat that is not intercepted by the Pre-Reg will raise the temperature of portions of the probe, potentially including the sample, if this heat cannot simply replace the sample temperature controller’s heater power. In some cases the Pre-Reg power goes to zero during the V-I curve, which, although it is not desirable, does not necessarily mean that sample temperature control will be lost. If the Pre-Reg power had been slightly higher before the V-I curve was acquired, then this power might not have gone to zero during the curve.
Figure 21 shows the average H1 and H2 powers just before each V-I curve was acquired (solid symbols) and the average powers during the time when the current is near Ic (open symbols) as a function of Ic for a Nb-Ti sample at 5 K in gas. These measurements were made for the same curves as shown in Fig. 20. The target H1 power is about 0.005 W for low Ic and about 0.16 W for Ic of 750 A. These targets are set based on the experience of how much the power drops during the V-I curve and the desired power levels when the current is near Ic. H2 is typically a little greater than H1 prior to and during the V-I curve. The somewhat higher H2 at the lowest Ic is likely due to the system not being completely settled when we start acquiring this set of data. Even when the Pre-Reg power went to zero, H1 and H2 stayed above zero and in temperature control.
To compare liquid and gas measurements at various Ic values, we first measure Ic as a function of magnetic field at 5 K and 4.8 K in liquid to give us the correct temperature dependence of Ic. Then we switch to gas measurements at the same set of magnetic fields at 5 K. Figure 22 shows some liquid and gas V-I curves at 3 T. The liquid V-I curves at 4.8 and 5 K show the effect of temperature. Part of the liquid curve at 4.8 K is covered by the legend, but one can see the entire curve in Fig. 16, tap V1. The H2 labeled for each curve is now just the average value when I is near Ic, not H2 prior to the V-I curve. The figure has a horizontal line at 0.8 μV to indicate the location of Ic at an Ec = 0.1 μV/cm. For the gas measurements, we expect that Ic gas will depend on the amount of heater power. Higher heater power near the sample was correlated with more sub-cooling of the sample relative to the thermometers and a higher measured Ic gas. So we conducted a systematic study of measured Ic gas with different heater powers. Figure 22 illustrates that the gas V-I curves, and thus Ic gas, shift with heater power. H2 powers are listed in the legend for gas curves. The n-values for the gas curves are higher than for the liquid curves, which is likely due to slight changes (a few millikelvins) in sample temperature with current due to self-heating. However, the main feature is that Ic gas increases with H2, which is equivalent to a T decrease of 0.076 K (76 mK) for the curves shown here.
Figure 23 shows another way to view the liquid and gas comparison at 3 T. Ic liq at 4.8 and 5 K show the expected effect of temperature, which over this small range of temperature, can be approximated as linear. There are 20 different determinations of Ic gas at various sample heater powers. We will look at the vertical distance between Ic gas and the expected line, which we call ΔIc(A) = Ic gas − Ic liq. We can also define ΔIc(%) = (Ic gas − Ic liq)/ Ic liq. The higher heater powers give higher Ic values at 5 K and positive ΔIc. The lowest heater powers give Ic values that are below the expected curve and negative ΔIc. A plot of ΔIc(A) versus H2 is shown in Fig. 24 and a plot of ΔIc(%) versus H2 is shown in Fig. 25 for various magnetic fields where Ic varies from 5 A at 9.5 T to 750 A at 1.5 T. For any figure in this paper that has H2 on the x-axis, the values of H2 are the average values when I is near Ic, not H2 before the curve. Here the magnetic field is just a variable that changes the Ic. At 9.5 T, the Ic is only 5 A and ΔIc(%) increases quickly with increasing H2, in fact, only a few measurements at the higher fields can be plotted on this scale. The percentage changes illustrate that the VTM for Ic up to 140 A are much more sensitive to heater power than at the higher currents. In general, for a given superconducting wire, the percentage change of Ic with temperature is higher at the lower critical currents, as can be seen in Figs. 1 and 2. The only possible exception to this rule is for Ic below 1 A for these wires, which would be in the tail region of the Ic(T) curves. An important result of this work is that the protocol of these measurements is more influential when Ic is low, below 150 A, than when Ic is high for the wires measured here. All of the measurements versus H2 are shown in the plot of ΔIc(A) in Fig. 24. The ΔIc(A) is approximately linear with H2 and the slopes (A/W) increase with increasing Ic for the lower critical currents, then the slopes are more constant at the higher currents. The ΔIc(%) for each Ic is also approximately linear with H2 and the slopes (%Ic/W) decrease with increasing Ic. When Ic is 750 A, all of the measurements with H2 between 0.04 and 0.2 W are within 1 % of the correct value.
We can also look at the horizontal distance in Fig. 23 (see the horizontal line segments in the plot) between Ic gas and the expected line, which we call the apparent temperature error, ΔT. We have postulated that the dependence of ΔIc on H2 power is due to sub-cooling of the sample. If this is true, we should not examine ΔIc versus H2 power, but ΔT as a function of H2 power. The relationship should represent the mechanism that changes Ic and thus, ΔT should be the intrinsic factor that does not depend on the sensitivity of Ic to temperature at the particular magnetic field, temperature, or strain. A plot of ΔT versus H2 is shown in Fig. 26 for the same measurements as shown in Figs. 24 and 25. The slope of ΔT with H2 is nearly the same (about −0.45 K/W) for Ic from 23 to 750 A for the VTO probe. Only the lowest Ic of 5 A has a different slope, which may be due to nonlinear temperature effects as Ic gets closer to zero. Whatever the cause, the 5 A Ic should be ignored. The fairly constant slope of ΔT with H2 confirms the sub-cooling postulate and that the value of H2 is a clear indicator of the sub-cooling of the sample. The four curves with Ic from 23 to 140 A fall nearly on top of each other and show that the measurement needs to be made with H2 about 0.01 W in order to get the correct Ic. As Ic increases, the curves shift to the right and the correct H2 increases to about 0.1 W at 750 A. For all Ic values, there is a range of H2 values where ΔT is within ±20 mK. For Ic values less than 150 A, H2 needs to be less than 0.05 W for ΔT to be within ±20 mK.
We can plot the same ΔT versus H1 as shown in Fig. 27. There are similarities between the plots of ΔT versus H1 and of ΔT versus H2. The lowest Ic should be ignored again. The four curves with Ic from 23 to 140 A fall nearly on top of each other. As Ic increases, the curves shift to the right. The slope of ΔT with H1 is fairly constant (−0.50 to −0.65 K/W) for Ic from 23 to 750 A for the VTO probe. In all cases, H1 is less than H2.
Liquid/gas comparisons on other samples
These liquid/gas comparisons were also conducted on the VTO probe with a Nb-Ti sample that was soldered to a stainless-steel mandrel, with a Nb3Sn sample that was soldered to a stainless-steel mandrel, and with a Nb3Sn sample that was not soldered to a Ti-6-4 mandrel. Comparing these four cases gives information about the effect of sample type, soldering to the mandrel or not, and reproducibility.
A liquid/gas comparison on the VTO probe with Nb3Sn #1 sample that was soldered to a stainless-steel mandrel is shown in the next three figures. A plot of ΔIc(A) versus H2 is shown in Fig. 28 and a plot of ΔIc(%) versus H2 is shown in Fig. 29 for various magnetic fields where Ic varies from 79 A at 16 T to 770 A at 5 T. A plot of ΔT versus H2 is shown in Fig. 30 for the same measurements as shown in Figs. 28 and 29. The ΔT versus H2 plots for Nb3Sn #1 and the Nb-Ti (Fig. 26) samples are nearly the same. This indicates that this relationship among ΔT, H2, and Ic is an important property of the VTM system is independent of sample type. The ΔIc plots for these same two samples have scales that are different by about a factor of 3 because the temperature dependence of the Nb3Sn sample is much less than that of the Nb-Ti sample at the same Ic. Notice that at the highest field (16 T), the Nb3Sn sample still had an Ic of 79 A. The ΔIc(%) plot for the Nb3Sn sample illustrates that VTM are much more sensitive to heater power at the lower currents than at the higher currents, which is also what was observed on the Nb-Ti sample.
Fig. 28.
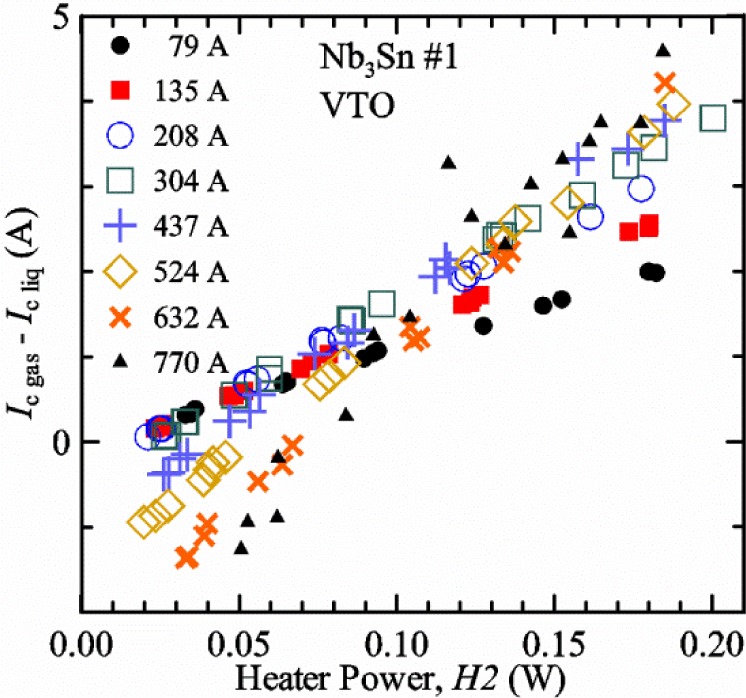
Difference Ic gas − Ic liq versus the average heater power of control loop #2 (H2) at various magnetic fields where Ic varies from 79 A to 770 A at 5 K for Nb3Sn #1 soldered to a stainless-steel mandrel and measured on the VTO probe.
Fig. 29.
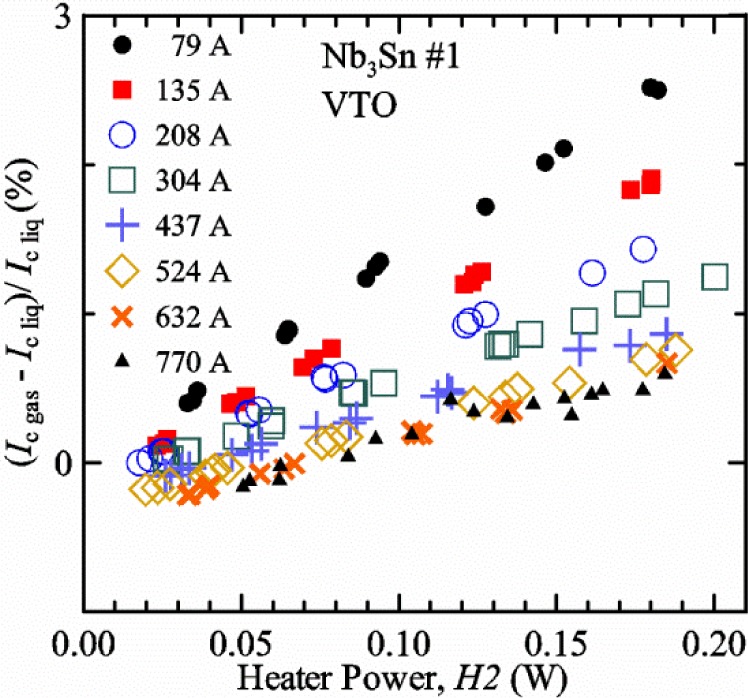
Percentage difference (Ic gas − Ic liq)/Ic liq versus the average heater power of control loop #2 (H2) at various magnetic fields where Ic varies from 79 to 770 A at 5 K for Nb3Sn #1 probe soldered to a stainless-steel mandrel and measured on the VTO.
Fig. 30.
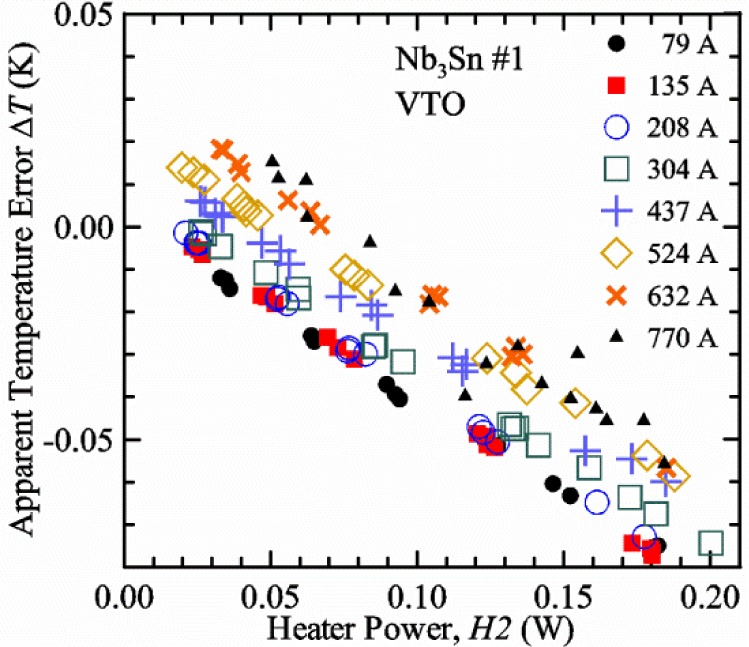
Apparent temperature error ΔT versus the average heater power of control loop #2 (H2) at various magnetic fields where Ic varies from 79 to 770 A at 5 K for Nb3Sn #1 soldered to a stainless-steel mandrel and measured on the VTO probe. These data are from the same set shown on Figs. 28 and 29.
A key value from each curve in Fig. 26 and 30 is the H2 value where ΔT is zero. The value depends on Ic and, if this comparison is reproducible, shows what H2 value will give the correct Ic when measuring in gas. The target H2(Ic) is an important part of the correct protocol. A plot of H2 where the ΔT is zero versus Ic for the four cases are shown in Fig. 31. The two Nb3Sn #1 samples had the same heat treatment and were measured at magnetic fields from 5 T (soldered) and 5.5 T (not-soldered) to 16 T. The values of Ic at 16 T and 5 K (soldered 79 A and not-soldered 107 A) were somewhat different for the two Nb3Sn #1 samples because they had different strain states due to the different mandrel materials and possibly variations from sample to sample. The results on the two Nb-Ti samples are very close to each other. The curve for the Nb3Sn sample that was soldered is also close to that of the Nb-Ti samples. The curve for the Nb3Sn sample that was not soldered is shifted (by ~0.03 W) to slightly higher H2 values. Using the slope of −0.45 K/W, this power shift is equivalent to a T shift of about 0.014 K. We have seen slight changes in Ic, of segments of Nb3Sn samples that are not soldered to the measurement mandrel, with thermal cycling, which was attributed to changes in the strain state of various segments of the sample and the strain sensitivity of Ic in Nb3Sn. Thus, we think that the slight shift to higher H2 values is due to changes in the strain state of the sample between the liquid and gas measurements, which included violent heating (10 to 15 W) to boil away the remaining liquid helium and T cycling to regain T control back at 5 K. These results demonstrate that reproducibility and appropriate H2 values are unrelated to sample type and whether or not the sample was soldered to a mandrel.
Fig. 31.
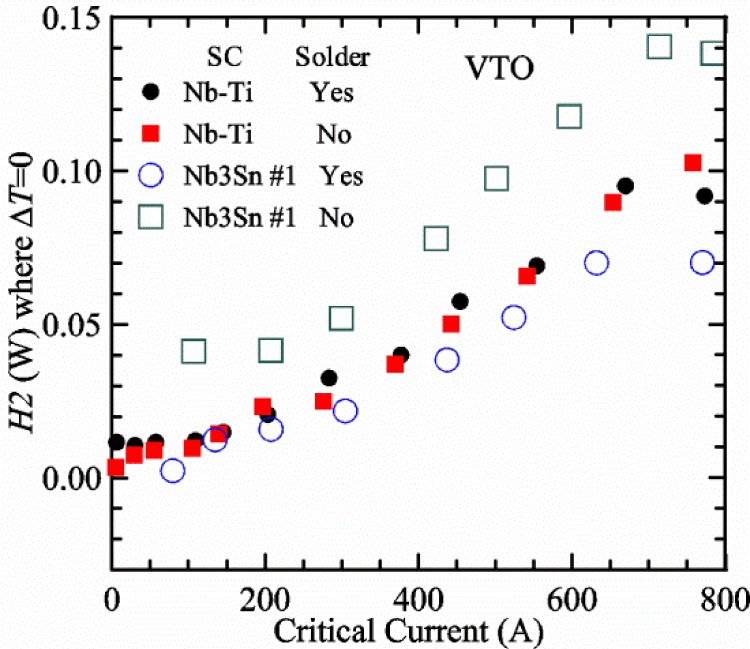
Plot of H2 where ΔT = 0 versus Ic for Nb-Ti and Nb3Sn #1 samples that were soldered and not soldered to the sample mandrel of the VTO probe. Determining the appropriate H2 values as a function of Ic is an important part of the protocol to obtain the correct gas measurements.
A plot of the value of H1 where the ΔT is zero versus Ic for the four cases is shown in Fig. 32. The measurements on the two Nb-Ti samples are very close to each other. The curves for the two Nb3Sn #1 samples are also close to those of the Nb-Ti samples. These values of H1 are lower than the values of H2 in all cases.
Fig. 32.
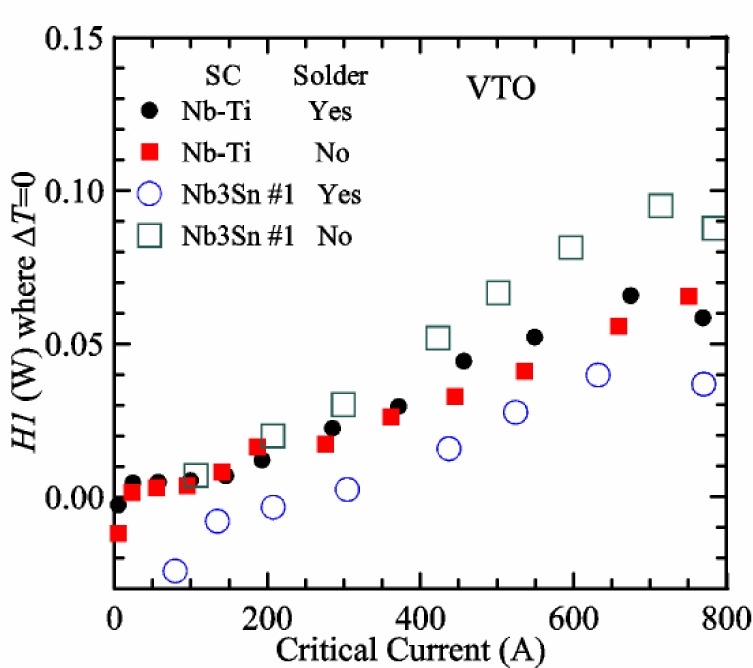
Plot of H1 where ΔT = 0 versus Ic at 5 K for Nb-Ti and Nb3Sn #1 samples that were soldered and not soldered to the sample mandrel of the VTO probe.
We think that Fig. 31 illustrates a key result of our variable temperature measurements from all of the systems we have studied; at low Ic (less than 150 A) the correct gas measurements were taken with H2 between 0 W and 0.01 W. This verified the hypothesis of the high-gas flow system with a pre-regulator since one would expect that the thermometers and the sample would be at the same temperature under these conditions. We think that low Ic here is defined by the amount of self- and contact-heating. With very little self- and contact-heating, the sample needs only a little cooling power to stay at temperature. As Ic increases, the H2 value where ΔT is zero increases nonlinearly with Ic. These H2 values indicate the effective cooling power of gas as it flows over H2. The effective cooling power of gas as it later flows over the sample should scale with H2; it may be dependent on relative surface area and constriction of flow. When the current was near 750 A, the self-heating of the sample was estimated to be about 0.01 W, and the heating of the two current contacts was estimated to be about 0.02 W (top contact) and 0.07 W (bottom contact). At 750 A, the H2 value where ΔT is zero is about 0.1 W, which is about the sum of the self- and contact-heating. Some of the contact heat will flow to the terminals and reduce the heat necessary to hold the terminal temperature, and the remaining power will need to be carried away by the cooling power of the gas. As can be seen in Fig. 21, both H1 and H2 decreased by about 0.1 W after the current ramped up to 750 A. These results indicate that determining appropriate H2 values as a function of Ic is an important part of the protocol to obtain the correct gas measurements. Additionally, the total heater power as a function of Ic is part of the protocol to keep H1 and H2 from going to zero and losing control.
We typically perform a liquid/gas comparison periodically to verify that the curve of H2 where the ΔT is zero, has not changed significantly due to changes in contact resistance, self-heating, or gas flow paths. If there is a section of the sample along the active length that has a lower Ic, this can lead to significant self-heating and can be a terminal flaw for the sample. We monitor the voltage drop along the entire active length of the sample to detect excess voltage drop and self-heating.
There is some relationship between H1 and H2 values because of their proximity, so there will also appear to be some correlation of results with H1; however, we tested this and will present those results later in this paper. The relationship between the two heater powers does allow us to operate the pre-regulator control loop with a target for H1 or for H2. One advantage of using H1 as the target is that it is generally closer to zero power than H2; thus the feedback will operate to keep T1 in control. The pre-regulator control loop heater target becomes the value prior to the V-I curve, since more time is spent with the current “off” than “on.” Thus the target also needs to account for the decrease in sample heater powers that occurs when the sample current comes on as illustrated in Fig. 19. For the VTO probe, the value of H2 when I is near Ic can generally be obtained so that the apparent temperature error ΔT is within ±0.02 K of zero. If more precision is required, two Ic measurements can be made with different heater powers and the correct Ic can be estimated by interpolation or slight extrapolation to the correct H2. This estimation is equivalent to using two points from Fig. 24 to determine what Ic would be at a certain H2. The estimation can be done without knowing the temperature dependence of Ic that would be needed to use a plot similar to Fig. 26.
Measurements at temperatures above 5 K
We cannot do a liquid/gas comparison at temperatures above 5 K, so this leaves the question somewhat open as to whether the same protocol leads to different results at higher temperatures where gas flow rates, thermal conductivity, and heat capacity are different. However, we can still measure Ic gas above 5 K versus heater power and see how it varies. We cannot know the correct Ic, but we can measure the approximate T dependence at two different temperatures and nearly the same heater power and use an arbitrary Ic gas at the lowest heater power as the correct value. Then, we can make plots that look very similar to Figs. 26 and 27, except the curves are shifted arbitrarily so that ΔT = 0 at the lowest heater power. The slope of ΔT versus heater power at any T is not arbitrary and gives some information about the effect of heater power at higher temperatures. A plot of the slope of ΔT(H2) in units of K/W versus Ic is shown in Fig. 33 for the four cases (two samples, two solder conditions) and various temperatures from 5 K to 12 K. All of the data at 5 K (all black symbols) are based on liquid/gas comparisons. As before, we ignore the slopes at very low currents. Solid symbols indicate that the sample was soldered to the mandrel. Red symbols indicate that T was above 5 K. All of these slopes are within a narrow band of values (range about 0.2 K/W) and are relatively independent of Ic. The average slope is −0.41 K/W at 5 K and −0.39 K/W for T greater than 5 K, suggesting that a protocol based on heater power may remove the other effects of temperature. Thus, we expect the protocol to remain similar for a reasonable range of temperatures.
Fig. 33.
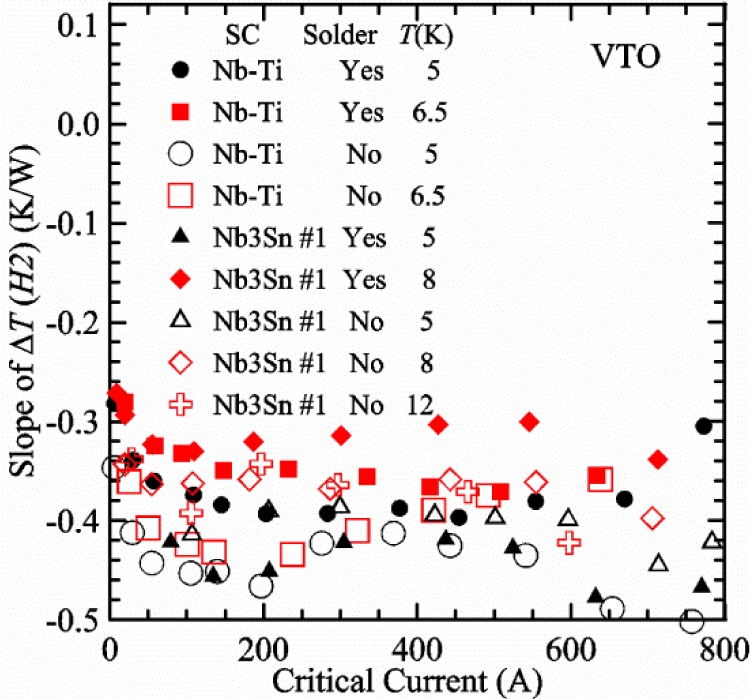
Plot of slope of the ΔT(H2) versus Ic for Nb-Ti (T = 5 and 6.5 K) and Nb3Sn #1 (T = 5, 8, and 12 K) samples that were soldered and not soldered to the sample mandrel of the VTO probe.
For our type of VTM system, we still expect that the correct low Ic values will be measured with H2 values that are less than 0.02 W regardless of the temperature. As we have seen in liquid and gas comparisons at 5 K, as Ic increases for a given conductor, the percentage change of Ic with temperature decreases and thus, if slope of ΔT(H2) stays constant or decreases with temperature, then the protocol at high critical currents is not as crucial at any temperature.
A plot of the slope of ΔT(H1) in units of K/W versus Ic is shown in Fig. 34 for the four cases (two samples, two solder conditions) and various temperatures from 5 K to 12 K. The figure utilizes the same legend as shown in Fig. 33. All of the data at 5 K (all black symbols) are based on liquid/gas comparisons. As before, we ignore the slopes at very low currents. Solid symbols indicate that the sample was soldered to the mandrel. Red symbols indicate that T was above 5 K and tend to be higher than the black symbols. All of the slopes are within a range of about 0.3 K/W and show a tendency to become a more negative value with increasing Ic. The average slope is −0.50 K/W at 5 K and −0.36 K/W for T greater than 5 K.
Fig. 34.
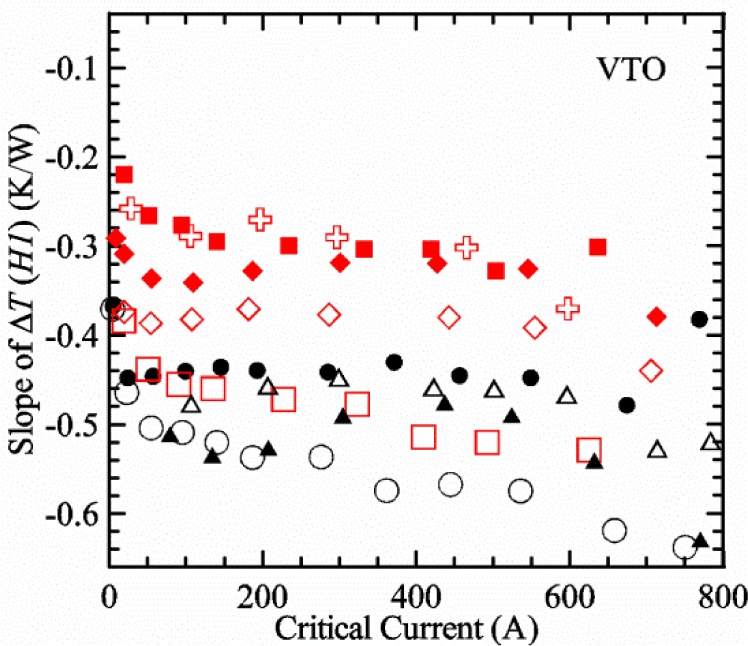
Plot of slope of the ΔT(H1) versus Ic for Nb-Ti (T = 5 and 6.5 K) and Nb3Sn #1 (T = 5, 8, and 12 K) samples that were soldered and not soldered to the sample mandrel of the VTO probe. Same legend as Fig. 33.
Relative influence of H1 and H2 and of T1 and T2; Nb-Ti sample soldered to stainless-steel mandrel in VTO probe
We designed an experiment to study the relative influence of H1 and H2 and of T1 and T2 to attempt to verify our hypothesis that T2 and H2 are more influential than T1 and H1. We introduced a temperature bias, T bias, defined as T1−T2, where T bias = 0, 10, 20, and 30 mK. We made measurements in gas with T2 = 5 K, then at the highest T bias had T1 = 5.03 K. Increasing T bias has two effects: it attempts to create a temperature gradient over the length of the sample and it changes the relationship between H1 and H2 by increasing H1. The helium gas flow will attempt to remove the temperature gradient, and the effective temperature of the sample will indicate the extent to which the gradient is reduced.
For this study we used a Nb-Ti wire soldered to a stainless-steel mandrel on the VTO probe using a non-superconducting In-Ag solder. Reference plots of ΔIc(A), ΔIc(%), and ΔT(K) versus H2 with T bias set to 0 mK are given in Figs. 35–37. The study included measurements to a record highest Ic gas, 981 A at 0.8 T, for the VTO probe. These high-current results are consistent with previous results and show that most of the measurements, at tested H2 values, are within 1 % of the correct value. However, the results with Ic gas > 650 A were slightly less reproducible.
Fig. 35.
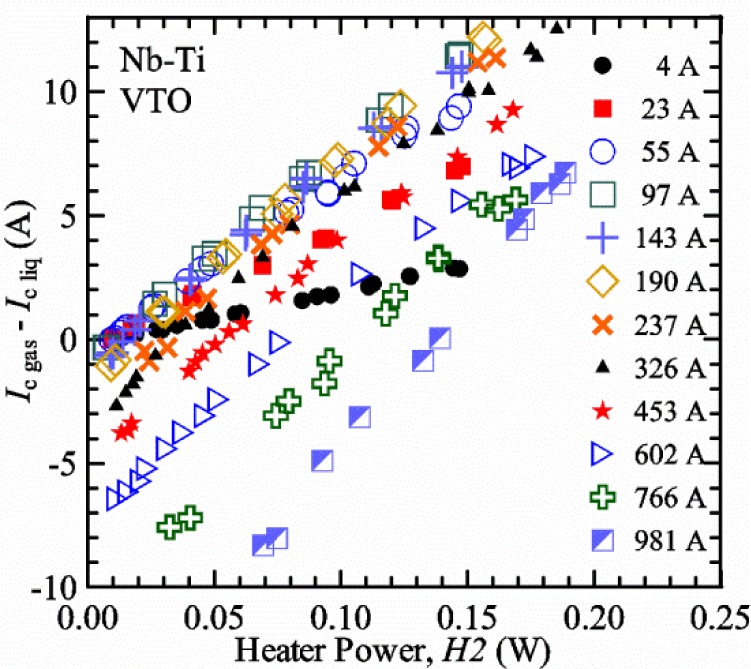
Difference Ic gas − Ic liq versus H2 at various magnetic fields where Ic varies from 4 to 981 A at 5 K for a Nb-Ti wire soldered to a stainless-steel mandrel on the VTO probe.
Fig. 36.
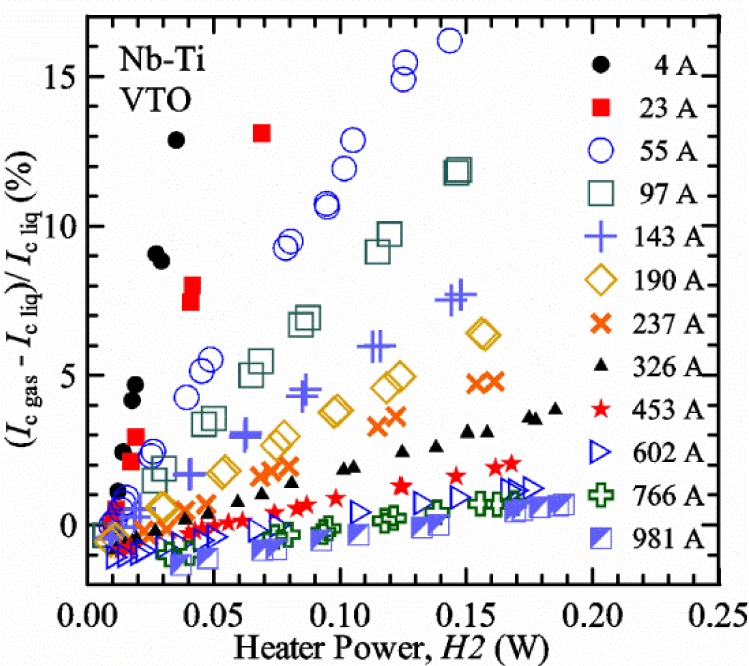
Percentage difference (Ic gas − Ic liq)/ Ic liq versus H2 at various magnetic fields where Ic varies from 4 to 981 A at 5 K for a Nb-Ti wire soldered to a stainless-steel mandrel on the VTO probe.
Fig. 37.
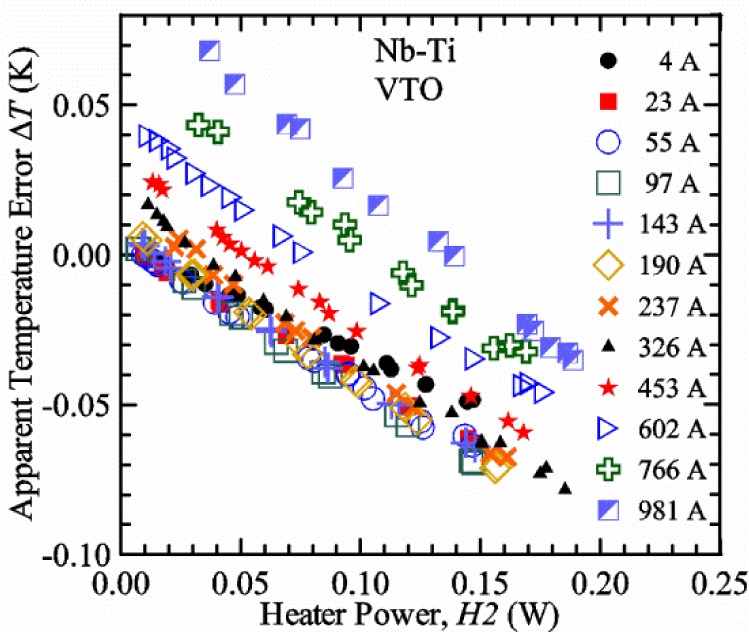
Apparent temperature error ΔT versus H2 at various magnetic fields where Ic varies from 4 to 981 A at 5 K for a Nb-Ti wire soldered to a stainless-steel mandrel on the VTO probe. These data are from the same set shown on Figs. 35 and 36.
We measured the apparent temperature error ΔT versus H2 at 7.5 T and T2 = 5 K where Ic liq was 143 A with T bias values of 0, 10, 20, and 30 mK as shown in Fig. 38. Since T1 and T2 are different, we must determine an appropriately weighted temperature, Tw. For Fig. 38, we used Tw = 0.5 T1 +0.5 T2, which is the simple average of the two temperatures. The extreme case would have Tw = T2, which, with a T bias of 30 mK, would only shift Tw by 15 mK. Thus this study is focused on a small effect. With equal weighting of the two thermometers, the H2 value where ΔT is zero is 13, 6, −1, and −9 mW for T biases of 0, 10, 20, and 30 mK, respectively. Negative values of H2 where ΔT is zero are not realistic, based on the previous findings. Therefore, we need to determine different temperature weights that gives more consistent results. We found, by iteration to minimize the difference in the H2 value where ΔT is zero, that Tw = 0.14 T1 +0.86 T2 collapses the Fig. 38 data onto essentially one line, as shown in Fig. 39. With this Tw equation, the H2 value where ΔT is zero is 9.6, 10.2, 10.3, and 9.4 mW for T biases of 0, 10, 20, and 30 mK. A plot of ΔT versus H1 for the same data set and Tw equation is shown in Fig. 40. As expected, values of H1 increase for a given H2 with increasing T bias. This demonstrates that the values of T1 and H1 are less influential than values of T2 and H2.
Fig. 38.
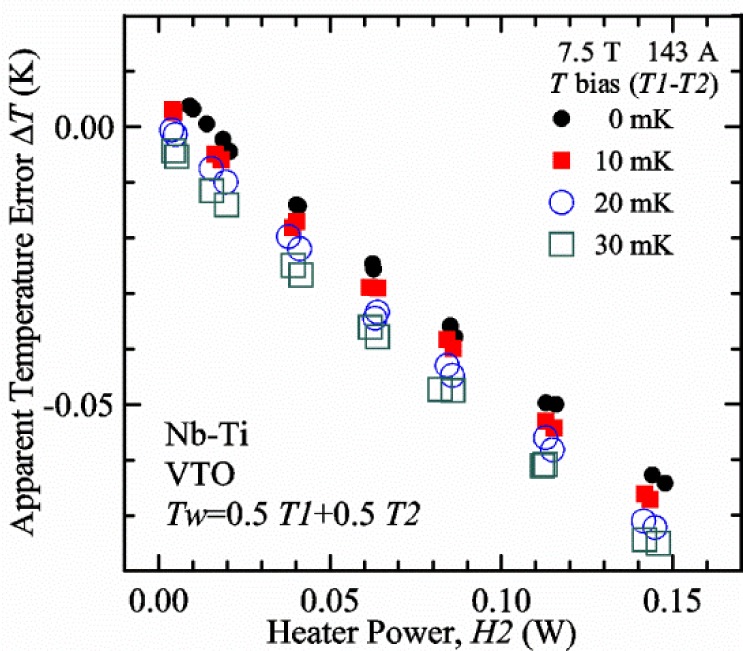
Apparent temperature error ΔT versus H2 at 7.5 T and T2 = 5 K where Ic is about 143 A for a Nb-Ti wire soldered to a stainless-steel mandrel on the VTO probe. The T bias (T1−T2) was set to 0, 10, 20, and 30 mK. The weighted temperature Tw = 0.5 T1+0.5 T2 was used to determine the correct Ic.
Fig. 39.
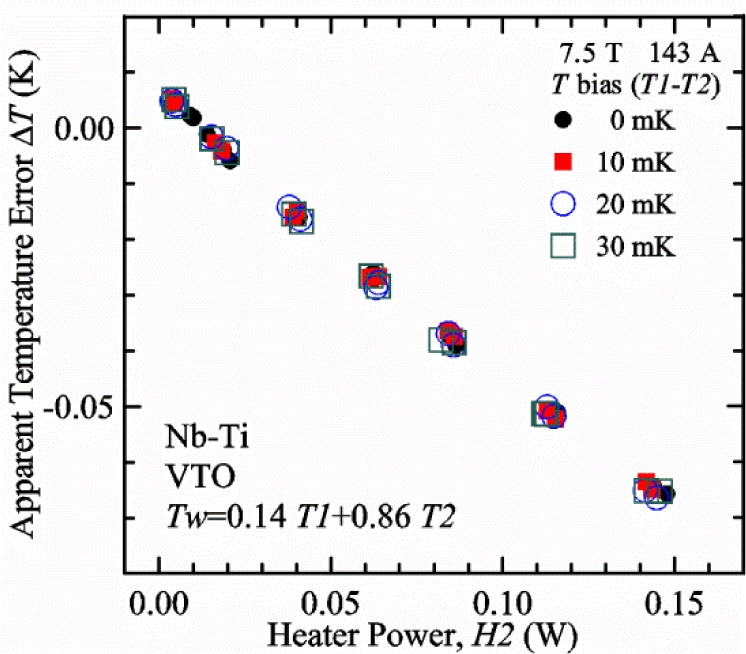
Apparent temperature error ΔT versus H2 at 7.5 T and T2 = 5 K where Ic is about 143 A for a Nb-Ti wire soldered to a stainless-steel mandrel on the VTO probe. The T bias (T1−T2) was set to 0, 10, 20, and 30 mK. The weighted temperature Tw = 0.14 T1+0.86 T2 was used to determine the correct Ic, which collapsed the Fig. 38 data onto one line.
Fig. 40.
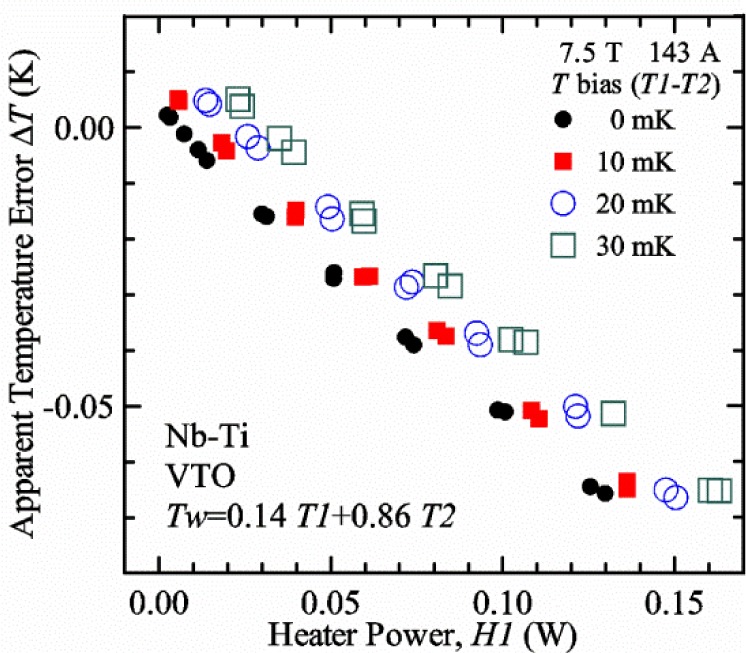
Apparent temperature error ΔT versus H1 at 7.5 T and T2 = 5 K where Ic is about 143 A for a Nb-Ti wire soldered to a stainless-steel mandrel on the VTO probe. The T bias (T1−T2) was set to 0, 10, 20, and 30 mK. The weighted temperature Tw = 0.14 T1+0.86 T2 was used to determine the correct Ic. This shows that the values of T1 and H1 are less influential than T2 and H2.
The value of H2 where ΔT is zero for T bias = 0 mK changed slightly from 13 mW to 10 mW with Tw equation because T1 and T2 were not exactly equal when Ic was measured in liquid. The difference between T1 and T2 in liquid was 4 mK at 7.5 T and varied from 0 to 5 mK for the 22 magnetic fields due to: calibration error, magnetoresistance correction error, noise, and hydrostatic head. We decided to use the same Tw equation to calculate the temperature assigned to each Ic liq value to effectively create a consistent “thermometer” for the comparison. This was a very minor effect and it is mentioned only for completeness.
Measurements of ΔT versus H2 were also made at a number of magnetic fields/critical currents and T biases as summarized in Fig. 41. The figure shows that H2 where ΔT is zero has a similar dependence on T bias over the whole range of Ic values with the simple average Tw equation. When Tw = 0.14 T1+0.86 T2 was used to determine the correct Ic, as shown in Fig. 42, effectively all of the Fig. 41 data collapsed onto one curve, indicating that the scaling optimized on 143 A also works from 4 to 981 A. Figure 43 shows H1 where ΔT is zero versus Ic with the same Tw equation (Tw = 0.14 T1+0.86 T2), illustrating that the value of H1 where the correct Ic is determined can be systematically varied by changing T bias. In general, we did not need to operate the VTO probe using a non-zero T bias, as can be seen in Fig. 43, because the values of H1 where ΔT = 0 are all positive or very close to zero for all critical currents.
Fig. 41.
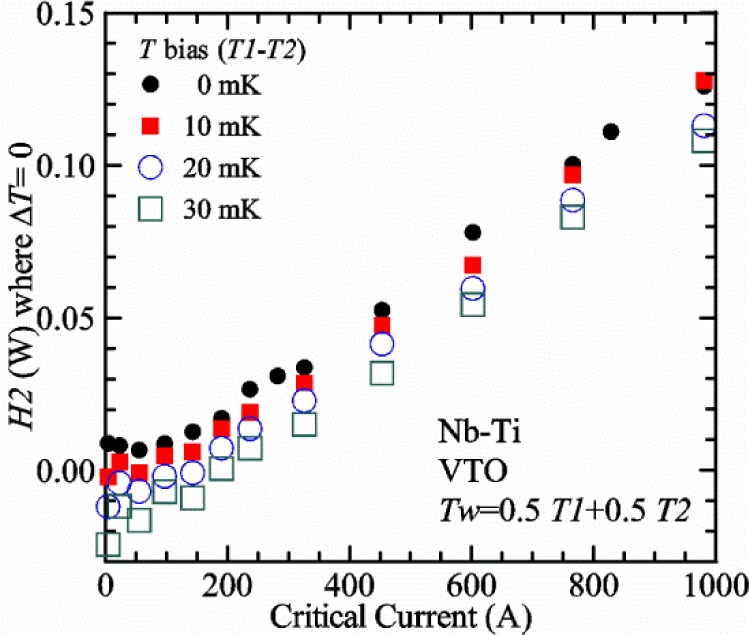
Plot of H2 where ΔT = 0 versus Ic at 5 K for a Nb-Ti wire soldered to a stainless-steel mandrel on the VTO probe. The T bias (T1−T2) was set to 0, 10, 20, and 30 mK. The weighted temperature Tw = 0.5 T1+0.5 T2 was used to determine the correct Ic.
Fig. 42.
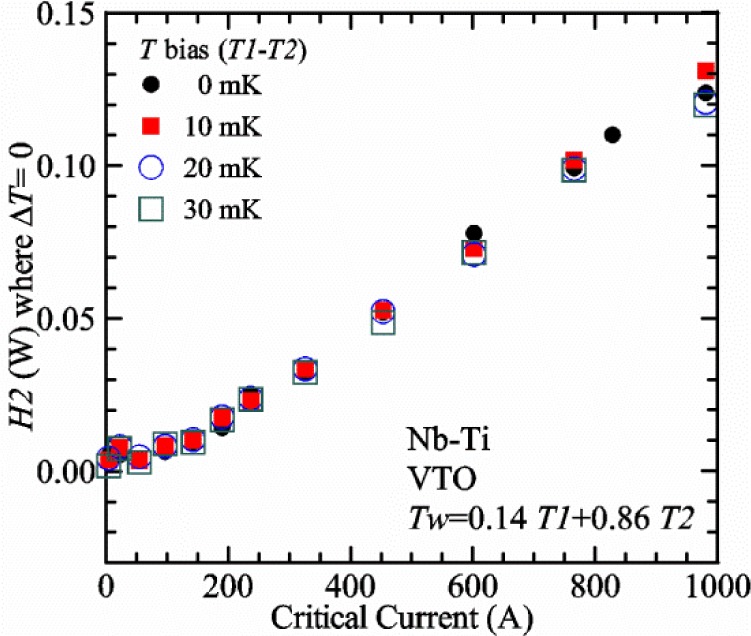
Plot of H2 where ΔT = 0 versus Ic at 5 K for a Nb-Ti wire soldered to a stainless-steel mandrel on the VTO probe. The T bias (T1−T2) was set to 0, 10, 20, and 30 mK. The weighted temperature Tw = 0.14 T1+0.86 T2 was used to determine the correct Ic, which collapsed the Fig. 41 data onto one curve.
Fig. 43.
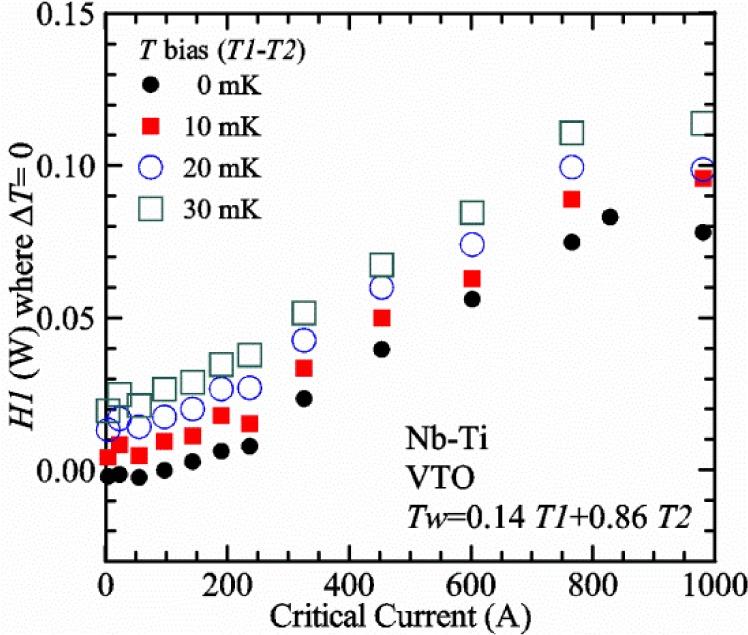
Plot of H1 where ΔT = 0 versus Ic at 5 K for a Nb-Ti wire soldered to a stainless-steel mandrel on the VTO probe. The T bias (T1−T2) was set to 0, 10, 20, and 30 mK. The weighted temperature Tw = 0.14 T1+0.86 T2 was used to determine the correct Ic.
The T-bias experiment focused on a small effect. For a T bias of 30 mK, changing from Tw = 0.5 T1 +0.5 T2 to Tw = 0.14 T1 +0.86 T2 only reduces Tw from 5.015 K to 5.0042 K. So, at the largest T bias studied here, the shift in T is only 0.0108 K. Generally, a non-zero T bias is not necessary to operate the VTO probe; however, using a finite T bias with the VTS probe was found to be useful and allowed H2 to be lower without H1 going to zero.
The T-bias experiment could not separate the influence of T1 and H1. However, a Tw equation that seems reasonable, considering the gas flow direction, scales the results. Thus T1 has only a slight influence on the correct protocol, and the value of H1 may have no influence. This is a consideration because the relationship between H1 and H2 sometimes changes with time and with temperature, and one wants to know which heater power to consider in the correct protocol. Slight changes in the relationship are likely due to changes in gas-flow patterns caused by the shifting of the probe in the dewar, blockages that develop or change with time, and relative changes in thermometer calibrations. The findings from the T-bias experiment on the VTS probe given below support the postulate that the value of H1 is not an influential parameter for these measurements.
3.3 Verification Measurements with the Variable-Temperature and Variable-Strain (VTS) Probe
Liquid/gas comparisons on a Nb-Ti sample mounted and soldered on Cu-Be spring
The next 13 figures contain data that were taken on a single tap (V1) and Nb-Ti wire, using the VTS probe with the sample mounted and soldered to the Cu-Be spring. The influence of T bias is included from the beginning and it was studied with twice the range of T biases because the region of interest for H2 had H1 values near zero or ideally (not physically possible) slightly negative. The temporal plots using the VTS probe were very similar to those of the VTO probe shown in Figs. 15–19, so we will not show those figures for the VTS probe.
Figure 44 shows the average Pre-Reg power just prior to the V-I curve (solid circles) and the average power during the time when the current is near Ic (open circles) as a function of Ic for a Nb-Ti sample at 5 K in gas. We varied the applied magnetic field to increase Ic from about 5 A at 9.5 T to 708 A at 1.75 T. The T bias was set to 0 mK for these measurements. Most of the discussion points made on the corresponding Fig. 20 for the VTO probe apply to Fig. 44 for the VTS probe. Since we needed to acquire a matrix of data at different H2 and T bias values at each Ic, some of the Pre-Reg power points may not have been in static equilibrium, which likely caused the non-monotonic differences between the two powers with Ic. For this sequence of measurements, the target Pre-Reg values were high enough that the Pre-Reg power did not go to zero during any of the V-I curves.
Fig. 44.
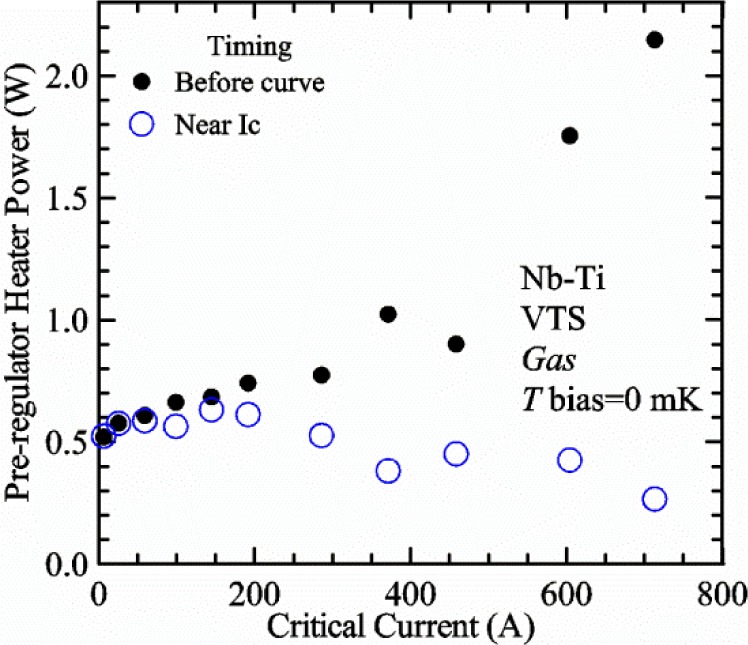
Pre-regulator heater power versus Ic for a set of measurements on a Nb-Ti sample at 5 K, in gas, and on the VTS probe. The solid circle symbols indicate the average heater power before each V-I curve was taken and the open circle symbols indicate the average heater power during the time that the sample current was near Ic. T bias (T1−T2) was set to 0 mK.
Figure 45 shows the average H1 and H2 powers just prior to the V-I curve (solid symbols) and the average powers during the time when the current is near Ic (open symbols) as a function of Ic for a Nb-Ti sample at 5 K in gas. These measurements were made for the same curves as those shown in Fig. 44. The T bias was set to 0 mK for these measurements. The somewhat higher H2 at the lowest Ic is likely due to the system not being completely stable when data acquisition started. The target H1 power is about 0.005 W for low Ic and is about 0.08 W for Ic of 708 A. These targets are set based on prior knowledge of how much the power decreases during a curve. Based on the liquid/gas comparison, H2 needs to be a little lower than is possible without H1 going to zero in order to obtain the correct Ic gas. Thus, the goal for the VTS probe is to have H1 be as low as possible when the current is near Ic. For this set of data when the current is near Ic, H1 was between 0.001 and 0.01 W.
Fig. 45.
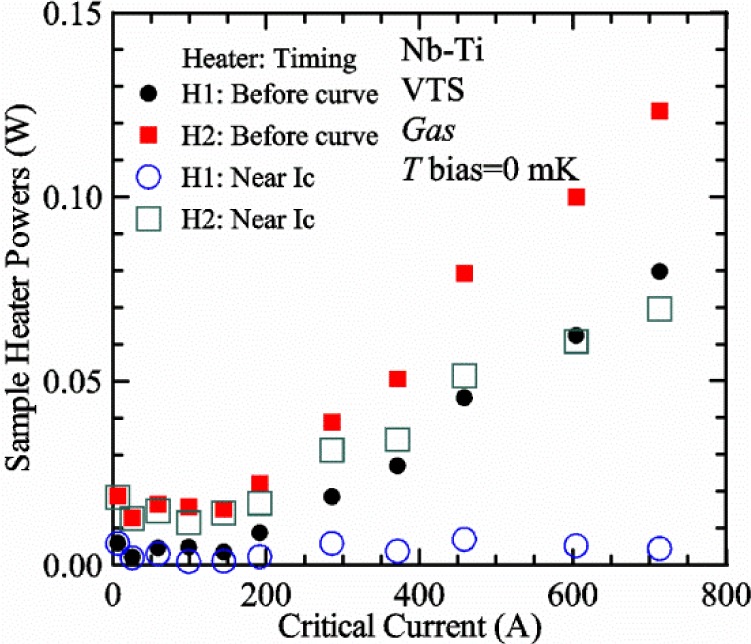
Sample heater powers H1 and H2 versus Ic for a set measurements on a Nb-Ti sample at 5 K, in gas, and on the VTS probe. The solid symbols indicate the average heater power before each V-I curve was taken and the open symbols indicate the average heater power during the time that the sample current was near Ic. T bias (T1−T2) was set to 0 mK.
To lower the obtainable H2, we need a T bias that increases the cooling power for H1. Figure 46 shows the average Pre-Reg power just prior to the V-I curve (solid circles) and the average power during the time when the current is near Ic (open circles) as a function of Ic. The T bias (T1−T2) was set to 60 mK for these measurements. T bias did not have a noticeable change to Pre-Reg power. Figure 47 shows the average H1 and H2 powers just prior to the V-I curve (solid symbols) and the average powers during the time when the current is near Ic (open symbols) as a function of Ic with T bias = 60 mK. This T bias allowed H1 to be close to or above H2 just prior to the curve and allowed H2 to be low without H1 going to zero when the current was on, as can be seen by comparing H2 values on Figs 45 and 47. H1 dropped more when the current was on than H2 did in both figures, which was due to a higher heat load from the sample current on the top terminal.
Fig. 46.
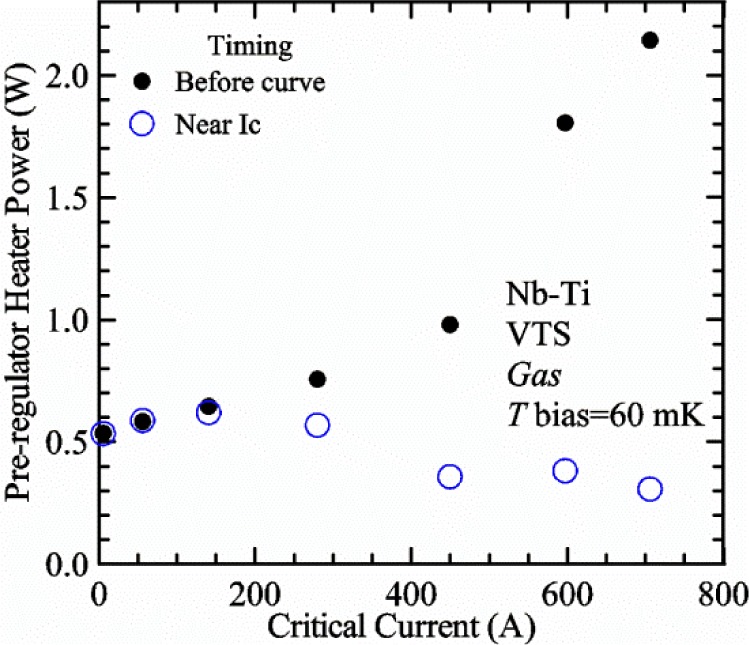
Pre-regulator heater power versus Ic for a set of measurements on a Nb-Ti sample at 5 K, in gas, and on the VTS probe. The solid circle symbols indicate the average heater power before each V-I curve was taken and the open circle symbols indicate the average heater power during the time that the sample current was near Ic. T bias (T1−T2) was set to 60 mK.
Fig. 47.
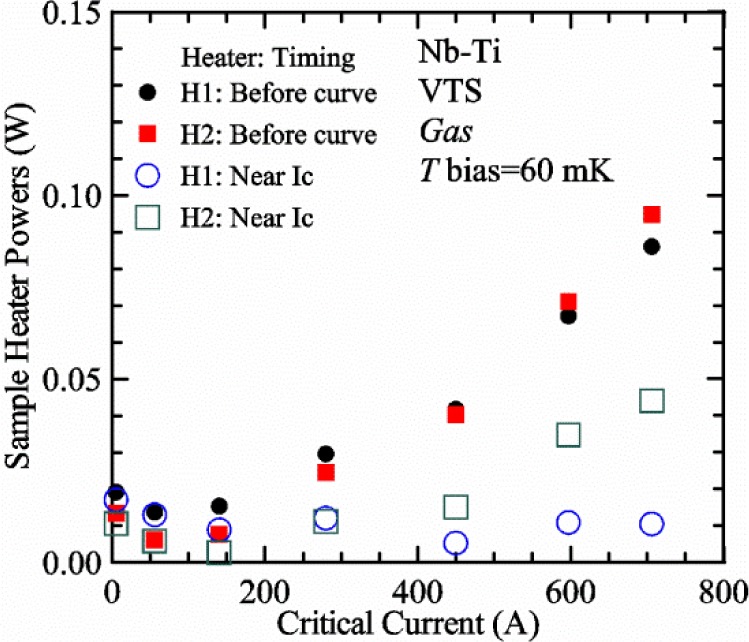
Sample heater powers H1 and H2 versus Ic for a set measurements on a Nb-Ti sample at 5 K, in gas, and on the VTS probe. The solid symbols indicate the average heater power before each V-I curve was taken and the open symbols indicate the average heater power during the time that the sample current was near Ic. T bias (T1−T2) was set to 60 mK, which allowed H2 to be lower without H1 going to zero.
A plot of ΔIc(A) versus H2 is shown in Fig. 48 and a plot of ΔIc(%) versus H2 is shown in Fig. 49 for various magnetic fields where Ic varies from 5 A at 9.5 T to 708 A at 1.75 T with T bias = 0 mK. For any figure in this paper that has H2 on the x-axis, the values of H2 are the average values when I is near Ic, not H2 just prior to the V-I curve. At 9 T, the Ic is 24 A and ΔIc(%) increases quickly with increasing H2; in fact, only a few measurements at the higher fields can be plotted on this scale. When Ic liq = 97 A, an H2 of about 0.1 W causes Ic gas to be more than 20 % higher than the correct value. Comparing Figs. 36 (VTO) and 49 (VTS) shows that the ΔIc(%) of the VTS probe is about 2.5 times more sensitive to heater power than the VTO probe for the same sample. The percentage changes illustrate that VTM for Ic below 200 A are much more sensitive to heater power than those at the higher currents. An important result of this work is that the measurement protocol is more influential when Ic is below 200 A. All of the measurements versus H2 are shown in a plot of ΔIc(A) in Fig. 48. The ΔIc(A) is approximately linear with H2 and the slopes (A/W) increase with increasing Ic for the lower critical currents, then the slopes are more constant at the higher currents. The ΔIc(%) for each Ic, is also approximately linear with H2 and the slopes (%Ic/W) decrease with increasing Ic.
Fig. 48.
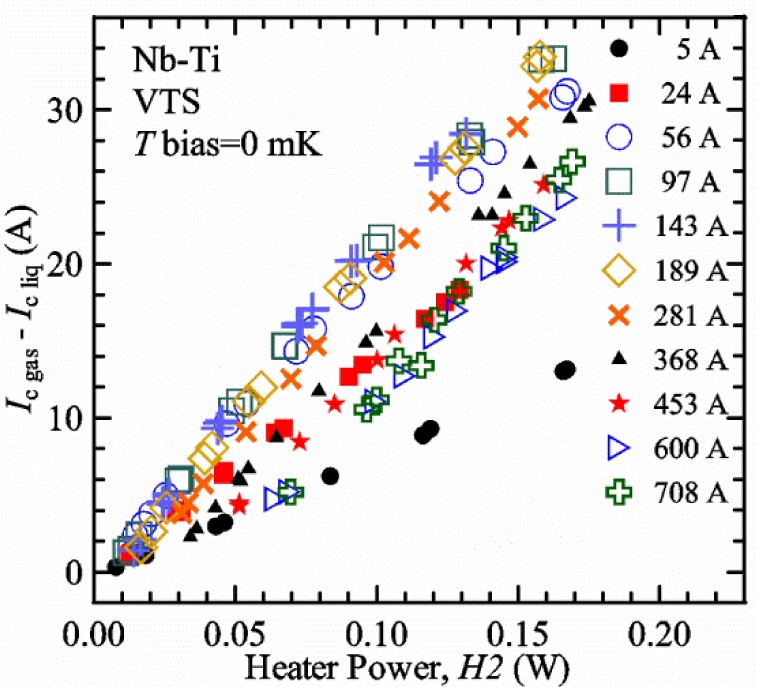
Difference Ic gas − Ic liq versus H2 at various magnetic fields where Ic varies from 5 A to 708 A at 5 K for a Nb-Ti wire soldered to a Cu-Be spring on the VTS probe. T bias (T1−T2) was set to 0 mK.
Fig. 49.
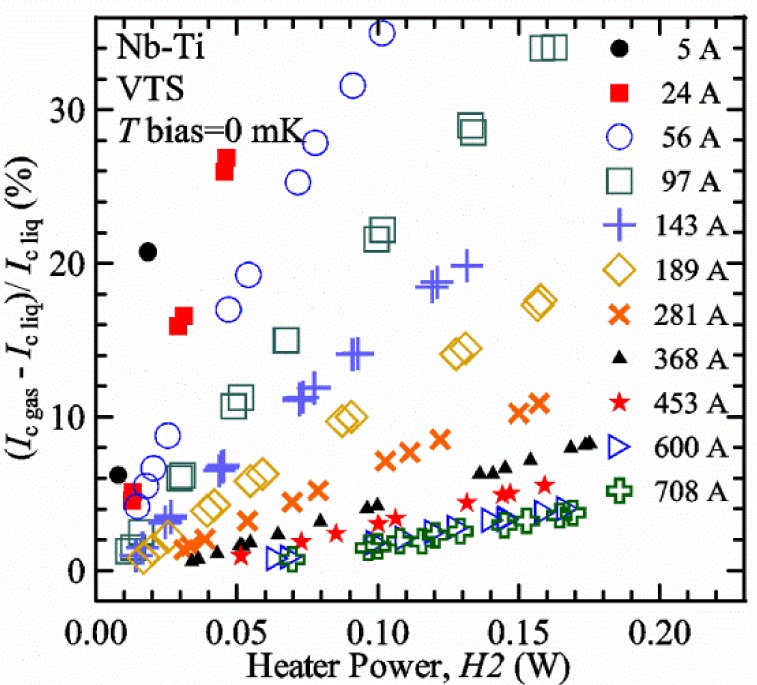
Percentage difference (Ic gas − Ic liq)/ Ic liq versus H2 at various magnetic fields where Ic varies from 5 A to 708 A at 5 K for a Nb-Ti wire soldered to a Cu-Be spring on the VTS probe. T bias (T1−T2) was set to 0 mK.
The apparent temperature error ΔT versus H2 is shown in Fig. 50 for the same measurements as shown in Figs. 48 and 49. The slope of ΔT with H2 is nearly the same (about −1.28 K/W) for Ic from 5 A to 708 A for the VTS probe. The slope is about 2.8 times the value found for the VTO probe. The fairly constant slope of ΔT with H2 confirms the sub-cooling postulate and that the value of H2 is a clear indicator of the sub-cooling of the sample. The six curves with Ic from 5 A to 189 A fall nearly on top of each other and show that the measurement needs to be made with H2 at most 0.01 W in order to get the correct Ic. As Ic increases, the curves shift to the right and the correct H2 increases to about 0.046 W at 708 A. For all Ic values, there is a range of H2 values where ΔT is within 50 mK, but none of the available H2 values gives a positive ΔT, in contrast to the findings for the VTO probe shown in Fig. 37.
Fig. 50.
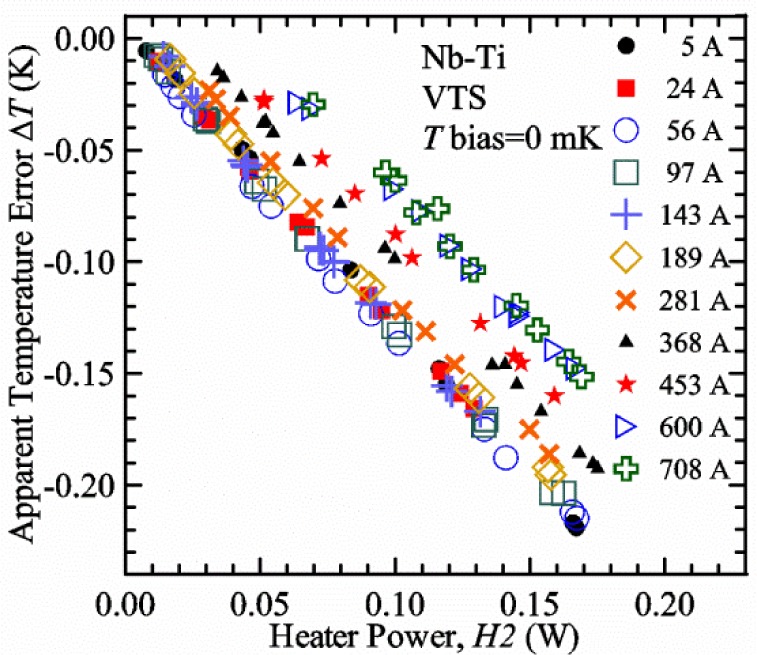
Apparent temperature error ΔT versus H2 at various magnetic fields where Ic varies from 5 A to 708 A at 5 K for a Nb-Ti wire soldered to a Cu-Be spring on the VTS probe. T bias (T1−T2) was set to 0 mK. These data are from the same set shown on Figs. 48 and 49.
A plot of ΔT versus H1 is shown in Fig. 51 for the VTS probe, and it is very different from the corresponding Fig. 27 for the VTO probe. All of the curves in Fig. 51 fall nearly on top of each other. The slope of ΔT with H1 is fairly constant (−1.90 to −2.25 K/W) for Ic from 5 A to 708 A for the VTS probe. All H1 values where ΔT is zero are negative and range from −0.005 W to −0.015 W with T bias = 0 mK. This result shows that no extra H1 heating power is needed as the self- and contact-heating increase with Ic. It also indicates that the attempt to have some of the gas flow bypass H2 and the sample to directly cool H1 was largely unsuccessful. However, there is one distinct advantage of this result: all of H1 values where ΔT is zero are about the same, −0.01 W, regardless of Ic. This negative power is not achievable, thus a finite T bias is needed.
Fig. 51.
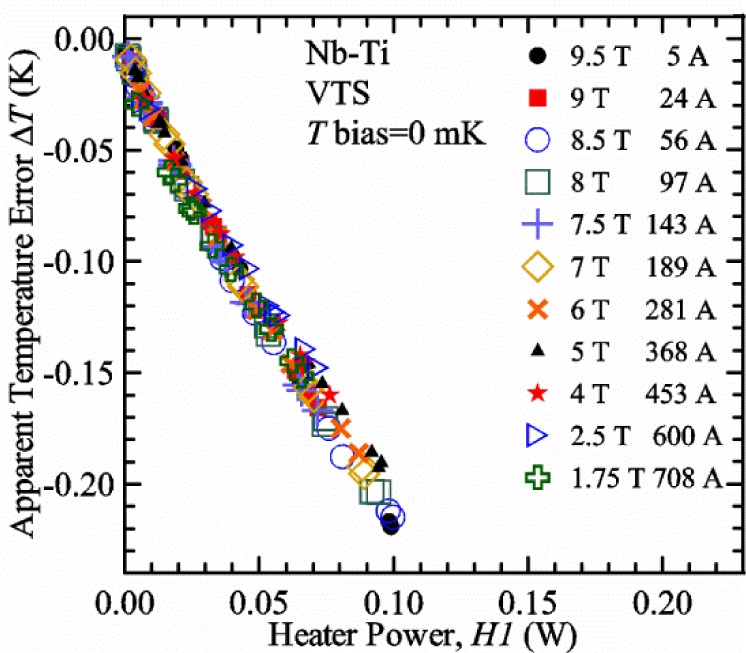
Apparent temperature error ΔT versus H1 at various magnetic fields where Ic varies from 5 A to 708 A at 5 K for a Nb-Ti wire soldered to a Cu-Be spring on the VTS probe. These data are from the same set shown on Figs. 48–50.
We measured ΔT versus H2 at 7.5 T and T2 = 5 K in gas where Ic liq was 143 A with T bias values of 0, 20, 40, and 60 mK and using Tw = 0.5 T1 +0.5 T2 as shown in Fig. 52. With the equal weighting of the two thermometers, the H2 value where the ΔT is zero, are 5, 0, −5, and −9 mW for T biases of 0, 20, 40, and 60 mK, respectively. Negative values of H2 where ΔT is zero are not realistic based on the previous findings. Therefore, we need to determine a new temperature weight that gives more consistent results. We found, by iteration to minimize the discrepancies in the H2 values where ΔT is zero, that Tw = 0.18 T1 +0.82 T2 collapses the Fig. 52 data onto essentially one line in Fig. 53. With this Tw equation, the H2 value where the ΔT is zero is 2.0, 2.3, 1.6, and 2.1 mW for T biases of 0, 20, 40, and 60 mK, respectively. As with the VTO probe results, the value of H2 where ΔT is zero for T bias = 0 mK changed with the Tw equation because T1 and T2 were not exactly equal when measured in liquid and the same Tw equation was used to calculate the temperature assigned to each Ic liq value.
Fig. 52.
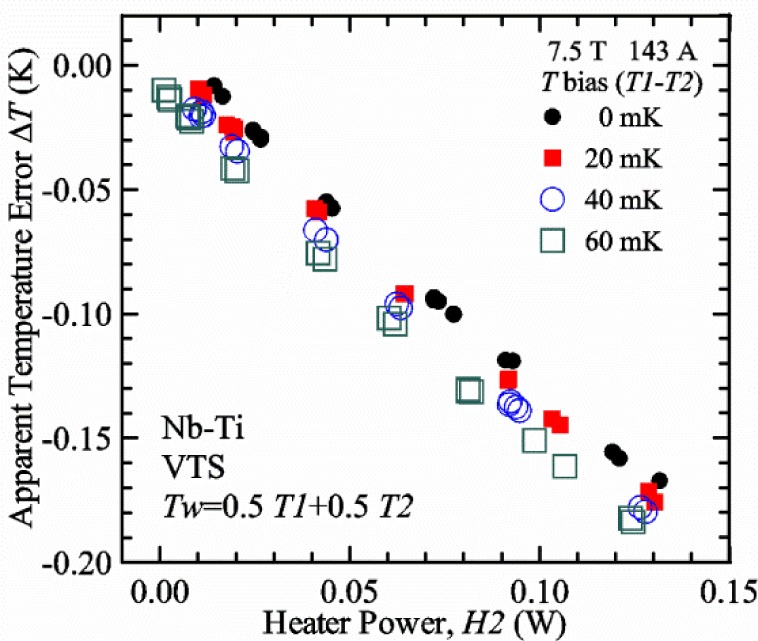
Apparent temperature error ΔT versus H2 at 7.5 T and T2 = 5 K where Ic is about 143 A for a Nb-Ti wire soldered to a Cu-Be spring on the VTS probe. The T bias (T1−T2) was set to 0, 20, 40, and 60 mK. The weighted temperature Tw = 0.5 T1+0.5 T2 was used to determine the correct Ic.
Fig. 53.
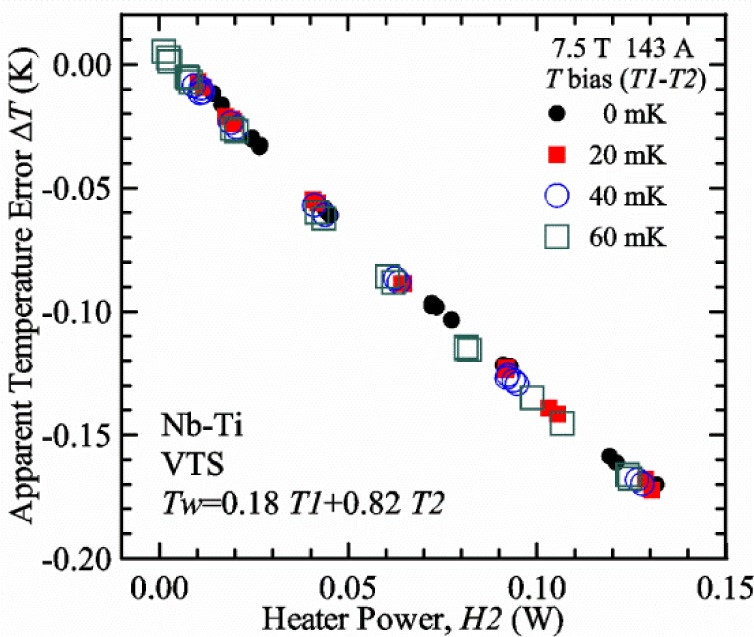
Apparent temperature error ΔT versus H2 at 7.5 T and T2 = 5 K where Ic is about 143 A for a Nb-Ti wire soldered to a Cu-Be spring on the VTS probe. The T bias (T1−T2) was set to 0, 20, 40, and 60 mK. The weighted temperature Tw = 0.18 T1+0.82 T2 was used to determine the correct Ic, which collapsed the Fig. 52 data onto one line.
Measurements of ΔT versus H2 were also made at a number of magnetic fields/critical currents and T biases as summarized in Fig. 54. The figure shows that H2 where ΔT is zero has a similar dependence on T bias over the whole range of Ic values with the simple average Tw equation. When Tw = 0.14 T1+0.86 T2 was used to determine the correct Ic, as shown in Fig. 55, essentially all of the Fig. 54 data collapsed onto one curve, indicating that the scaling optimized on 143 A also works from 5 A to 708 A. Figure 56 shows H1 where ΔT is zero versus Ic with Tw = 0.14 T1+0.86 T2. The figure illustrates that the value of H1 where the correct Ic is determined can be systematically varied by changing T bias. A T bias of 20 mK shifts the average value of H1 for the correct Ic to about 0 W. A T bias of 40 mK or higher allows H1 to be positive when ΔT = 0 for the full range of Ic.
Fig. 54.
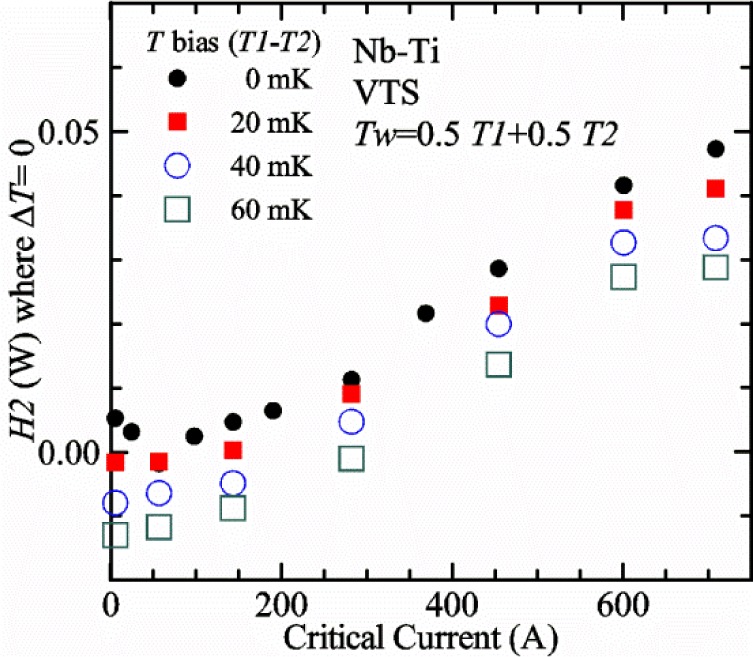
Plot of H2 where ΔT = 0 versus Ic at 5 K for a Nb-Ti wire soldered to a Cu-Be spring on the VTS probe. The T bias (T1−T2) was set to 0, 20, 40, and 60 mK. The weighted temperature Tw = 0.5 T1+0.5 T2 was used to determine the correct Ic.
Fig. 55.
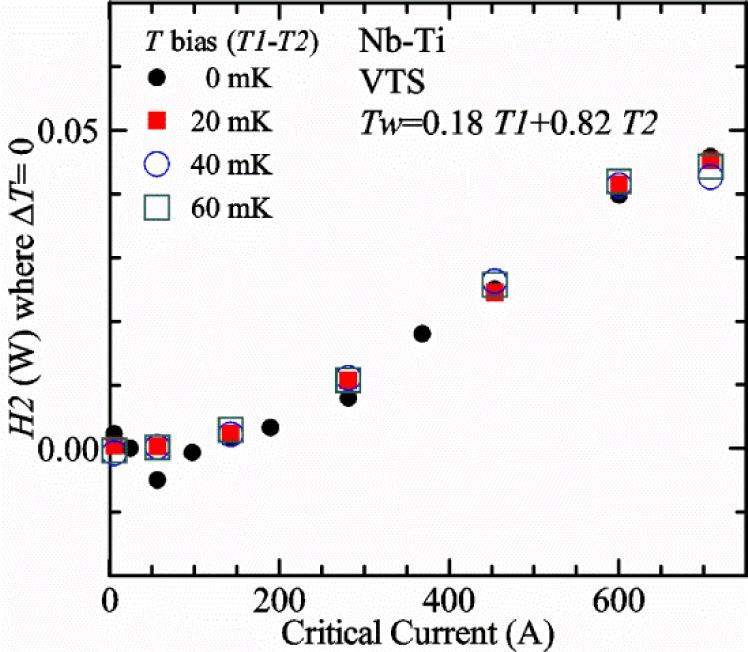
Plot of H2 where ΔT = 0 versus Ic at 5 K for a Nb-Ti wire soldered to a Cu-Be spring on the VTS probe. The T bias (T1−T2) was set to 0, 20, 40, and 60 mK. The weighted temperature Tw = 0.18 T1+0.82 T2 was used to determine the correct Ic, which collapsed the Fig. 54 data onto one curve.
Fig. 56.
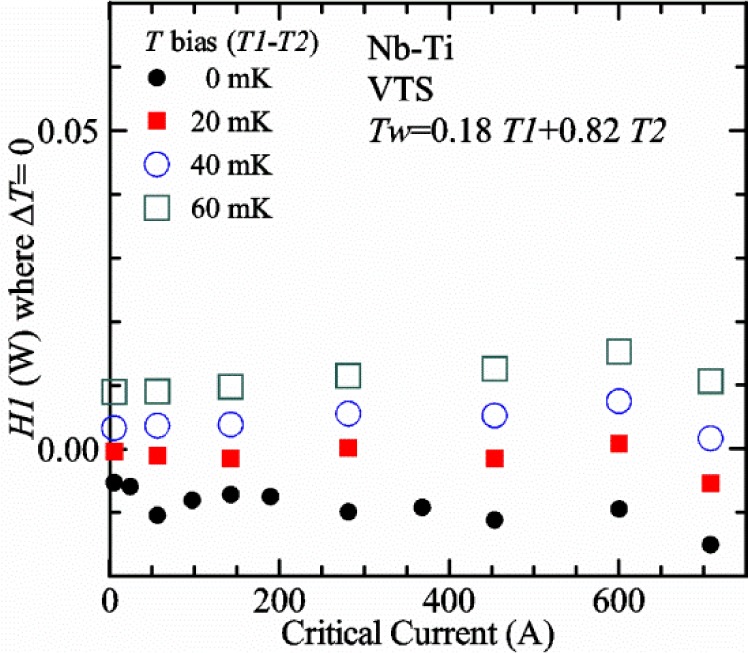
Plot of H1 where ΔT = 0 versus Ic at 5 K for a Nb-Ti wire soldered to a Cu-Be spring on the VTS probe. The T bias (T1−T2) was set to 0, 20, 40, and 60 mK. The weighted temperature Tw = 0.18 T1+0.82 T2 was used to determine the correct Ic. T bias of 40 mK or higher allows H1 to be positive when ΔT = 0.
Liquid/gas comparisons on other samples
The liquid/gas comparisons were also conducted on the VTS probe with the two Nb3Sn samples and one MgB2 sample that were soldered to the T-section spring. We use the Nb-Ti results as a reference. A comparison of results from the four samples gives information about the effect of sample type and reproducibility. A key value from each curve in Fig. 50 is the H2 value where ΔT is zero. This value depends on Ic and, if the comparison is reproducible, the value indicates the H2 power that will yield the correct Ic when measuring in gas. A plot of H2 where ΔT is zero versus Ic for the seven cases are shown in Fig. 57. Each of the two Nb3Sn samples was measured with different applied strains, and in some cases, on the very same specimen. One Nb3Sn #1 sample was measured at a strain of 0.18 % where Ic was 97 A at 16 T and at a strain of −0.36 % where Ic was 19 A at 16 T. An applied strain of −0.36 % was selected so that a low value of Ic could be achieved at our highest magnetic field of 16 T. The results from the two Nb3Sn #1 specimens are close to each other and are only slightly higher than those of the Nb-Ti sample. Nb3Sn #2 was measured at three strains where the first two strains in the legend (−0.42 % and −0.39 %) correspond to the same specimen but different bypass flows (flow that we attempt to direct past H2 to help independently cool H1). We cannot quantify the amount of bypass flow, but Nb3Sn #2 (−0.42 %) had the least bypass flow and Nb3Sn #2 (−0.39 %) had the most bypass flow. The relative amount of bypass flow was determined by the extremes of relative impedance that we could achieve (see Sec. 2.1). The curves for these two cases of Nb3Sn #2 are close to each other and only slightly lower than those of the Nb-Ti sample, except for one point at the highest current. A more significant difference was observed, as expected, between these two flow cases in the slope of ΔT(H1) and ΔT(H2) as shown below. We typically operate in the configuration of the most bypass flow, but as we have described, the bypass flow is not very effective. The Nb3Sn #2 specimen measured at −0.36 % strain was one of the first measurements that we made with this probe, and we think that the self- and contact-heating was larger than for the other measurements, which likely caused the results to be the most different from those of the Nb-Ti sample. The results from the MgB2 sample were limited to currents less than 220 A, but they were in good agreement with the Nb-Ti results even though the temperature sensitivity of the MgB2 sample was significantly less than that of the Nb-Ti wire. For Ic less than 200 A, all seven cases have H2 = 0 to within ±10 mW. Using an approximate ΔT/H2 slope of −1.2 K/W, a 10 mW change in H2 is equivalent to a T shift of about 0.012 K. At about 600 A, the maximum difference from the Nb-Ti sample curve (not counting Nb3Sn #2 −0.36 %) is about 20 mW, which is equivalent to a T shift of about 0.024 K. For the worst case, the equivalent T shift is about 0.041 K. Again, remember that for a given conductor, the percentage change in Ic for a given change in T is less at the higher currents. These results demonstrate reproducibility and that appropriate H2 values are relatively independent of sample type and bypass flow.
Fig. 57.
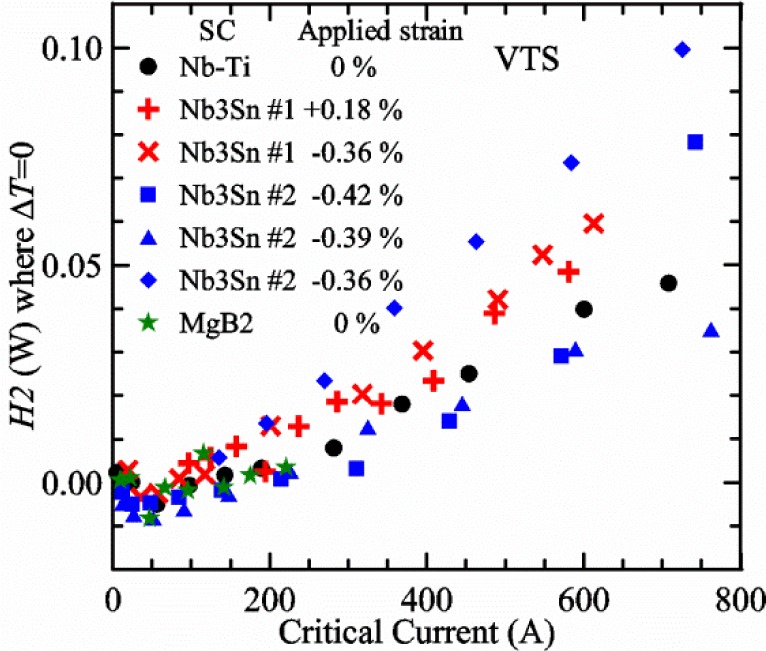
Plot of H2 where ΔT = 0 versus Ic for four samples that were soldered to the spring of the VTS probe. Some of the samples were measured under different applied strains and conditions. This is part of the correct protocol for VTM.
A plot the H1 where ΔT is zero versus Ic for the seven cases are shown in Fig. 58. These measurements were made with a T bias of zero. Thus, as expected, almost all of the H1 values where ΔT is zero are less than zero. For Ic less than 300 A, all of the cases are between zero and −20 mW. The curves for the two Nb3Sn #1 samples are close to each other. Except for the highest current, the curves for the two Nb3Sn #2 samples are also close to each other despite the difference in bypass flow.
Fig. 58.
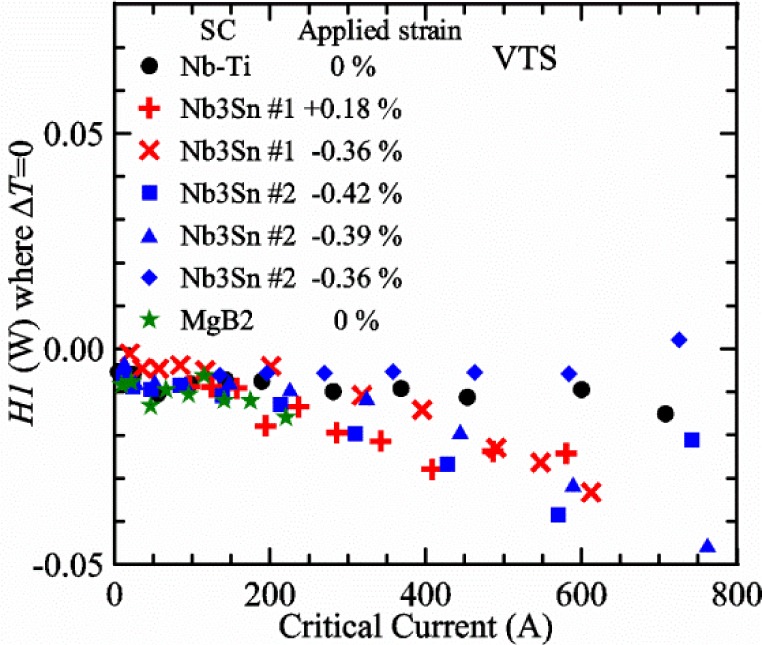
Plot of H1 where ΔT = 0 versus Ic for four samples that were soldered to the spring of the VTS probe. Some of the samples were measured under different applied strains and conditions.
We think that Figs. 31 and 57 illustrate a key result of our variable temperature measurements from all of the systems we have studied: at low Ic (less than 150 A) the correct gas measurements were taken with H2 between −0.01 W and 0.01 W. This verified the hypothesis of the high-gas flow system with a pre-regulator since one would expect that the thermometers and the sample would be at the same temperature under these conditions.
A plot of the slope of ΔT(H2) in units of K/W versus Ic is shown in Fig. 59 for the seven cases studied on the VTS probe. All of these data are based on liquid/gas comparisons at 5 K. We have also studied the slope of ΔT(H2) at temperatures above 5 K for the VTS probe and found that the slope is very similar to that at 5 K, which is just as we observed for the VTO probe as shown in Fig. 33. For the VTS probe, the average slope is −1.11 K/W and most of the values fall within a 0.6 K/W range. The slopes for the case with the least bypass flow (square symbol in Fig. 59) are the most negative, and the slopes with the most bypass flow (triangular symbol) are close to the upper band of values. This difference may or may not be significant.
Fig. 59.
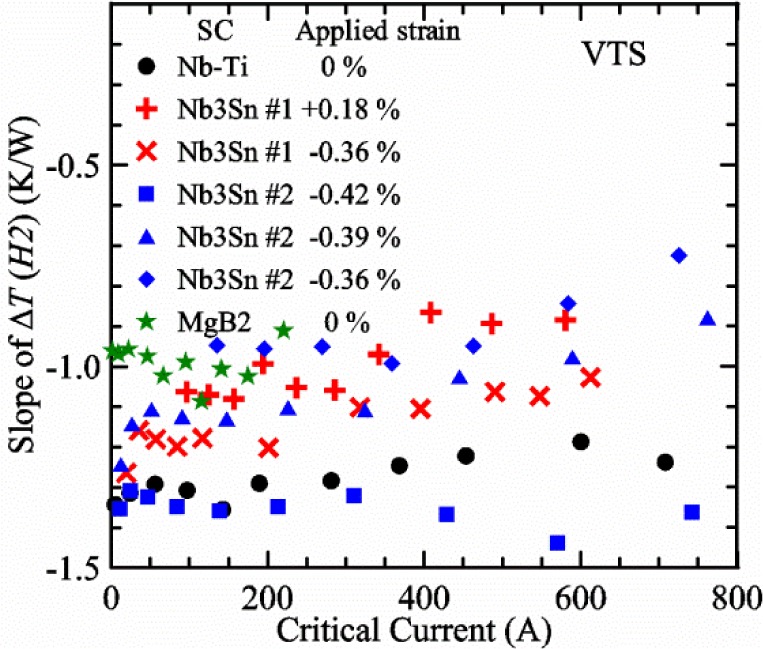
Plot of slope of the ΔT(H2) versus Ic for four samples that were soldered to the spring of the VTS probe. Some of the samples were measured under different applied strains and conditions.
A plot of the slope of ΔT(H1) in units of K/W versus Ic is shown in Fig. 60 for the seven cases studied on the VTS probe. All of these slopes are within a range of about 0.6 K/W and show a tendency to become less negative with increasing Ic. The average slope is −2.00 K/W.
Fig. 60.
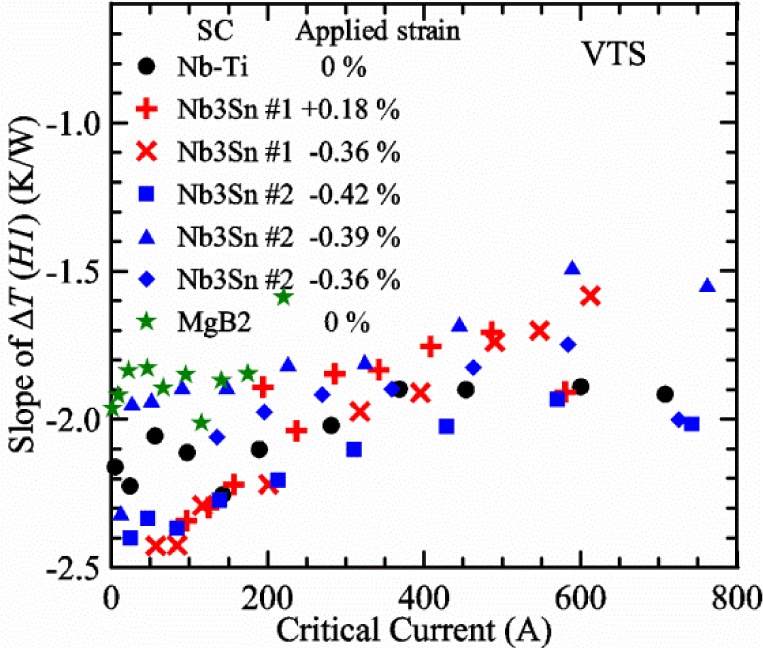
Plot of slope of the ΔT(H1) versus Ic for four samples that were soldered to the spring of the VTS probe. Some of the samples were measured under different applied strains and conditions.
4. Discussion
4.1 Commercial Variable Temperature Inserts and Non-Transport Ic Measurements
A number of commercial variable temperature inserts (VTIs) fit inside a superconducting magnet and use a flow of helium gas to cool the sample space. Typically, the gas flow rate of these systems is designed for a small heat load that operate only with sample currents of 1 A to 10 A maximum. The advantage of a commercial VTI for appropriate low-power measurements makes these systems the clear choice. They can be purchased with a complete set of hardware and fully automated software to do basic measurements such as AC and DC resistivity, Hall effect, heat capacity, DC magnetization, AC susceptibility, vibrating sample magnetometry, thermal conductivity, and critical current measurements. Systems are sold with various superconducting magnets up to 16 T. Commercial VTIs are as close to turn-key as cryogenic experiments can be. In addition, they can be customized platforms to do other low-power measurements. If an experiment could be performed in a commercial VTI, it is likely the most practical and efficient choice. Some newer systems are available cryogen-free, which means that they operate with very little, if any, liquid cryogen. They typically use just a small charge of high-purity helium gas in a closed-cycle cryocooler that cools the superconducting magnet and the sample space. Nonetheless, at this point, we do not know of any commercial VTI that has been converted to measure critical current at currents of 100 A or higher with temperature control on the order of 0.1 K or better.
Non-transport, contactless measurements of Ic can be made using a commercial VTI by measuring the magnetization of a superconducting sample as a function of magnetic field and applying the critical state model. This can be done at various temperatures to map the surface of Ic(H,T). Experiments like this were done in 1969 [16] and the variable temperature data that they provided were some key early results. Commercial VTIs were not available in 1969, but these measurements could be easily and efficiently done now in these systems. The sample and holder are very small and there is very little self-heating or heat load. The measurements can be done much faster and more autonomously than the transport measurements. The main difficulty with VTI measurements is estimating the Ic from the magnetization data, which requires a model and detailed information about the sample geometry and configuration of the superconductor within the composite conductor. There are often a number of simplifying assumptions that need to be made in order to derive the relationship between the magnetization and the Ic. In many cases, derived values are compared to, or scaled with, transport results where possible. Results from magnetization studies are useful; however, the superconductor community still relies on transport Ic measurements for definitive characterization.
4.2 Similarities and Differences Between Two NIST Probes, VTO and VTS
A number of components of the VTM system are the same when using each of the two probes. The same control, data acquisition, and analysis software are used. The same instrumentation, magnet and magnet dewar, re-entrant dewar, and pre-regulator are used with both probes. The same size vapor-cooled leads and type of heaters and thermometers are used.
The main result of the liquid/gas comparisons at 5 K was the relationship between H2 where ΔT is zero and Ic. For both probes, the H2 target needs to be near zero power for Ic < 150 A and the H2 target increases nonlinearly with current. This general result did not depend on the type of sample, and in the case of the VTO probe, it did not depend on whether the sample was soldered to the mandrel or not. The H2 target powers at higher current were somewhat different for the two probes, but the difference may depend on just current contact- and self-heating, and how much of current contact heating flows toward the sample versus how much flows to the terminals and heaters. The flow of the current contact heating was too uncertain to perform a quantitative comparison of contact heating between probes and even between different runs on the same probe. The additional variables of heat distribution along the contact and its dispersion reduced these comparisons to qualitative at best, which is why there is very little discussion of contact resistance in this paper other than that less contact resistance is better.
The general shapes of H1 where ΔT is zero versus Ic were very different for the two probes, mainly because H1 in the VTS probe has only downstream cooling. Thus, any cooling power that the gas would have as it flows over H1 would mean that the sample was sub-cooled. To make matters worse, the data suggested that H1 often needed to be negative for all Ic, which is not possible, and means that T1 needs to be controlled at a higher temperature than T2 to keep H1 positive. This lead to the T bias (T1–T2) experiments and the determination of the appropriate weighted temperature, Tw = 0.14 T1 +0.86 T2 for VTO and Tw = 0.18 T1 +0.82 T2 for VTS. The weighting coefficients were very similar for the two probes; however, the T bias necessary to change H1 relative to H2 was larger for the VTS probe. In general, we do not use a T bias for the VTO probe, but it is useful to use a T bias of about 30 mK or more for the VTS probe. If one sets T1 = X+0.0246 and T2 = X-0.0054, then Tw = X using the VTS equation. This example shows that the T bias adjustment has a small effect on T2 and potential changes in these coefficients would not introduce significant temperature effects.
The slopes of ΔT(H2) and ΔT(H1) for the two probes were different by a factor of about 2.5 in the case of ΔT(H2) and a factor of about 4 in the case of ΔT(H1). For a given probe, these slopes did not vary much with temperature. The significance of the ΔT(H2) slope is that it indicates how much H2 power will alter the sample temperature. We have no quantitative understanding of why these slopes are larger for the VTS probe. One measurable factor is how much the temperature set point of the pre-regulator needs to change to cause the total sample heater power (H1+H2) to change by 0.1 W for each of the systems with the same gas flow rate. For the VTS probe, the change in set point necessary was higher by more than a factor of 2 than that for the VTO probe, indicating that the difference between the two probes is due to the much smaller cooling surface of the VTS probe. For both probes the respective slopes of ΔT(H2) and ΔT(H1) did not change with temperature, although we did not show these data for the VTS probe.
The coil sample pitch lengths (3.2 mm for VTO and 6.4 mm for VTS) are different by a factor of 2 for the two probes. The longer pitch length spreads the contact heating over more cooling surface. In addition, the ends of the Cu-Be spring may reduce the amount of contact heating that flows to the active portion of the sample. These two factors may have caused the H2 where ΔT is zero at high currents to be less for the VTS probe than for the VTO probe. Another factor is that the thermometers and heaters are farther apart in the VTS probe, which also gives more cooling surface for the sample and current contacts.
4.3 Brief Description of Other Laboratories’ Variable Temperature Systems
In this section we provide a very brief review of VTM systems used by other laboratories to make transport critical-current measurements. We will discuss the perceived advantages and disadvantages of each approach. We will also put these systems into the context of our VTM system and our general results. Our systems use a high gas-flow rate with a pre-regulator to keep most of the heat away from the sample area. The most important result of our study, simply stated, is the higher the heater power near the sample, the higher the temperature gradients. Other systems that use a stagnate gas at one atmosphere of pressure or at very low pressure may have temperature gradients that depend more on heater power than a flowing gas system. If the heater power near the sample needs to be increased with sample temperature, then temperature gradients and potential temperature biases will systematically increase with T. The relative placement of the heater(s), thermometer(s), and sample, and details about the heat flow, will be factors in how much the heater power will affect the measured T and Ic. Numerous choices need to be made when designing a VTM system, and some of these choices result in trade-offs among complexity, temperature uncertainty, and current level. VTM of HTS samples can typically tolerate higher T uncertainties, unless, for example, precise determinations of the strain effect are needed. The cooling power needed for current leads and contact- and self-heating increases quickly with sample current above 100 A. The other VTM systems selected for review were found in a literature search that likely did not find all such systems. No slight was intended to those not cited. In many cases published articles do not go into the same level of detail as this paper, which limits the possible review and comparison.
Helium gas flow systems
Two VTM systems that use helium gas flow are at the University of Geneva [17,18] and at Kyoto University [19]. Both of these systems are VTS with a long sample length on a Walters spring device [13] and have thermometers above and below the sample. The University of Geneva has reported results up to about 300 A. Kyoto University sets the temperature of the gas flow 1 K to 2 K lower than the sample temperature. The gas flows from below the sample, indicating that a remote heater pre-regulates the flowing gas temperature. This probe also has sample heaters above and below the strain spring. This system, and perhaps the system at University of Geneva as well, seems to have a design that is the closest to our system with similar advantages and disadvantages. The setting of the gas temperature a fixed amount below the sample temperature would be simpler and less likely to become unstable than our more active control of sample cooling power. Kyoto University’s approach allows the sample heater power to be adjusted independent of the sample temperature and the sample heater power can be increased with current at a given temperature to provide cooling for sample contact- and self-heating. For each of these systems, it would be an interesting experiment to study the dependency of the measured Ic on sample heater power at a given T and H, indicating the sensitivity to this important parameter.
Inverted, insulating cup
Another design uses an inverted, insulating cup that is placed over the sample that is in a liquid helium bath. The cup is naturally full of helium gas at atmospheric pressure. Sometimes this type of device is called a bathysphere [20]. The lower part of the cup is typically insulated with a solid plug and some of the temperature difference between the sample and the surrounding bath occurs across this plug. The rest of the temperature gradient occurs across the helium gas. The University of Twente has three different systems that use this approach [21–24]. One system [21] has a U-shaped spring to vary the sample strain. A second system [22] has a coil sample on a Ti-6-4 barrel with heaters and thermometers above and below the coil sample. This is a VTO probe. The third system [23,24] has a single turn sample on a planar spring that is called a Pacman because of its shape. Sample heaters are located near the current contacts to provide a quick response to contact heating. The main advantages of the inverted cup design are its simplicity, sample cooling provided by a full atmosphere of helium gas, and cooling for the current leads and mechanical components is easily provided by the surrounding helium bath. The mechanical and electrical feed-throughs to the sample do not need to go through a vacuum seal; however, they typically need to go around the outside of the cup and up from the bottom. Ic values are reported to greater than 600 A.
As with other systems, it would be an interesting experiment to study the measured Ic dependency on sample heater power at a given T and H. It may not be possible to do this experiment in these systems as they are presently configured; however, it could be done by adding a Cu shield with an independent heater and thermometer. The Cu shield can have openings for the mechanical and electrical components; it just needs to be capable of intercepting some of the cooling power and provide a more isothermal environment for the sample. A different approach may be to place heaters on various mechanical and/or electrical couplers in the temperature gradient zone, but away from the sample. These heaters could be used to balance some of the steady-state conductive heat flow from the sample to the bath to establish the temperature gradient away from the sample. Systematically varying the power of these heaters and measuring the resulting Ic at a given T and H would indicate the relative importance of the sample heater-power parameter for inverted cup systems.
Vacuum can with helium exchange gas
There are too many examples of vacuum-can designs with helium heat-exchange gas to review each in detail [12, 25–31]. Typically in this approach, the current leads enter the magnet dewar helium bath, and then go through a vacuum feed-through into a can that is inside the bore of the magnet. In some cases, the vacuum space extends to a space at room temperature where mechanical and/or electrical feed-throughs are located. Even in the case of an extended vacuum space, the sample current may still go through the magnet dewar to provide the necessary cooling for the high-current leads, which has the advantage that the heat-load and heat generated by the sample current leads do not have a direct impact on the temperature control. The sample is held in the center of the field within the vacuum can. A controlled, small amount of helium is introduced into the vacuum space to act as a heat-exchange gas between the sample and the helium bath that surrounds the vacuum can. The sample current leads also conduct heat from the sample to the bath. Designing for high-current does increase the lead conduction to the bath. One of the typical disadvantages of the vacuum-can approach is creating a low-temperature, vacuum-tight seal for each sample.
A 1979 paper [25] showed impressive results to 1,200 A with a sample in a vacuum can. In general, other vacuum-can systems are limited to 300 A or less. A key feature of the system in [25] was a “hairpin” shaped sample that had only a short portion of the sample in perpendicular magnetic field. The rest of the sample was in parallel field where the temperature margin was higher and most of the contact heating could be handled. The “hairpin” geometry allows for a short sample length while reducing the effects of contact heating and current-transfer voltages. An advantage to having a short sample is that it is easier to control and measure the sample temperature. A capacitance thermometer was used for temperature control and three resistive thermometers were used to measure the temperature at different locations along the sample. There will be some current-transfer voltages along the portion of the sample that is in perpendicular magnetic field even though there is a long length in parallel field [32]. This will limit the sensitivity of the critical-current criterion for some samples, which is a general disadvantage for short sample lengths.
An early comprehensive paper from the University of Durham [12] describes their VTS system that uses a vacuum can. This system uses a Walters spring with a long sample length and a long copper cylinder with a heater around the spring. A thermometer was located on the spring next to the sample. The maximum current was about 25 A. This paper also mentions recent improvements that increased the maximum current to nearly 150 A when the sample is not immersed in liquid helium. These improvements included adding two more thermometers (one on each end of the sample) and three independent heaters for more uniform sample temperature.
An earlier paper describes a different vacuum-can system from the University of Durham [26] states that the heater was placed 15 cm from the sample to reduce temperature gradients along the sample, which is an advantage. However, a 15-cm separation also means that the heater cannot quickly respond to contact heating, which is a disadvantage. The PID parameters of the heater will also need to be kept slow to avoid temperature oscillations.
As with other systems, it would be an interesting experiment to study the measured Ic dependency on sample heater power at a given T and H. Adjusting the pressure of the exchange gas may allow different heater powers at the same temperature, but there is a range of pressure over which heat conduction is fairly independent of pressure due to the additional effect of the mean-free path that decreases with increasing pressure. Adding a Cu shield with an independent heater and thermometer could allow one to independently vary the heater power near the sample.
Supercritical helium
A few systems use supercritical helium as a coolant [33–36]. When the helium is at a temperature and pressure above the critical point, the helium is in the supercritical fluid state where distinct liquid and gas phases do not exist. In the referenced systems a flow of supercritical helium provides the cooling since no liquid-to-gas phase transition provides cooling. In [33] the operating pressure of the fluid is up to 0.29 MPa (42 psi) and the fluid flows over the current leads near the sample and then out the current leads to room temperature. This provides cooling for each end of the sample by thermal conduction down high-purity copper bus bars while the sample is isolated in a vacuum space. The cooling power is adjusted by a heater in the flowing fluid to achieve temperatures from 5 K to 20 K. Ic values are reported up to 600 A with temperature accuracy of ± 0.025 K up to 8 K and ± 0.05 K up to 17 K.
The SUpraLeitierTest ANlage (SULTAN) facility [34–36] is used to test large cable-in-conduit conductors (CICC) with forced-flow, supercritical helium cooling through the CICC samples. The CICC samples are cables that contain several hundred superconductors and, in some cases, additional copper wires (strands) in parallel. There is enough void area inside the conduit to allow the fluid to flow through the total length of the conductor. The operating pressure of the fluid is up to 1 MPa (145 psi) with a helium mass-flow rate of 1 g/s to 10 g/s. Sample currents up to 100,000 A can be achieved with a background magnetic field up to 10.85 T. Eighty channels of data are acquired during the sample testing. Comparisons between voltage tap and calorimetric measurements give agreement to within ± 0.1 K. This is clearly one of the largest and state-of-the art variable-temperature measurement systems for superconductors in the world.
5. Conclusions
Our approach to high-current, variable-temperature measurements is to cool the sample and current leads with a high-flow rate of helium gas, and to pre-regulate the cooling power of the gas with a heater that is located away from the superconducting sample. We use additional thermometers and heaters on each current contact, at end of the sample, for finer temperature control with low power levels near the sample. This approach reduces the temperature gradients between the sample thermometers and the relatively long sample. In our case, the samples are wires, 0.5 mm to 0.85 mm in diameter, with active lengths of more than 30 cm. In addition, the pre-regulator is located such that it will intercept a large fraction of the steady-state heat load flowing down the sample current leads and the heat load that is created when the sample current is on. Thus, most of the sample-current heat load simply replaces the pre-regulator heater power, which buffers the sample temperature control from the changing heat load conditions.
Direct comparisons of critical current measurements at 5 K with the sample immersed in pressurized liquid helium to those with the sample in flowing helium gas at 5 K allowed us determine the effect of, and to optimize, the measurement protocol. We demonstrated critical-current measurement results that are very repeatable from 4 A to 981 A with our variable-temperature only probe and from 5 A to 780 A with our variable-temperature, variable-strain probe.
Key conclusions for our variable temperature only (VTO) and variable-temperature, variable-strain (VTS) systems are:
The results of the comparison of measurements in liquid and in gas at the same temperature were independent of type of superconductor, although the Nb-Ti sample was more sensitive to temperature than the Nb3Sn and MgB2 samples. In the case of our VTO probe, the results were the same regardless of whether or not the sample was soldered to a mandrel.
Our primary sample heater power (H2, bottom contact) is an indicator of the cooling power of the flowing helium gas, and excess cooling power will sub-cool the sample relative to the sample thermometers. The apparent temperature errors increased systematically with sample heater power.
The liquid/gas comparison indicated that the correct protocol for the variable-temperature measurements is essentially to target a H2 sample heater power that is a function of critical current. This also requires a dynamically changing Pre-reg power.
For both of our systems, when the critical current is below 150 A, the “correct” measurements are obtained when the target H2 power is near zero, <0.01 W. The target heater power increases nonlinearly with critical current.
If the H2 sample heater power is too high by 0.1 W, this will cause a temperature error of about 0.04 K for the VTO and 0.12 K for the VTS systems.
The largest percentage of critical-current errors occur at lower currents (< 150 A) because of the high sensitivity of critical current to temperature.
Our VTS system is about 2.5 times more sensitive to sample heater power than our VTO system. This may be due to less cooling surface in the VTS probe compared to the VTO probe.
The cooling of the two-current contacts in our VTO system is more symmetric than for the VTS system because one of the current leads has to be rotated as strain is applied to the sample, so more space is occupied by mechanical components.
The cooling of the top contact in our VTS system is mainly downstream from the bottom contact and thus the heating of the top contact needs to be less than 0.01 W to obtain the “correct” measured critical current, regardless of the current level. However, we can use a temperature set point for the top contact that is slightly higher than the bottom contact to maintain better temperature control.
Key conclusions for other systems are:
Even small heater powers, less than 0.1 W, near the sample may cause temperature gradients of 0.04 K to 0.12 K depending on the details of the sample cooling. For a given conductor, this can have a bigger effect where the critical currents are low because of the higher sensitivity to temperature in those regions.
If possible, it would be useful to measure how much the critical current varies with heater power near the sample at constant temperature to determine how sensitive the system is to heater power levels.
If higher heater powers near the sample are necessary to achieve higher temperature, this could cause a systematically increasing bias with temperature. This could be reduced with a heated radiation shield between the sample and the cooling source.
Interlaboratory comparisons of variable-temperature measurements would be useful to verify the performance of the different types of variable-temperature systems.
Acknowledgments
This work was supported in part by U.S. Department of Energy, Office of Fusion Energy Sciences and Office of High Energy Physics (HEP), and the U.S. International Thermonuclear Experimental Reactor (ITER) Project Office. The authors acknowledge Supercon1, Luvata Waterbury, Oxford Superconductor Technology, Hyper Tech Research, and the U.S. HEP Conductor Development Program for providing superconducting samples for this study. The authors thank J. D. Splett for useful discussions, data fitting, and review of this paper. We thank the following Summer Undergraduate Research Fellowship (SURF) students who helped develop some of the software and hardware for this work: Joshua Williams, Robert LiKamWa, and Ildiko Walker. We also thank Kimberly A. Goodrich for instruction on document preparation.
Biography
About the authors: Loren F. Goodrich, Najib Cheggour, and Xifeng Lu are physicist in the Department of Physics at the University of Colorado-Boulder and guest researchers in the Magnetics Group of the Physical Measurement Laboratory at NIST. Theodore C. Stauffer is an electronics technician in the Magnetics Group of the Physical Measurement Laboratory at NIST. B. James Filla is a software developer and system integrator in the Office of Information Systems Management at NIST. The National Institute of Standards and Technology is an agency of the U.S. Department of Commerce.
Footnotes
Certain commercial equipment, instruments, or materials are identified in this paper to foster understanding. Such identification does not imply recommendation or endorsement by the National Institute of Standards and Technology, nor does it imply that the materials or equipment identified are necessarily the best available for the purpose.
Contributor Information
LF Goodrich, Email: loren.goodrich@nist.gov.
N Cheggour, Email: najib.cheggour@nist.gov.
TC Stauffer, Email: theodore.stauffer@nist.gov.
BJ Filla, Email: james.filla@nist.gov.
XF Lu, Email: xifeng.lu@nist.gov.
6. References
- 1.Ekin JW. Supercond Sci Technol. 2010;23:083001. doi: 10.1088/0953-2048/23/8/083001. [DOI] [Google Scholar]
- 2.Goodrich LF, Fickett FR. Cryogenics. 1982;22:225. doi: 10.1016/0011-2275(82)90120-5. [DOI] [Google Scholar]
- 3.Goodrich LF, Bray SL. Cryogenics. 1990;30:667. doi: 10.1016/0011-2275(90)90229-6. [DOI] [Google Scholar]
- 4.Ekin JW. J Appl Phys. 1978;49:3406. doi: 10.1063/1.325246. doi: 10.1063/1.325246. [DOI] [Google Scholar]
- 5.Tachikawa K, Itoh K, Wada H, Gould D, Jones H, Walters CR, Goodrich LF, Ekin JW, Bray SL. IEEE Trans Magn. 1989;25(2):2368. doi: 10.1109/20.92719. doi: 10.1109/20.92719. doi: 10.1109/20.92719. [DOI] [Google Scholar]
- 6.Wada H, Walters CR, Goodrich LF, Tachikawa K. Cryogenics. 1994;34:899. doi: 10.1016/S0011-2275(05)80212-7. doi: 10.1016/S0011-2275(05)80212-7. [DOI] [Google Scholar]
- 7.Wada H, Goodrich LF, Kate HJJ. Adv in Superconductivity. 1998;X:1417. [Google Scholar]
- 8.Goodrich LF, Stauffer TC. Adv Cryog Eng Mater. 2004;50B:338. [Google Scholar]
- 9.Goodrich LF, Cheggour N, Ekin JW, Stauffer TC. IEEE Trans Appl Supercond. 2007;17:1398. doi: 10.1109/TASC.2007.899592. doi: 10.1109/TASC.2007.899592. [DOI] [PMC free article] [PubMed] [Google Scholar]
- 10.Goodrich LF, Cheggour N, Lu XF, Splett JD, Stauffer TC, Filla BJ. Supercond Sci Technol. 2011;24:075022. doi: 10.1088/0953-2048/24/7/075022. [DOI] [Google Scholar]
- 11.Brandt BL, Liu DW, Rubin LG. Rev Sci Instrum. 1999;70:104. doi: 10.1063/1.1149549. [DOI] [Google Scholar]
- 12.Cheggour N, Hampshire DP. Rev Sci Instrum. 2000;71:4521. doi: 10.1063/1.1324734. [DOI] [Google Scholar]
- 13.Walters CR, Davidson IM, Tuck GE. Cryogenics. 1986;26:406. doi: 10.1016/0011-2275(86)90085-8. [DOI] [Google Scholar]
- 14.Goodrich LF, Stauffer TC. Adv Cryog Eng Mater. 2002;48B:1142. [Google Scholar]
- 15.Goodrich LF, Ekin JW, Fickett FR. Adv Cryog Eng Mater. 1982;28:571. doi: 10.1007/978-1-4613-3542-9_57. [DOI] [Google Scholar]
- 16.Fietz WA, Webb WW. Phys Rev. 1969;178:657. doi: 10.1103/PhysRev.178.657. [DOI] [Google Scholar]
- 17.Seeber B, Uglietti D, Abacherli V, Bovier PA, Eckert D, Kubler G, Lezza P, Pollini A, Flukiger R. Rev Sci Instrum. 2005;76:093901. doi: 10.1063/1.2018608. [DOI] [Google Scholar]
- 18.Uglietti D, Seeber B, Abacherli V, Carter WL, Flukiger R. Supercond SciTech. 2006;19:869. doi: 10.1088/0953-2048/19/8/032. doi: 10.1088/0953-2048/19/8/032. [DOI] [Google Scholar]
- 19.Sugano M, Itoh K, Kiyoshi T. IEEE Trans Appl Supercond. 2006;16:1039. doi: 10.1109/TASC.2005.864323. [DOI] [Google Scholar]
- 20.Moreland J, Li Y, Folsom R, Capobianco TE. Rev Sci Instrum. 1988;59:2535. doi: 10.1063/1.1139893. [DOI] [Google Scholar]
- 21.Haken B, Godeke A, Kate HHJ. IEEE Trans Appl Supercond. 1993;3:1273. doi: 10.1109/77.233392. [DOI] [Google Scholar]
- 22.Haken B, Godeke A, Kate HHJ. J Appl Phys. 1999;85:3247. doi: 10.1063/1.369667. [DOI] [Google Scholar]
- 23.Godeke A, Dhallé M, Morelli A, Stobbelaar L, van Weeren H, van Eck HJN, Abbas W, Nijhuis A, den Ouden A, Haken B. Rev Sci Instrum. 2004;75:5112. doi: 10.1063/1.1819384. [DOI] [Google Scholar]
- 24.Ilyin Y, Nijhuis A, Krooshoop E. Supercond SciTech. 2007;20:186. doi: 10.1088/0953-2048/20/3/013. [DOI] [Google Scholar]
- 25.Spencer CR, Sanger PA, Young M. IEEE Trans Magn. 1979;15:76. doi: 10.1109/TMAG.1979.1060146. [DOI] [Google Scholar]
- 26.Friend CM, Hampshire DP. Meas Sci Technol. 1995;6:98. doi: 10.1088/0957-0233/6/1/016. [DOI] [Google Scholar]
- 27.Hudson PA, Yin FC, Jones H. IEEE Trans Magn. 1981;17:1649. doi: 10.1109/TMAG.1981.1061455. doi: 10.1109/TMAG.1981.1061455. [DOI] [Google Scholar]
- 28.Nunoya Y, Isono T, Koizumi N, Hamada K, Nabara Y, Okuno K. IEEE Trans Appl Supercond. 2007;17:2588. doi: 10.1109/TASC.2007.899600. [DOI] [Google Scholar]
- 29.Oh S, Lee C, Choi H, Moon K, Kim K, Kim J, Park PY. IEEE Trans Appl Supercond. 2008;18:1063. doi: 10.1109/TASC.2008.921254. [DOI] [Google Scholar]
- 30.Schauer W, Zimmermann F. Adv Cryo Eng. 1980;26:432. doi: 10.1007/978-1-4613-9859-2_50. [DOI] [Google Scholar]
- 31.Finnemore DK, Ostenson JE, Gibson ED, Verhoeven JD, Doyle TB. J Appl Phys. 1983;54:1476. doi: 10.1063/1.332175. [DOI] [Google Scholar]
- 32.Goodrich LF. IEEE Trans Magn. 1983;19:244. doi: 10.1109/TMAG.1983.1062361. [DOI] [Google Scholar]
- 33.Martínez A, Duchateau JL. Cryogenics. 1997;37:865. doi: 10.1016/S0011-2275(97)00151-3. [DOI] [Google Scholar]
- 34.Bruzzone P, Anghel A, Fuchs A, Pasztor G, Stepanov B, Vogel M, Vecsey G. IEEE Trans Appl Supercond. 2002;12:520. doi: 10.1109/TASC.2002.1018457. doi: 10.1109/TASC.2002.1018457. doi: 10.1109/TASC.2002.1018457. doi: 10.1109/TASC.2002.1018457. [DOI] [Google Scholar]
- 35.Bruzzone P, Stepanov B, Wesche R, Salpietro E, Vostner A, Okuno K, Isono T, Takahashi Y, Kim HC, Kim K, Shikov AK, Sytnikov VE. IEEE Trans Appl Supercond. 2008;18:459. doi: 10.1109/TASC.2008.922268. doi: 10.1109/TASC.2008.922268. doi: 10.1109/TASC.2008.922268. [DOI] [Google Scholar]
- 36.Bruzzone P, Stepanov B, Wesche R, Ilyin Y, Herzog R, Calvi M, Bagnasco M, Cau F. IEEE Trans Appl Supercond. 2009;19:1508. doi: 10.1109/TASC.2009.2018508. doi: 10.1109/TASC.2009.2018508. [DOI] [Google Scholar]


